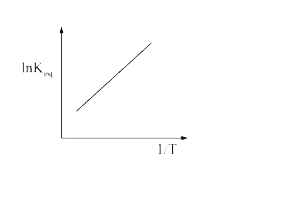
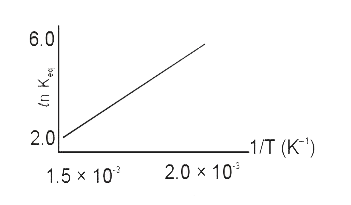
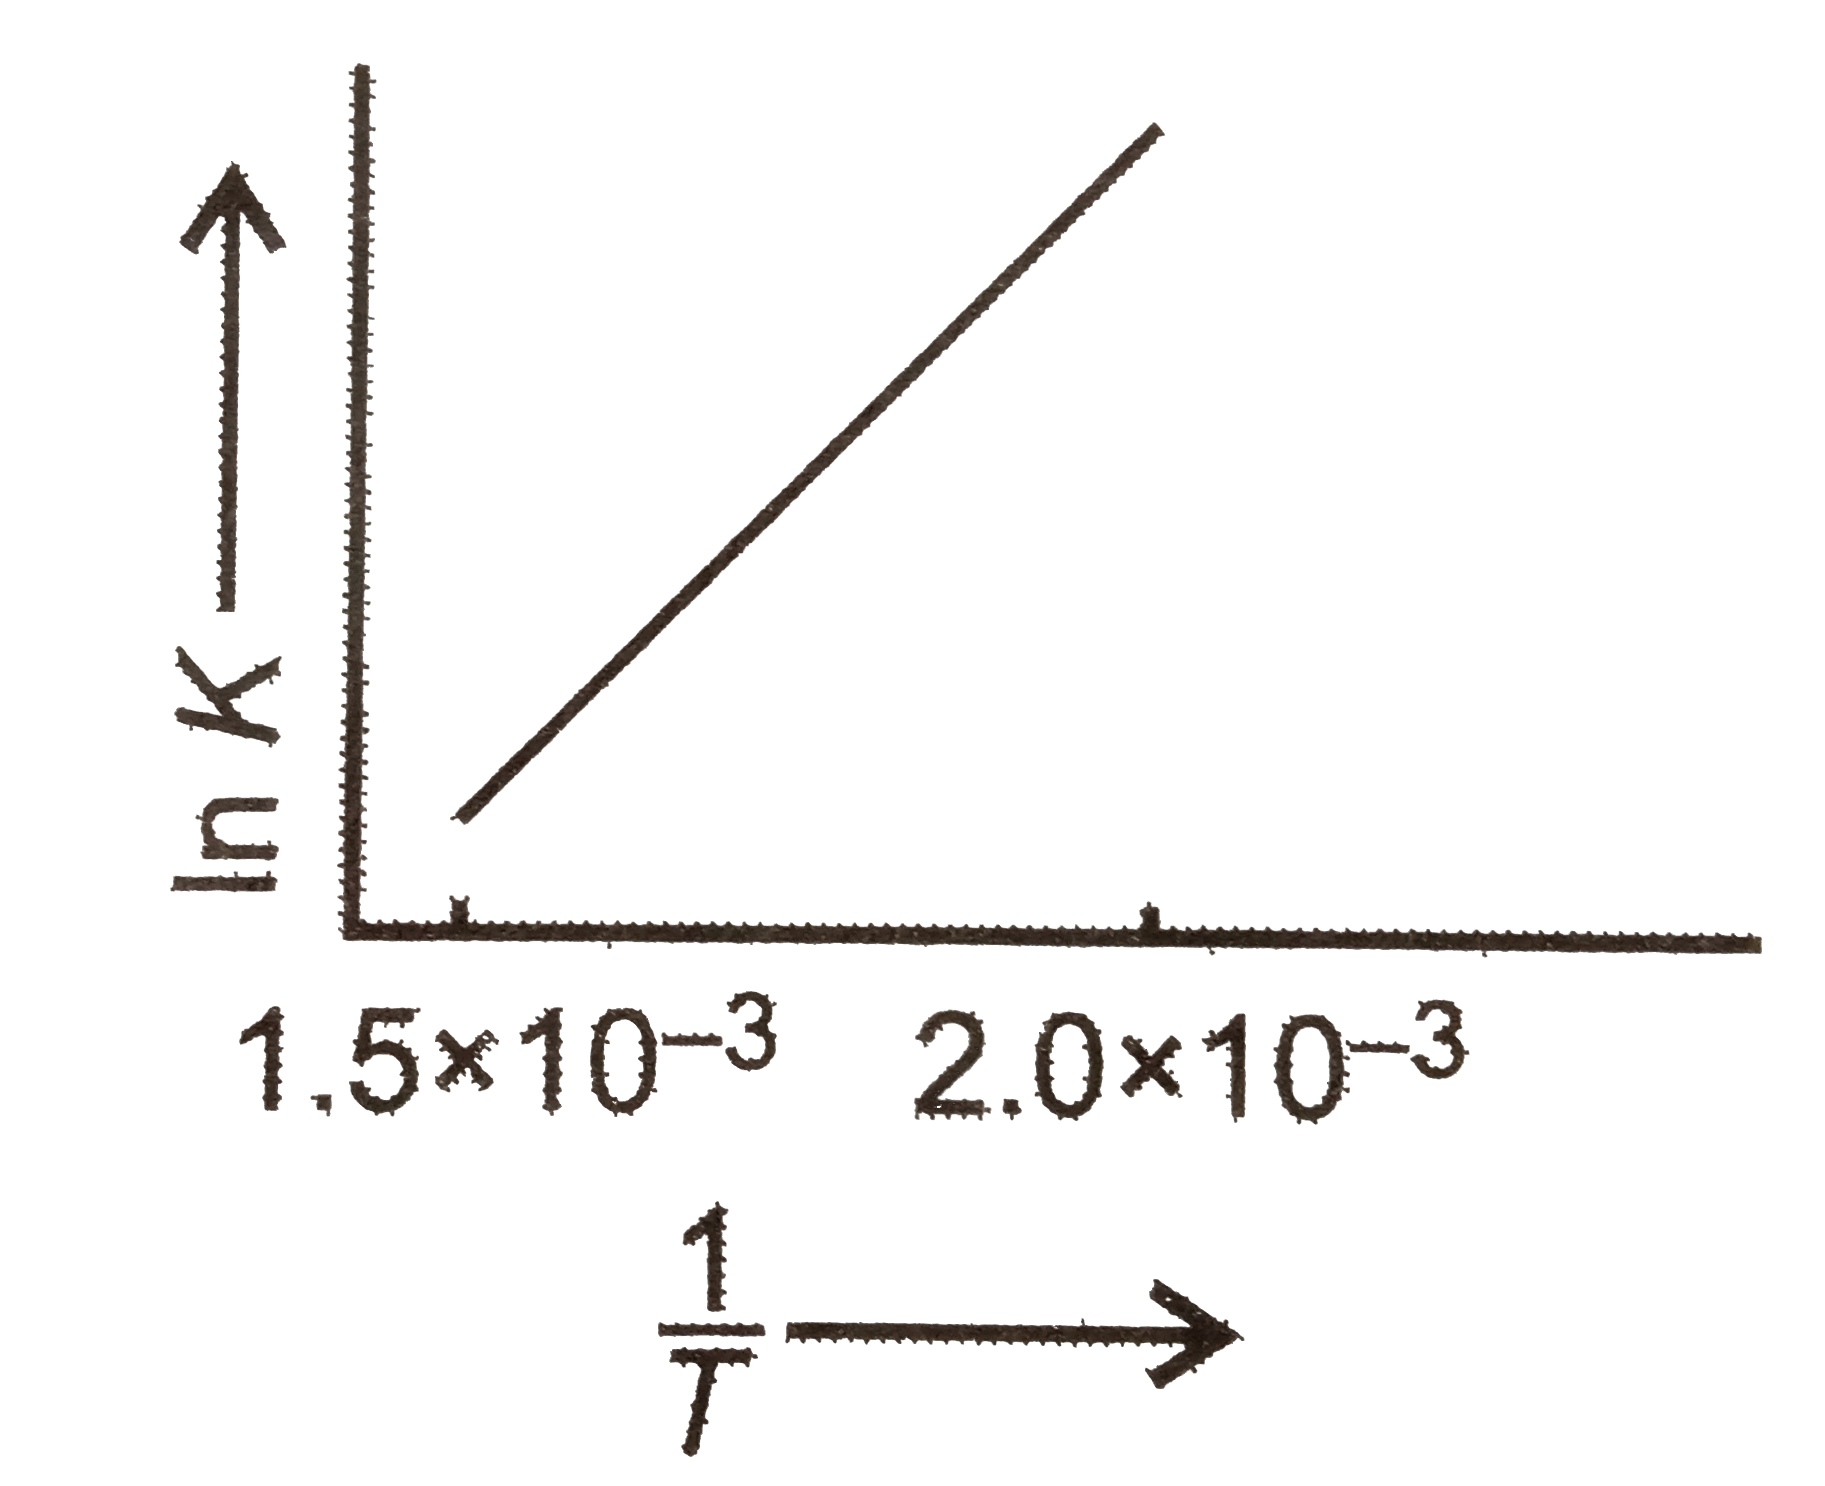
A schematic plot of In Keq versus inverse o ftemperature for a reaction is shown below
the reaction must be:
A
exothermic
B
Endothermic
C
one with negligible enthalpy change
D
highly spontaneous at ordinary temperature
Video Solution
Text Solution
The correct Answer is:A
Integrated form of van't Hoff equation
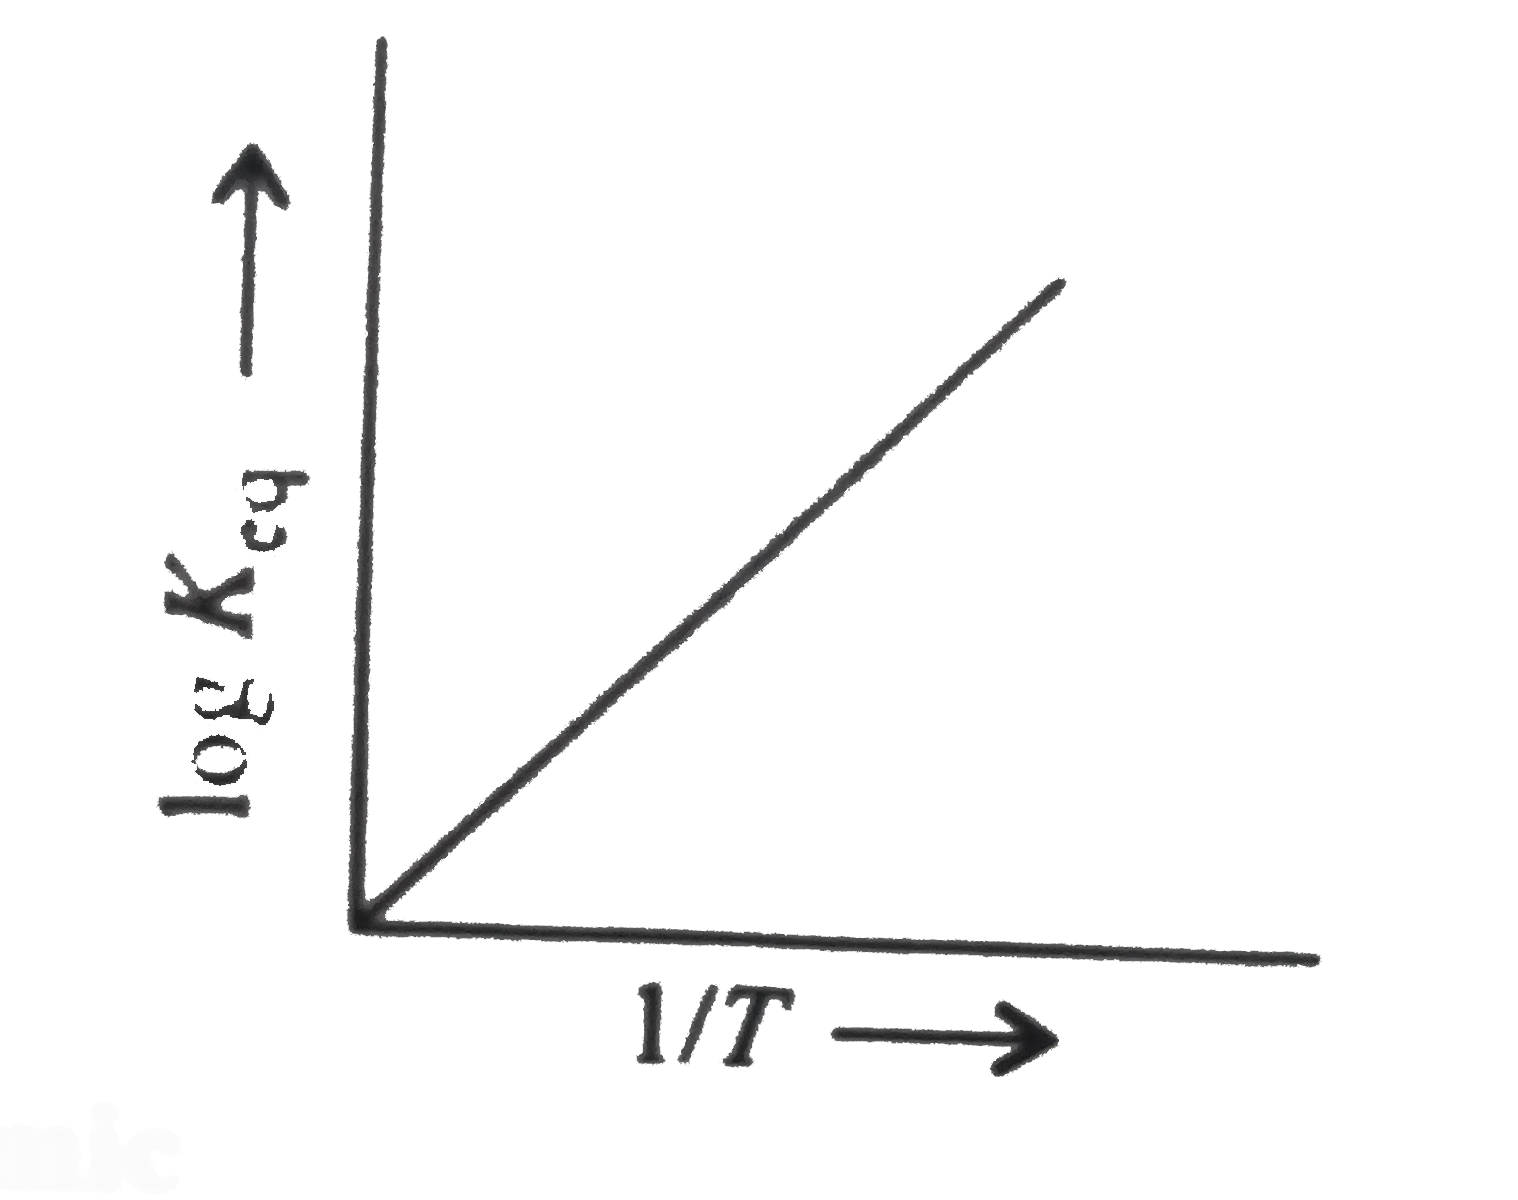
lnKp=−ΔH∘R1T+I
The given line has a+ve slpe
∴−ΔH∘R>0 ltbgt ⇒ΔH∘<0(∴R=0.0821L atm K−1mol−1)
Thus , the reaction is exothermic in nature.
|
Topper's Solved these Questions
- PHYSICAL AND CHEMICAL EQUILIBRIABOOK - DINESH PUBLICATIONCHAPTER - PHYSICAL AND CHEMICAL EQUILIBRIAEXERCISE - SELECTED STRAIGHT OBJECTIVE TYPE MCQs
4 Videos
- PHYSICAL AND CHEMICAL EQUILIBRIABOOK - DINESH PUBLICATIONCHAPTER - PHYSICAL AND CHEMICAL EQUILIBRIAEXERCISE - MCQs with only one correct answer
24 Videos
- PHYSICAL AND CHEMICAL EQUILIBRIABOOK - DINESH PUBLICATIONCHAPTER - PHYSICAL AND CHEMICAL EQUILIBRIAEXERCISE - Multiple CHOICE QUESTIONS [Based on Numerical Problems]
62 Videos
- P BLOCK ELEMENTS (GROUP 13 AND 14 )BOOK - DINESH PUBLICATIONCHAPTER - P BLOCK ELEMENTS (GROUP 13 AND 14 )EXERCISE - Straight obj.
17 Videos
- RATES OF REACTIONS AND CHEMICAL KINETICSBOOK - DINESH PUBLICATIONCHAPTER - RATES OF REACTIONS AND CHEMICAL KINETICSEXERCISE - Ultimate Preparatory Package
29 Videos
Similar Questions
Knowledge Check
A schematic plot of ln Keq versus inverse of temperature for a reaction is shown below
The reaction must beAendothermicBexothermicChighly spontaneous at ordinary temperatureDone with negligible enthalpy changeA schematic plot of log Keq vs inverse of temperature for a reaction is shown in the figure. The reaction must be:
 AExothermicBEndothermicCOne with negligible enthalpy changeDHighly spontaneous at ordinary temperature
The plot of In k versus 1T is liner with slope of
AEaRBEa2.303RCIn AD−EaR
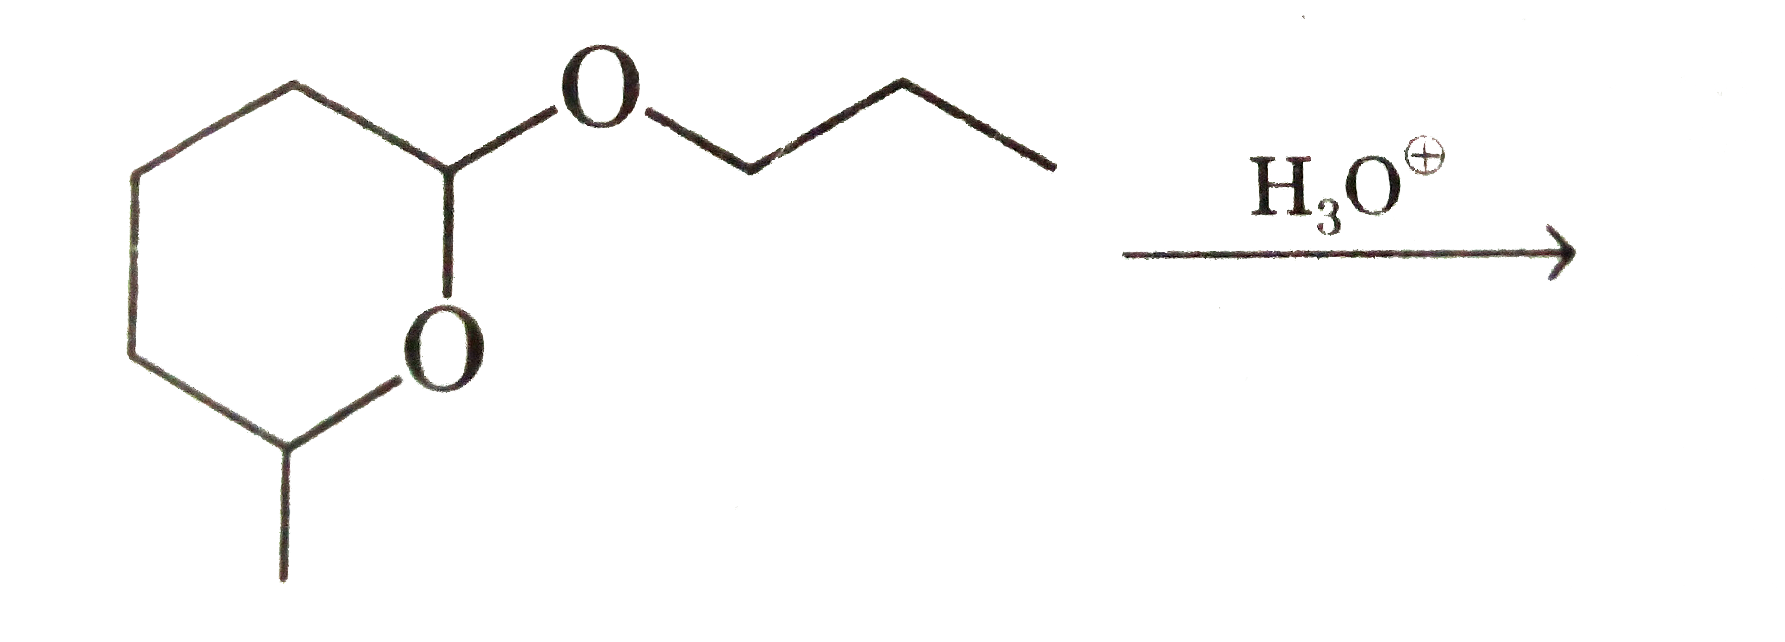
What are the most likely products of the reaction shown below ?
View SolutionWhich of the following species is an intermediate in the reaction shown below?
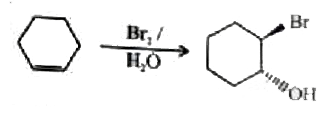
View SolutionWhich of the following species is an intermediate in the reaction shown below?

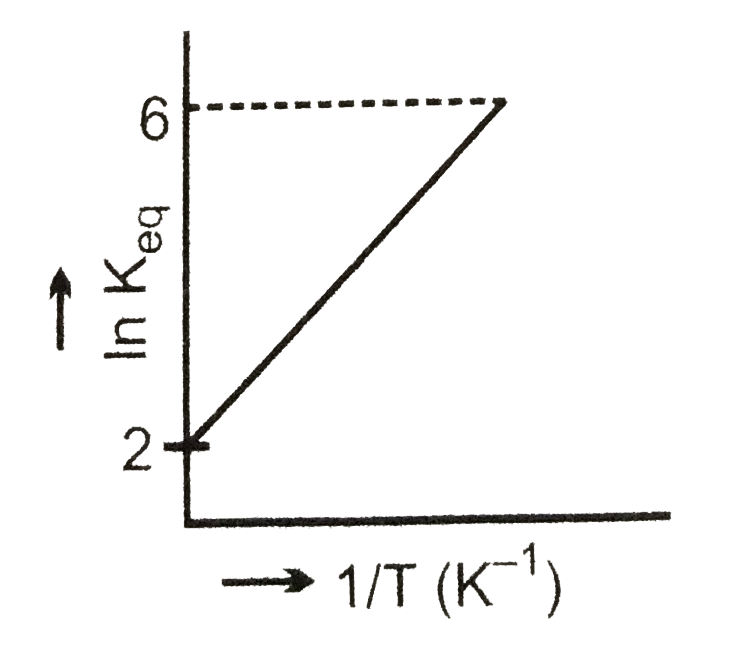
View SolutionThe graph relates. In Keq.vs.1T for a reaction. The reaction must be:
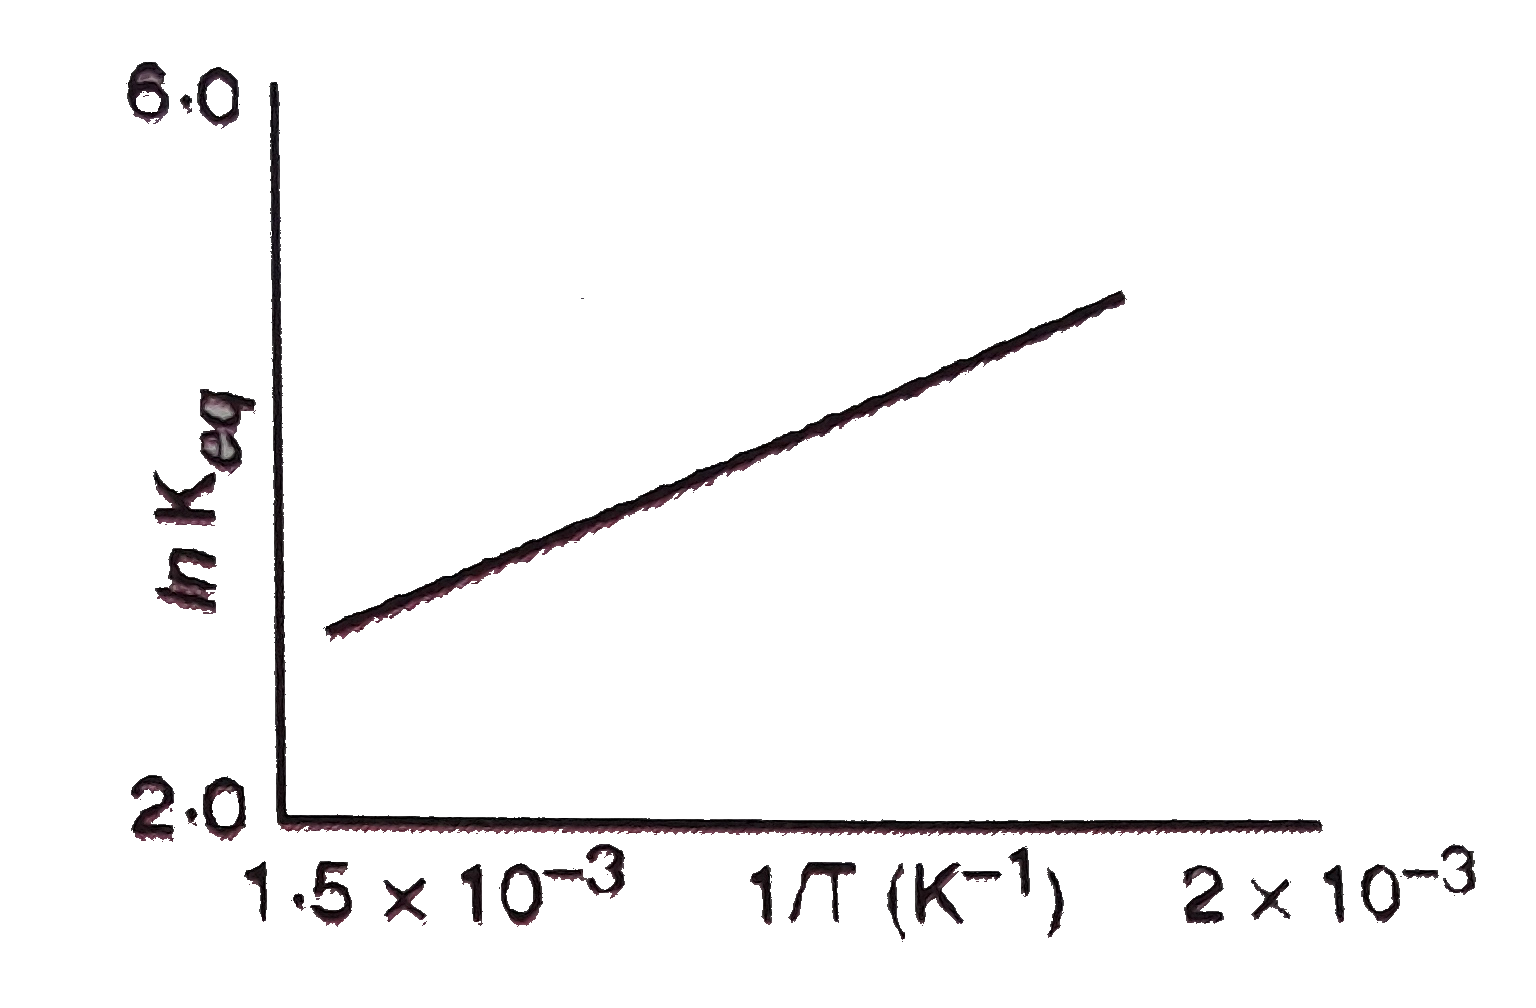
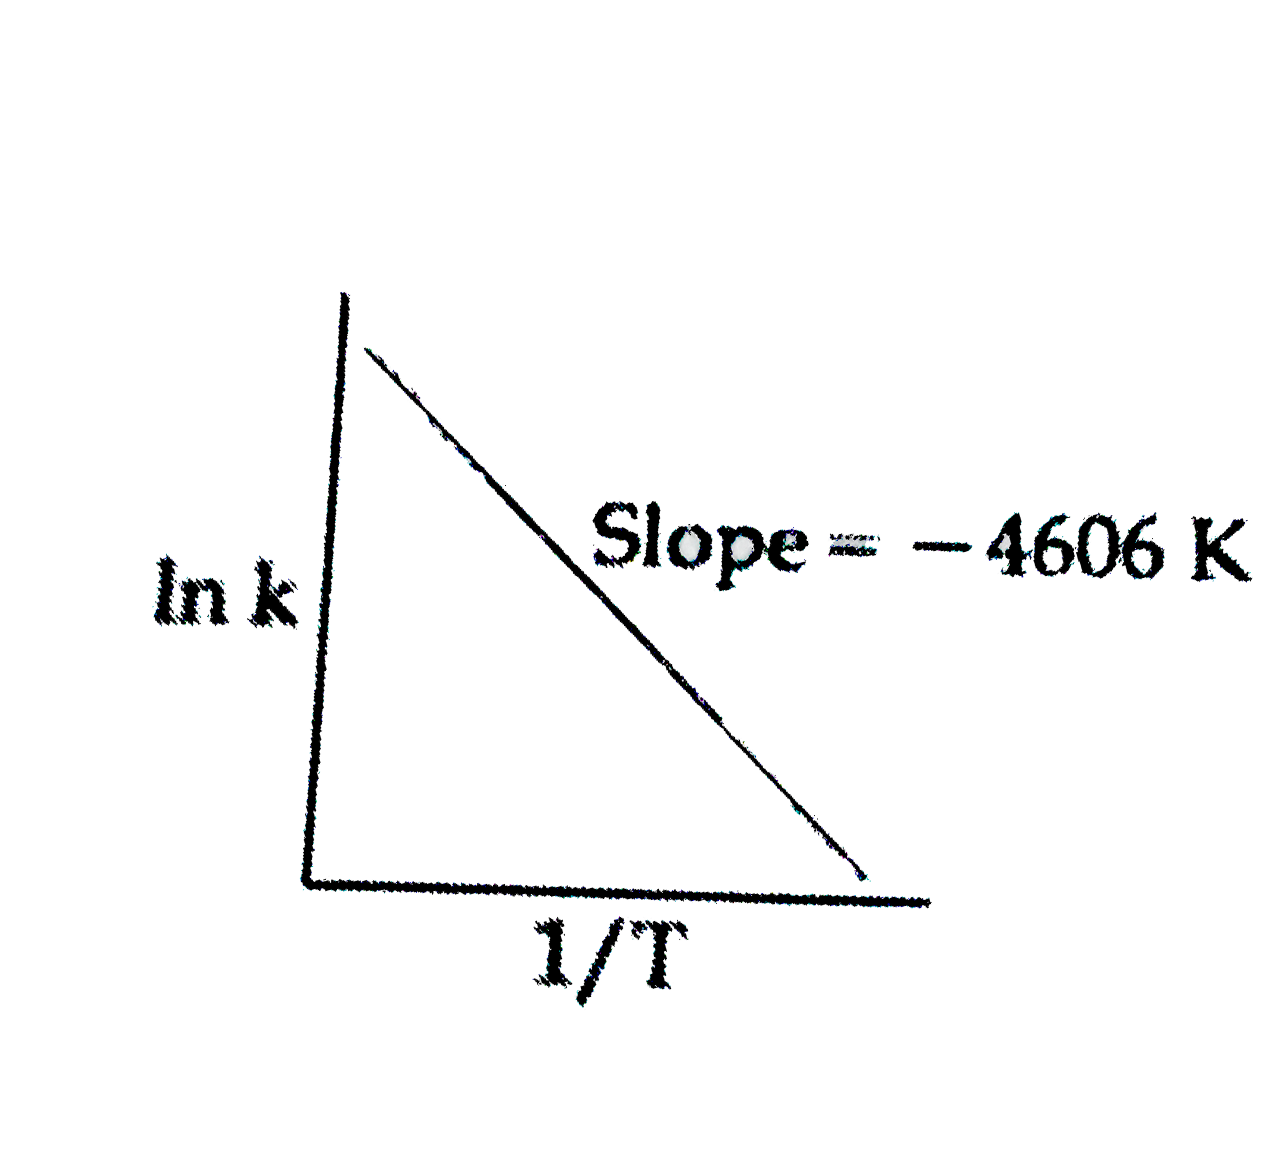
View SolutionFor a reaction, consider the plot of In K versus 1/T given in the figure. If the rate constant of this reaction at 400 K is 10−5s−1, then the rate constant at 500K is :
View Solution

