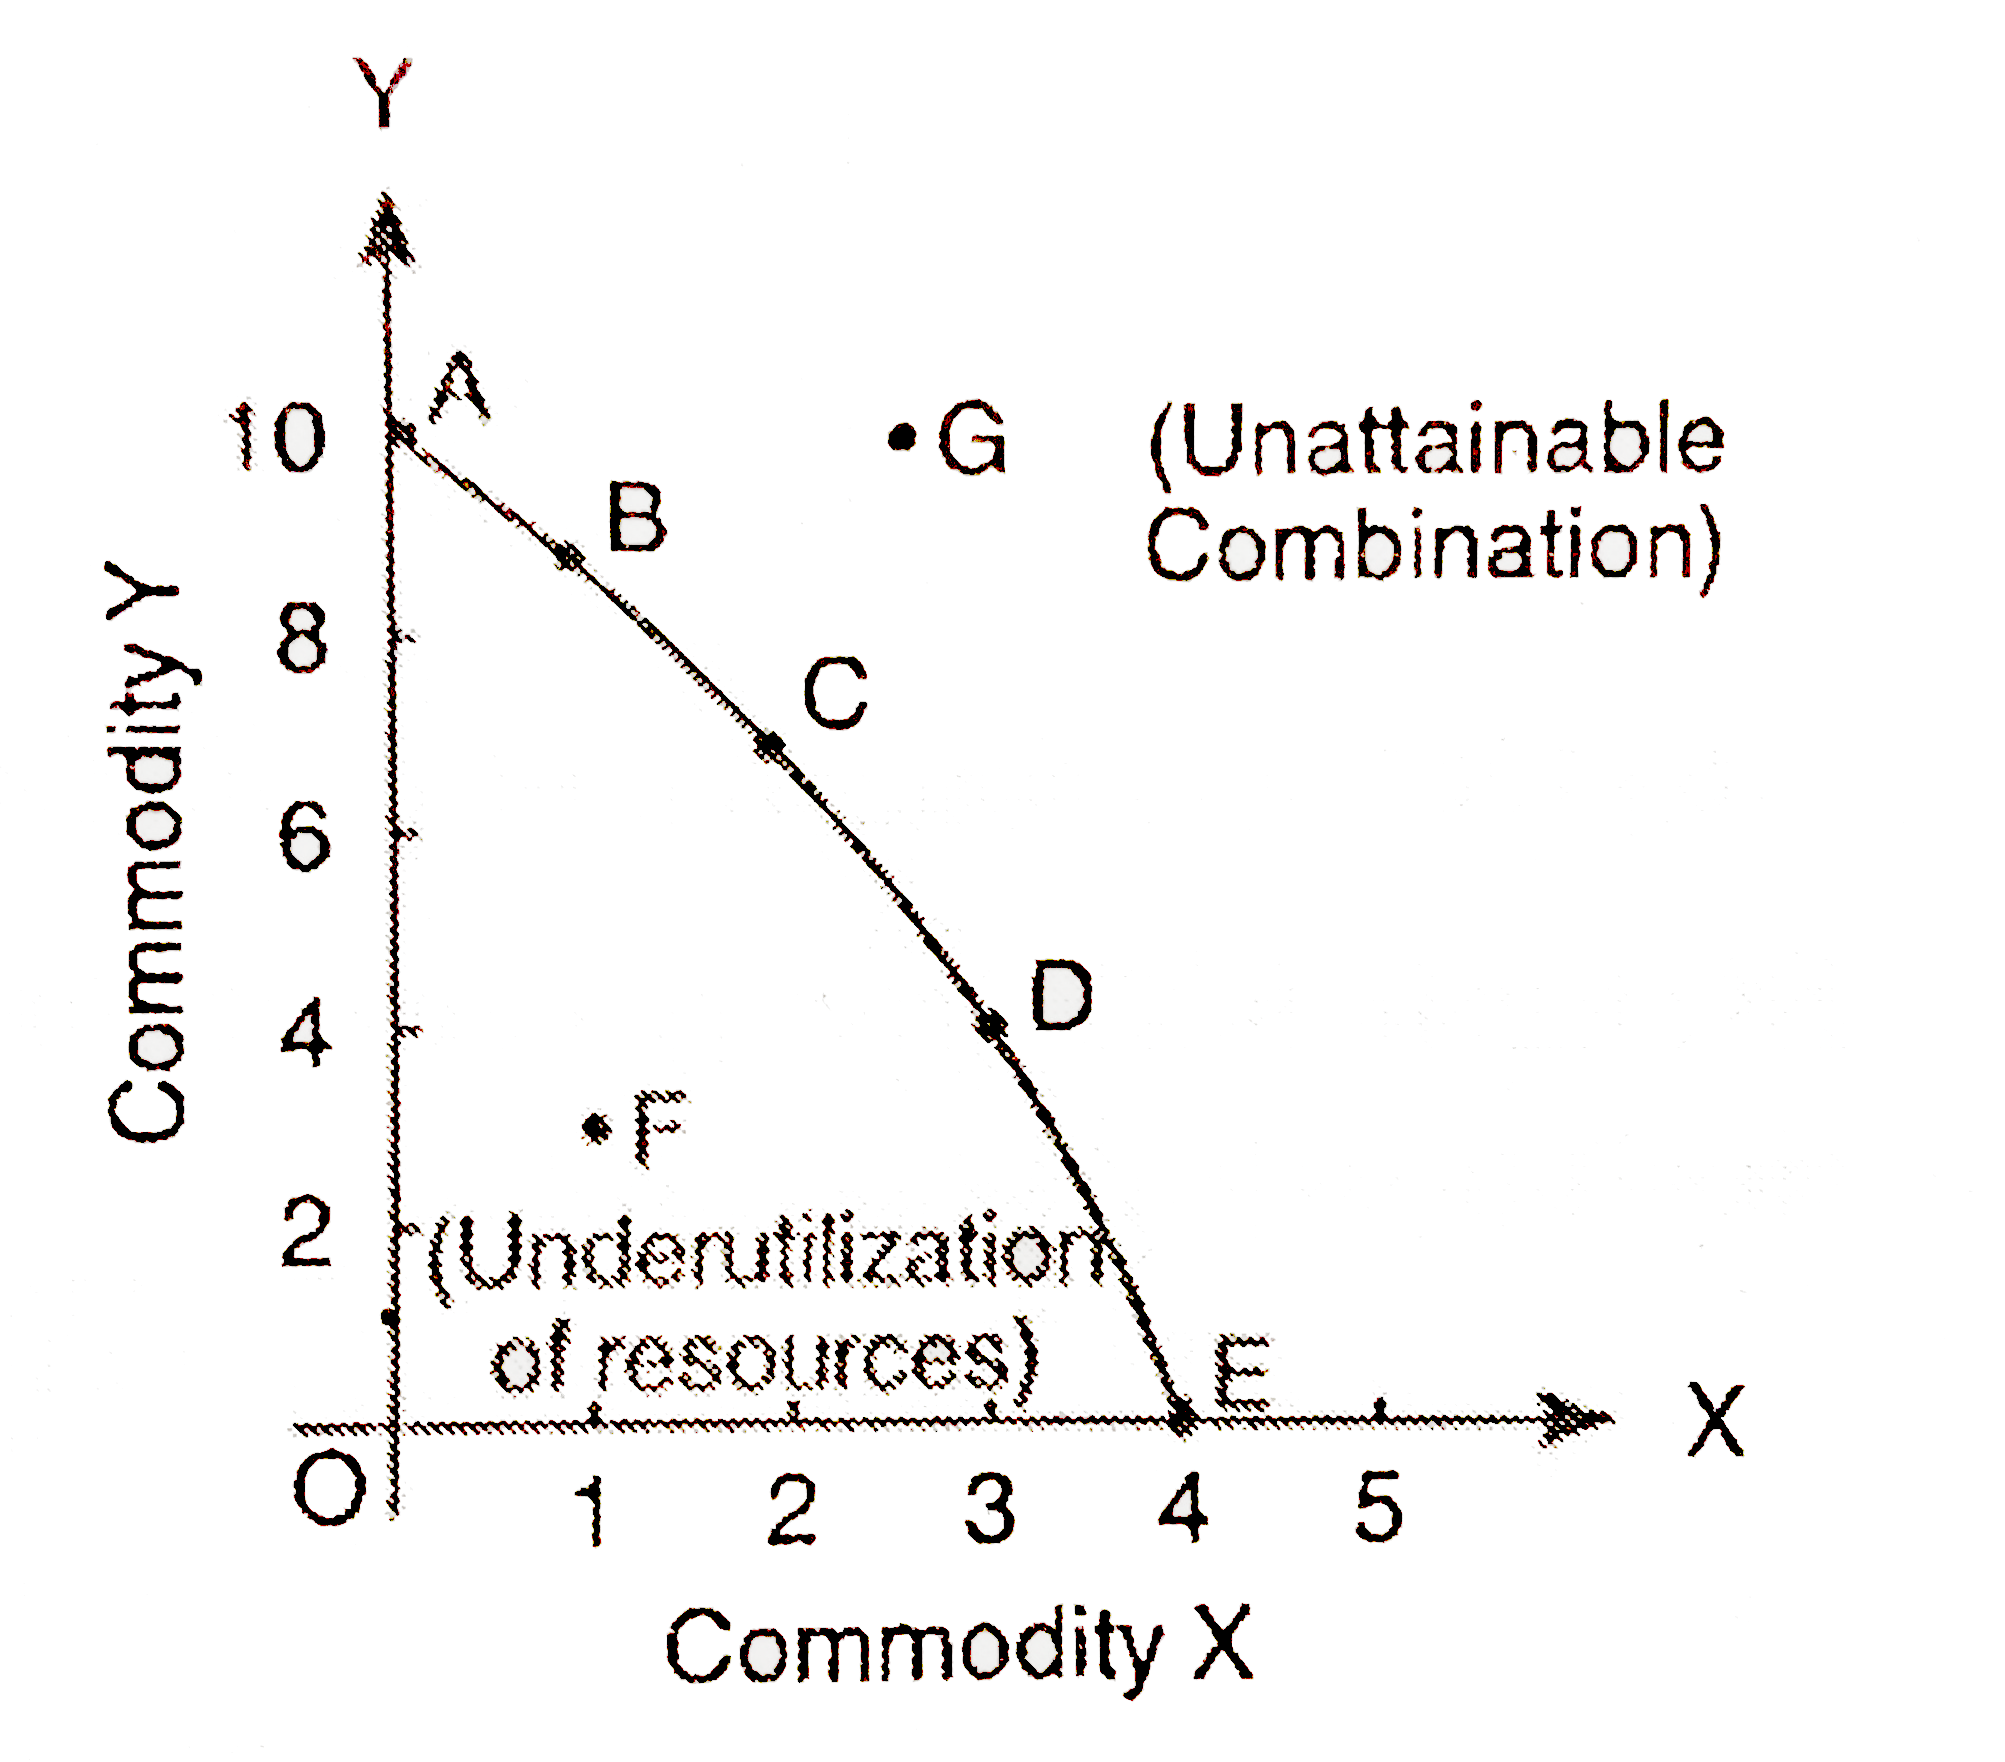
The following table depicts the production possibilities of commondiaties X and Y:

(a) Show these production possibilities through PPF. What do the points on the curve indicate?
(b) Lable a point F inside the curve. What does this point indicate?
(c ) Lable a point G outside the curve. What does this point indicate?
(d) What must occur so that economy can attain the level of production as indicated by point G.
Text Solution
(a)The given diagram shows all the production possibilities given in the table. Point on the curve (A to E) indicate that there is fuller utilization of resources,
(b) Point F inside the curve indicates under utilization of resources,
(c ) Point G outside to curve indicates an unattainable combination,
(d) Economy can attain the level of production as indicated by point G, only when there is an increase in resources or an improvement in technology with respect to both commodities X and Y.

|
Topper's Solved these Questions
- INTRODUCTIONBOOK - SANDEEP GARGCHAPTER - INTRODUCTIONEXERCISE - HOTS HIGHER ORDER THINKING SKILLS QUESTIONS
32 Videos
- INTRODUCTIONBOOK - SANDEEP GARGCHAPTER - INTRODUCTIONEXERCISE - TRUE AND FALSE
17 Videos
- ELASTICITY OF DEMANDBOOK - SANDEEP GARGCHAPTER - ELASTICITY OF DEMANDEXERCISE - Unsolved practicals
79 Videos
- MAIN MARKET FORMSBOOK - SANDEEP GARGCHAPTER - MAIN MARKET FORMSEXERCISE - Very short
17 Videos
Similar Questions
Knowledge Check
What does the Lorenz curve indicate?
ARelationship between the price of a certain commodity and its demand.BIncome distributionCRate of employmentDTaxable income elasticityWhat does the Lorenz Curve indicate ?
ARelationship between the price of a certain commodity and its demandBIncome distributionCTaxable income elasticityDRate of employmentWhat is the maximum point on the curve x=exy ?
A(1,e)B(1,e−1)C(e,1)D(e−1,1)
What do all points indifference curve indicate ?
View SolutionDraw a production possibility frontier. What does a point below this curve indicate ? Explain.
View SolutionWhat does the slope of PPF indicate?
View SolutionWhat is the maximum point on the curve x=exy ?
View SolutionA point outside the PPF indicates:
View Solution
