On the basis og given diagram, answer the following questions:
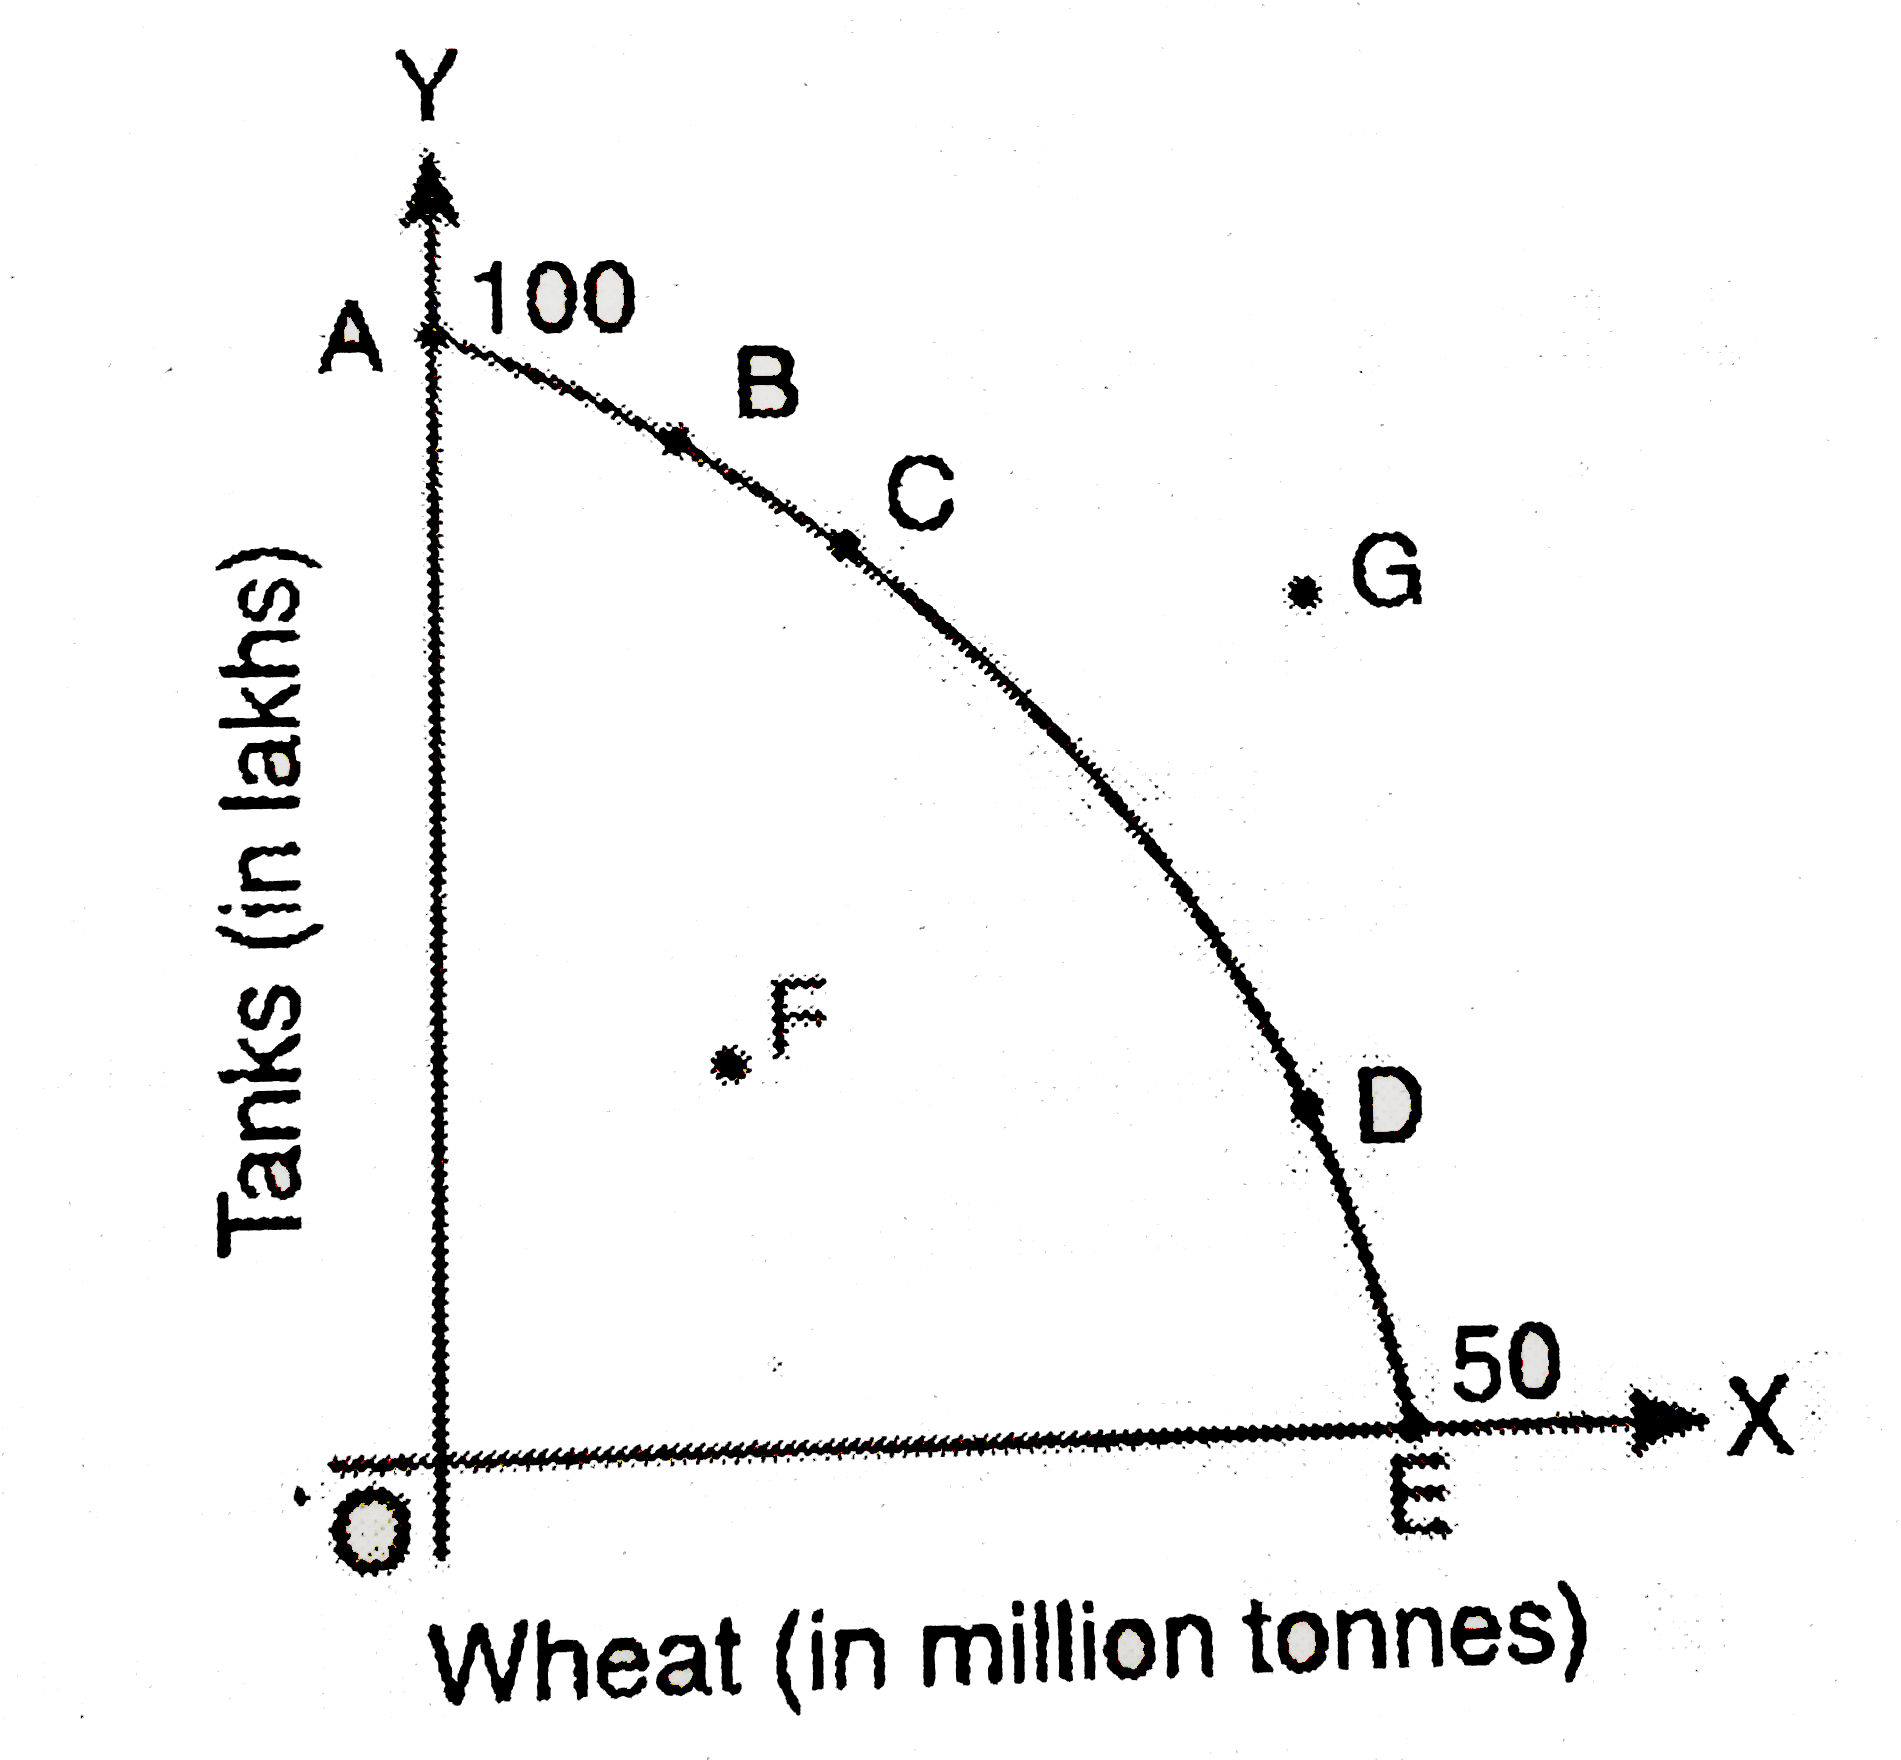
(i) On the production possiblility curve AE, if the economy decides to produce 50 million tonnes of wheat then how many tanks it can produce ?
(ii) If there is growth in resources, what will appen to the production possibility curve
(iii) Which point in the diagram represents underutillisation of resources?
(iv) Which of the points n diagram is an unattainable combination?
(v) Identify the point at whihc the economy will operate if resources are fully and efficiently utilised.

(i) zero Tanks.
(ii) The production possibility curve will shift towards right.
(iii) Point F.
(iv) Point G.
(v) If resources are fully and efficiently utilized, economy can operate at any point (like points A, B,C, or E) on the production possibility curve.
Topper's Solved these Questions
- INTRODUCTIONBOOK - SANDEEP GARGCHAPTER - INTRODUCTIONEXERCISE - TRUE AND FALSE
17 Videos
- INTRODUCTIONBOOK - SANDEEP GARGCHAPTER - INTRODUCTIONEXERCISE - GUIDELINES TO NCERT WUESTIONS
8 Videos
- INTRODUCTIONBOOK - SANDEEP GARGCHAPTER - INTRODUCTIONEXERCISE - UNSOLVED PRACTICALS
6 Videos
- ELASTICITY OF DEMANDBOOK - SANDEEP GARGCHAPTER - ELASTICITY OF DEMANDEXERCISE - Unsolved practicals
79 Videos
- MAIN MARKET FORMSBOOK - SANDEEP GARGCHAPTER - MAIN MARKET FORMSEXERCISE - Very short
17 Videos
Similar Questions
Knowledge Check
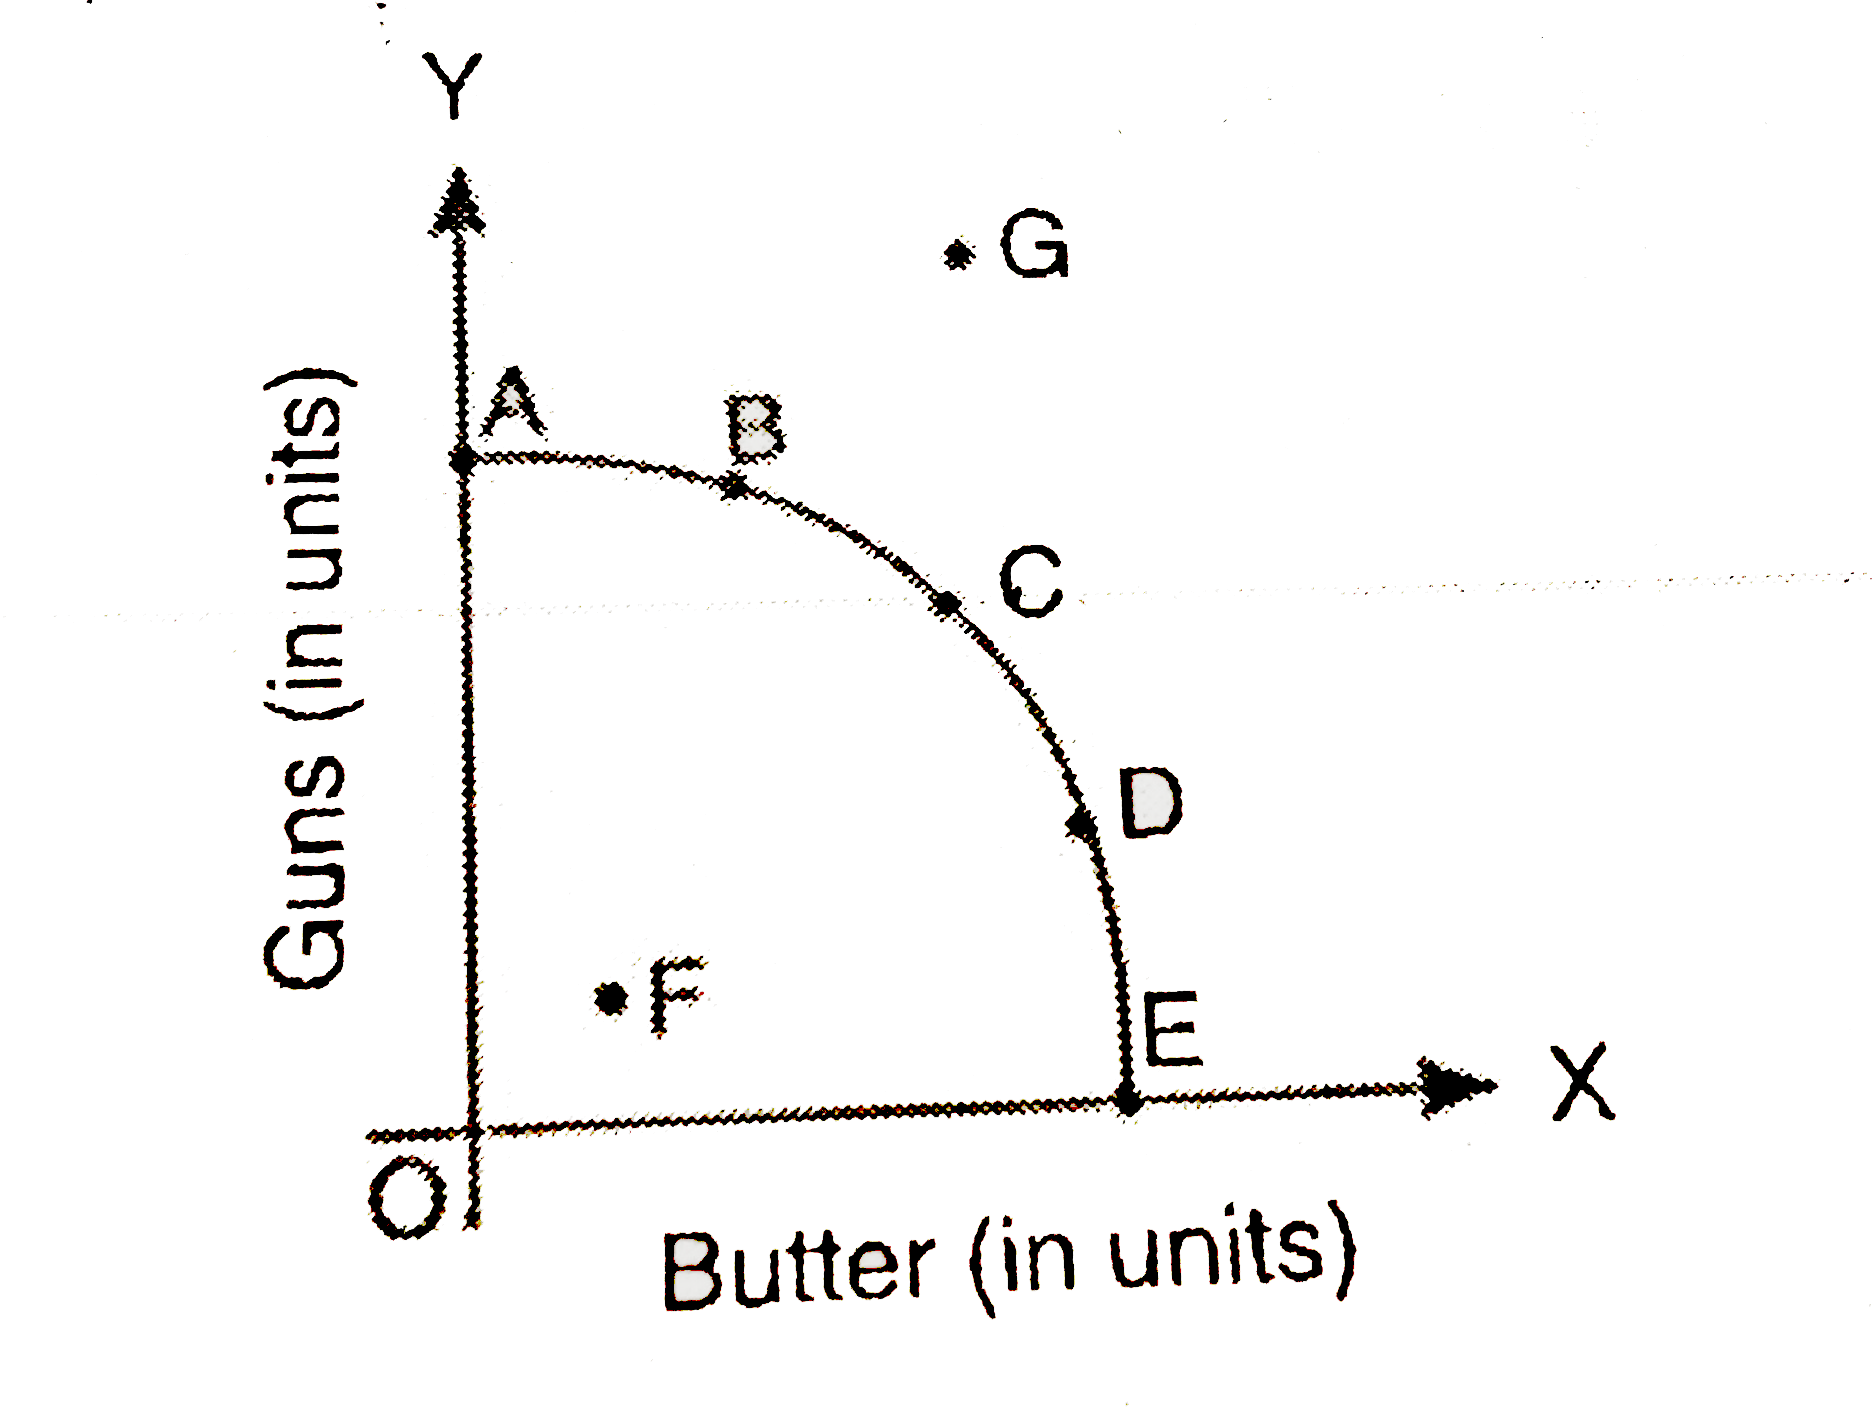
Answer the following questions with the help of following diagram:

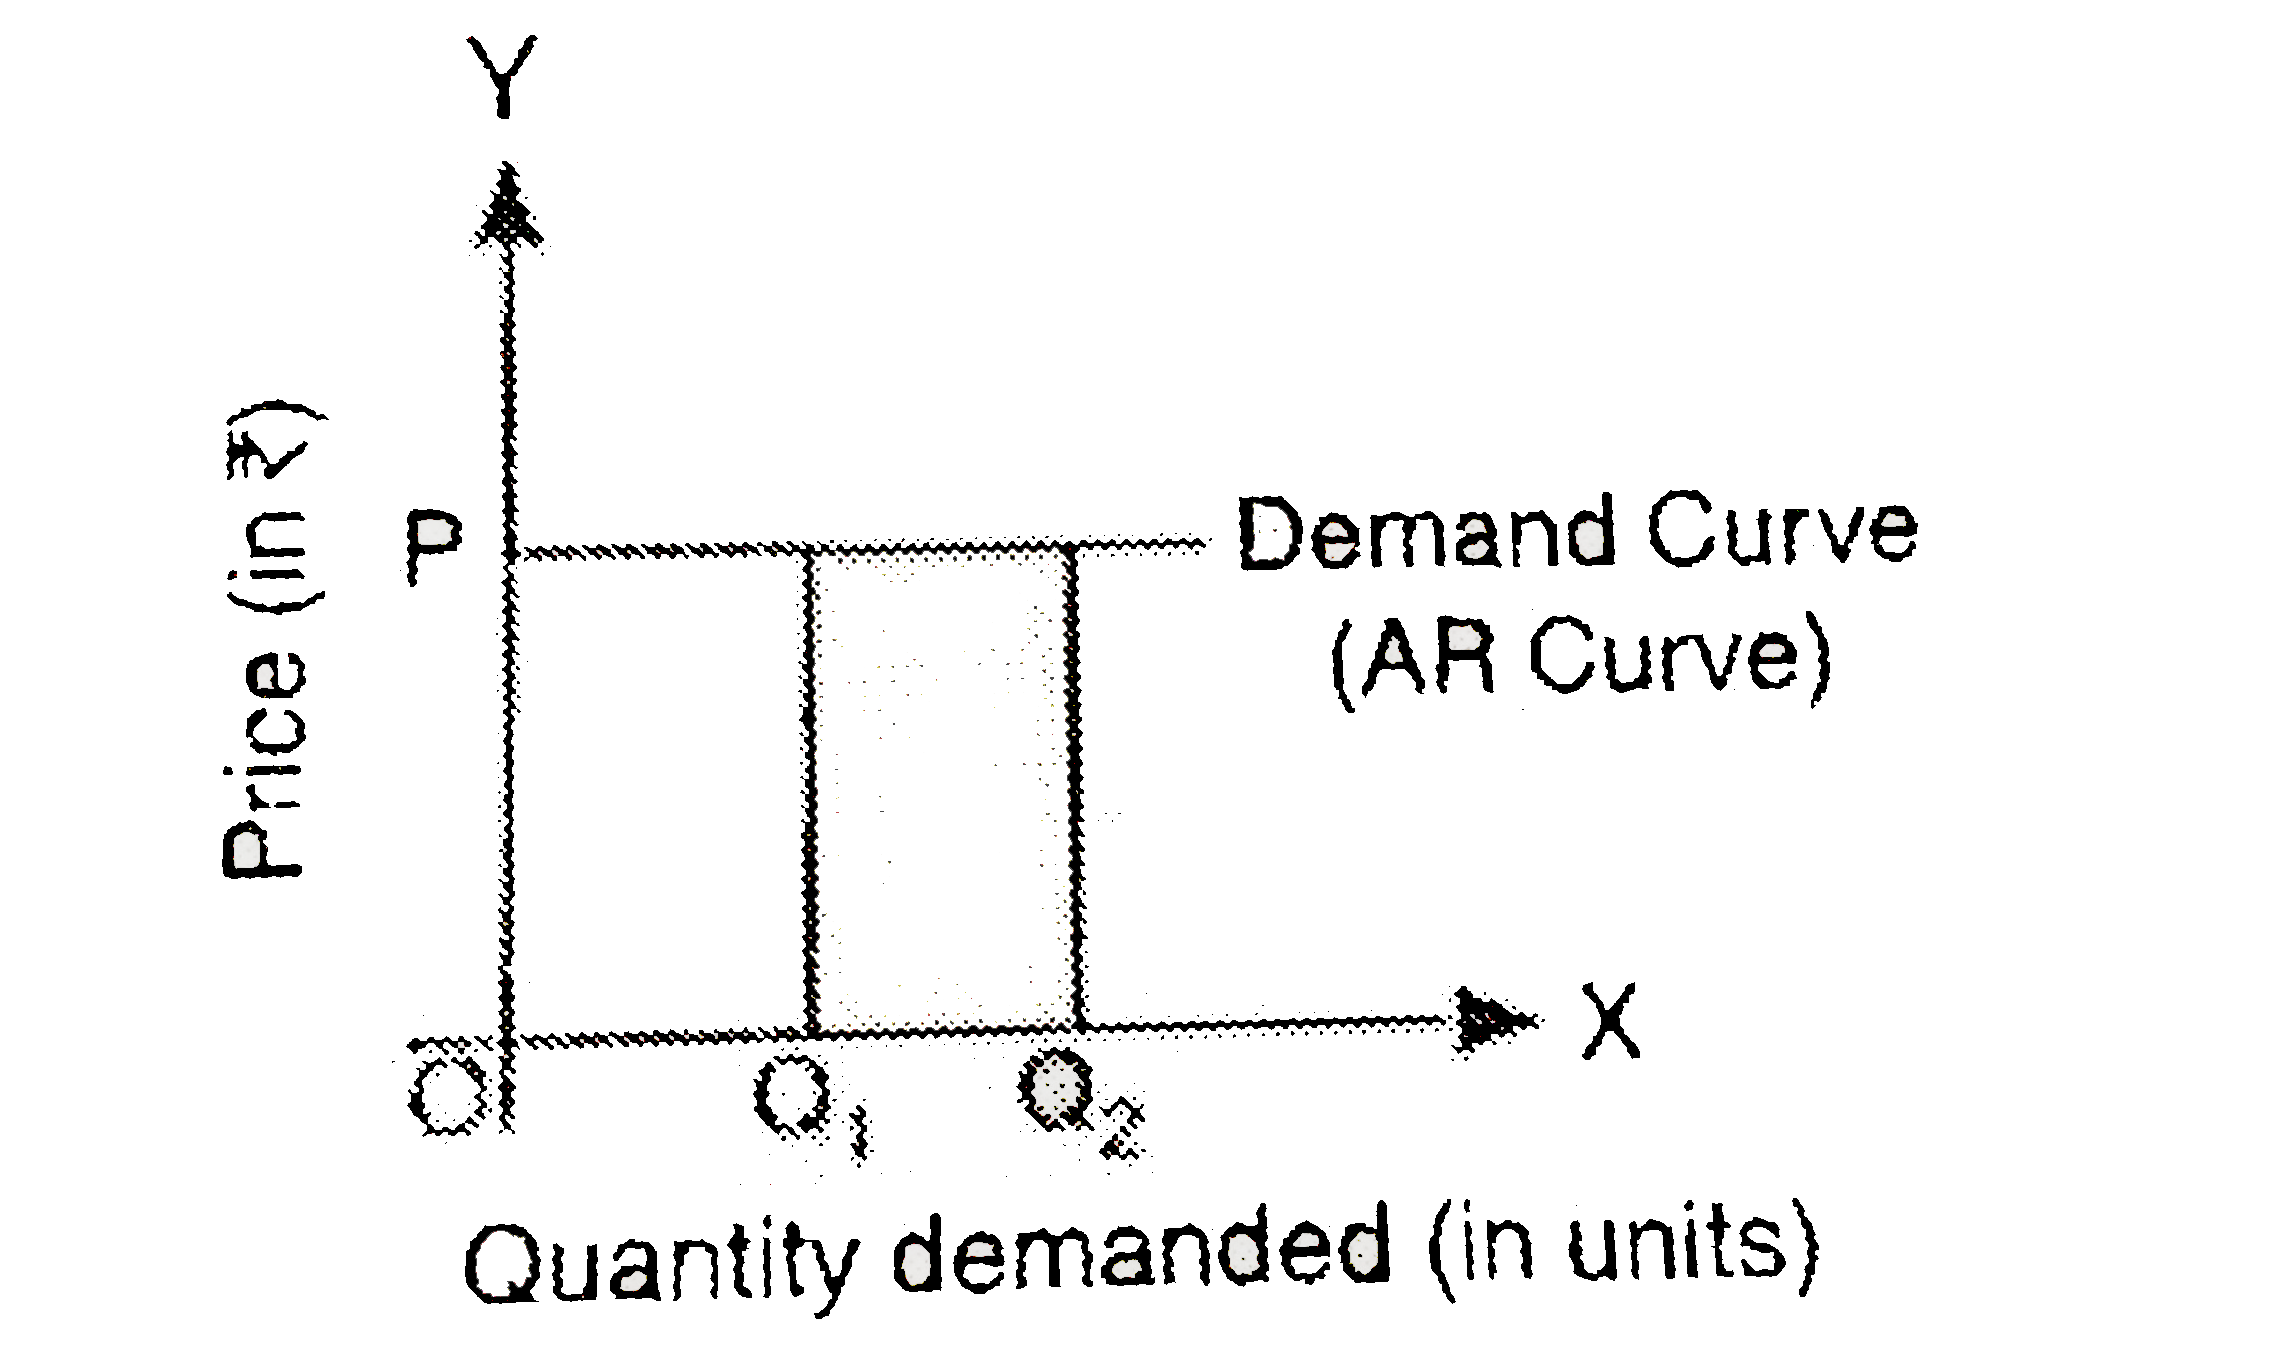
Which of the following point represent underutilisation of resources?AGBECADFThe following diagram represents the demand curve of:
 APerfect competitionBMonopolist CompetitionCMonopolyDOligopoly
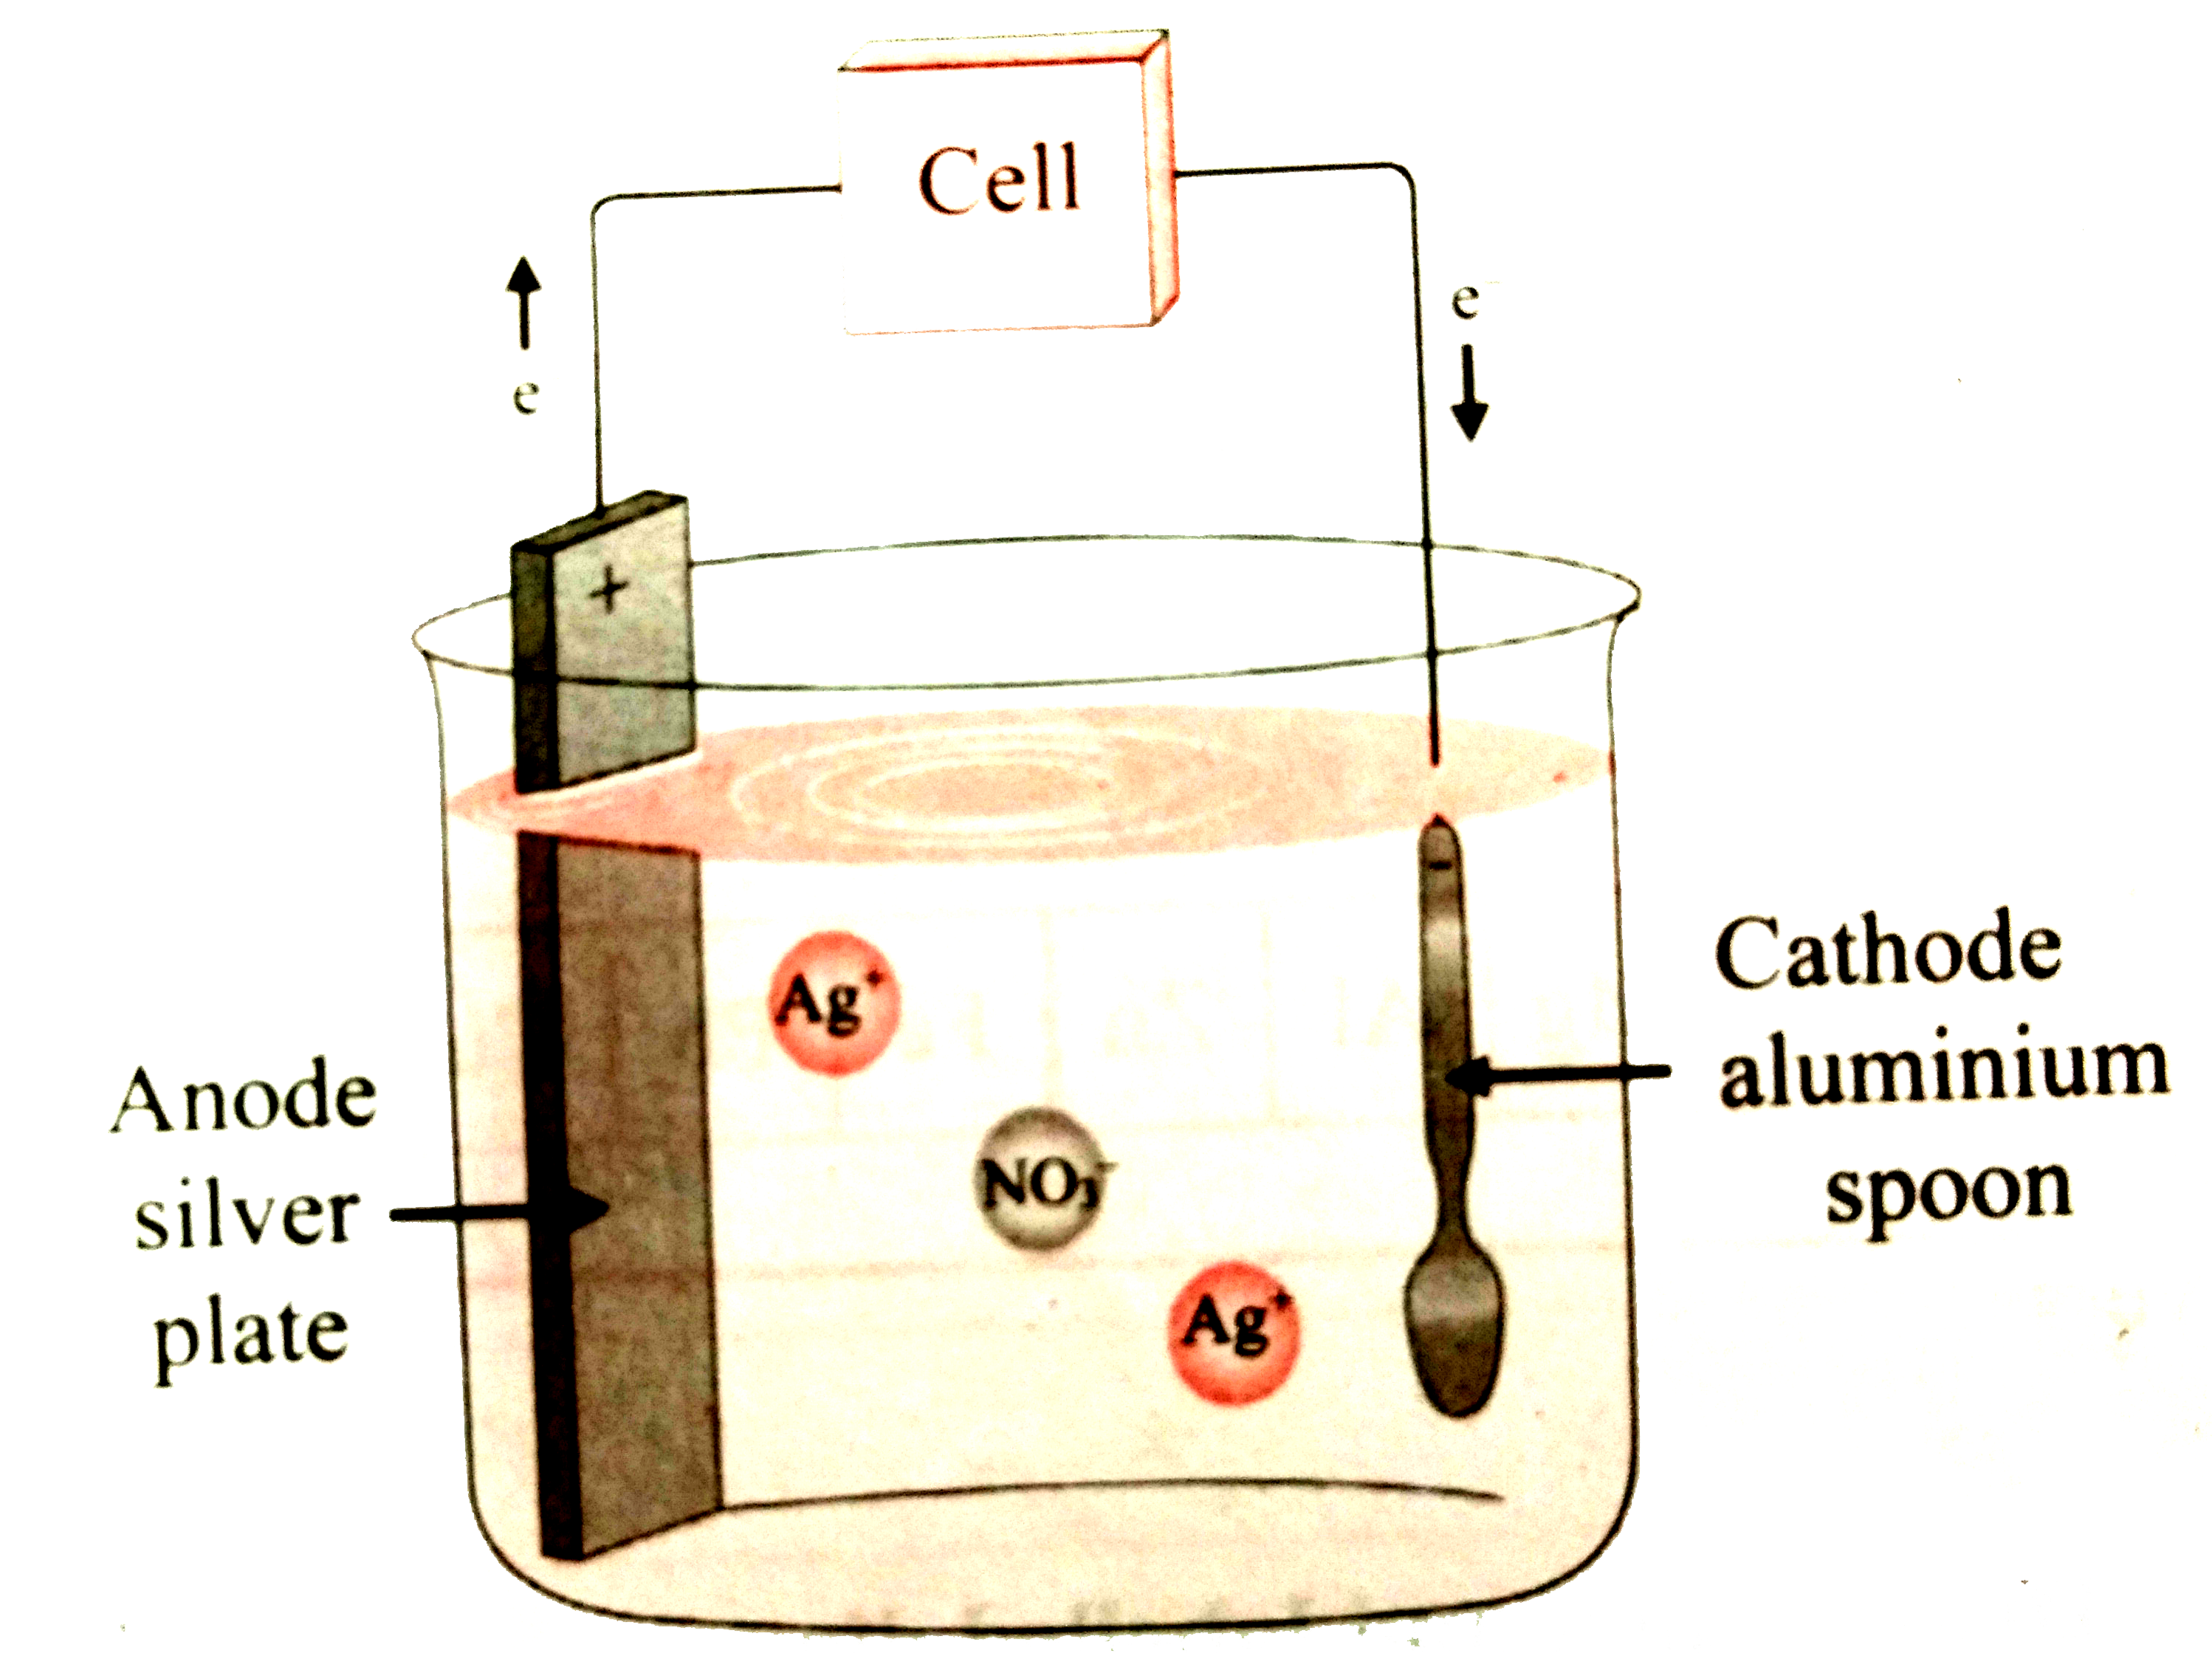
Study the diagram and answer the following questions

What does the diagram represent?
View SolutionProduction Possibility Curve shows the point at which the economy actually operates.
View SolutionDraw a production possibility curve. What does a point below this curve indicate ?
View SolutionDraw a production possibility curve and show the following situations on the diagram.
(a) Full employment of resources, (b) Under utilisation of resources and (c) Economic growth.
View SolutionOn the basis of given diagram, answer the following questions :
(i) Indicate, whether price will fall or remain same with rise in output.
(ii) What does the shaded are OPRQ indicate ?
(iii) What will be the nature of MR curve ?
View SolutionIf the economy is operating inside the production possibility frontier, it indicates that the economy is saving resources for growth and expansion in future.
View Solution
