The following graph represents variation of boiling point with composition of liquid and vapours of binary liquid mixture. The graph is plotted at constant pressure.
Then find mole fractions of benzene and toluene given points.
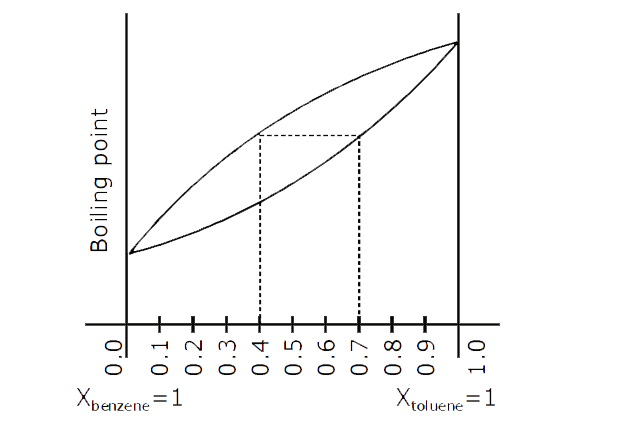
Xbenzene=0.5 and Ytoluene=0.2
Xtoluene=0.3 and Ybenzene=0.6
Xbenzene=0.3 and Ytoluene=0.4
If Xbenzene=0.7 than Ytoluene<0.3
The correct Answer is:A, B, C, D
Topper's Solved these Questions
- LIQUID SOLUTIONBOOK - MOTIONCHAPTER - LIQUID SOLUTIONEXERCISE - EXERCISE-4 (Level-I) PREVIOUS YEAR JEE MAIN
30 Videos
- LIQUID SOLUTIONBOOK - MOTIONCHAPTER - LIQUID SOLUTIONEXERCISE - EXERCISE-4 (Level-II) PREVIOUS YEAR JEE ADVANCED
19 Videos
- LIQUID SOLUTIONBOOK - MOTIONCHAPTER - LIQUID SOLUTIONEXERCISE - EXERCISE-2 (LEVEL -II) MULTIPLE CORRECT JEE ADVANCED
30 Videos
- ISOMERISMBOOK - MOTIONCHAPTER - ISOMERISMEXERCISE - Exercise 4
26 Videos
- METALLURGYBOOK - MOTIONCHAPTER - METALLURGYEXERCISE - EXERCISE 4 (LEVEL - II)
17 Videos
Similar Questions
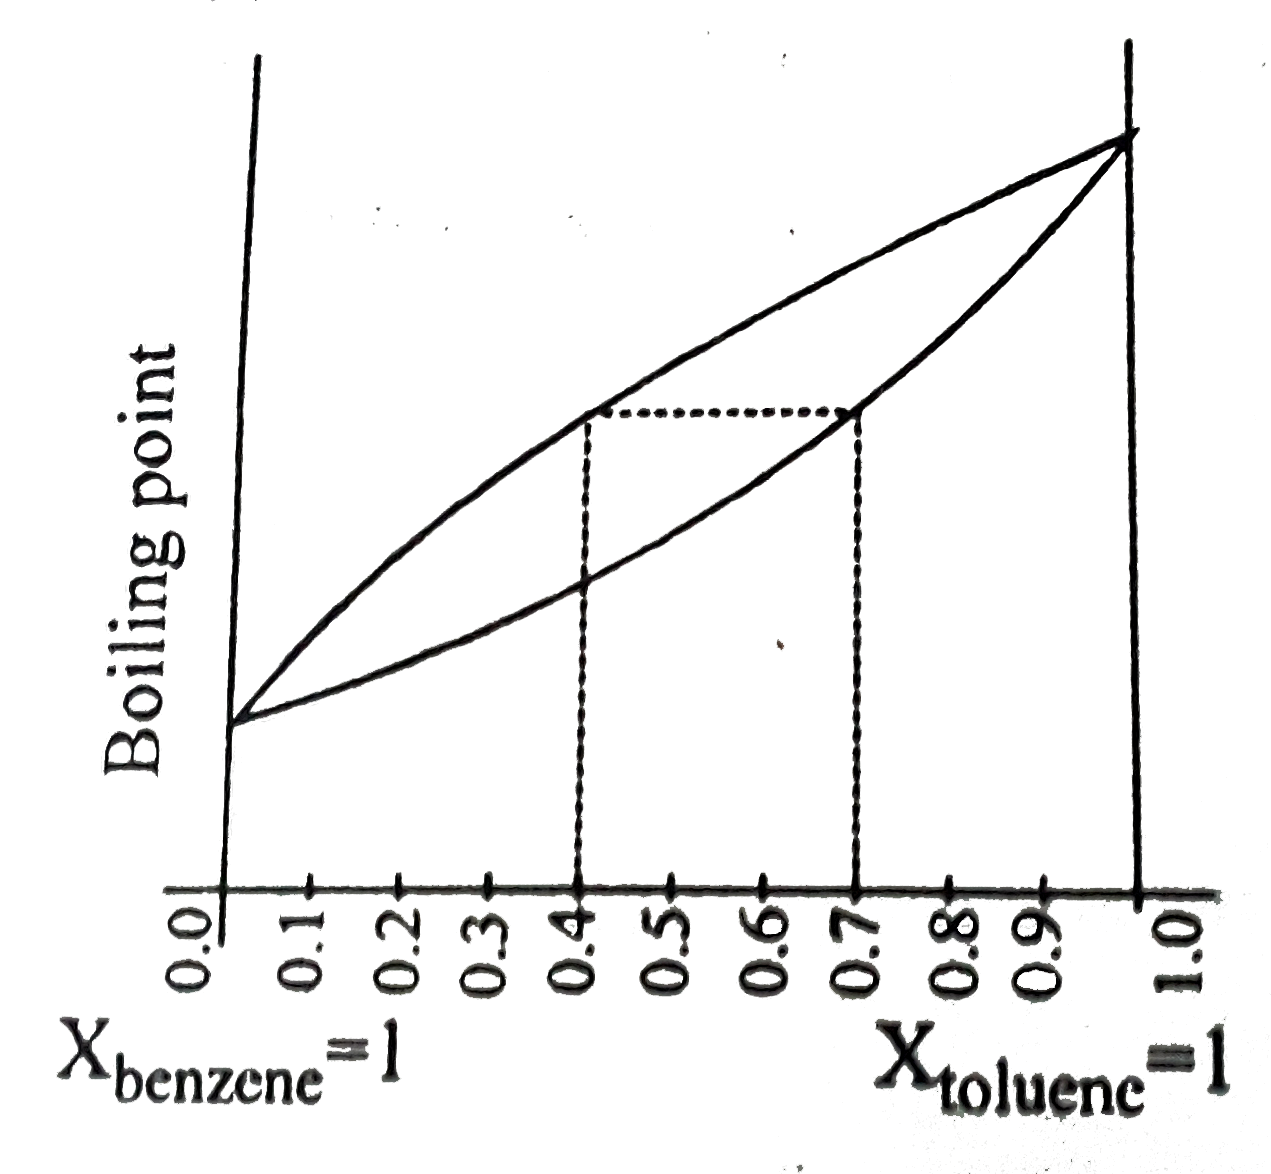
The following graph represents variation of boiling point with composition of liquid and vapours of binary liquid mixture. The graph is plotted at constant pressure.
Which of the following statement(s) is incorrect. Here X & Y stands for mole fraction in liquid and vapour phase respectively.
View SolutionWhich of the following binary mixture will have same composition in liquid and vapour phase?
View Solution
Knowledge Check
The following graph represents variation of boiling point with composition of liquid and vapours of binary liquid mixture. The graph is plotted at constant pressure.
Which of the following statement(s) is incorrect. Here X & Y stands for mole fraction in liquid and vapour phase respectively.
 AXbenzene=0.5 and Ytoluene=0.2BXtoluene=0.3 and Ybenzene=0.6CXbenzene=0.3 and Ytoluene=0.4D if Xbenzene=0.7 than Ytoluene<0.3
The following graph represents variation of vapour pressre with composition of liquid and vapours of binary liquid mixture. The graph is plotted at constant temperature.
Which of the following statements(s) is correct. Here X & Y stands for mole fraction in liquid and vapour phase respectively
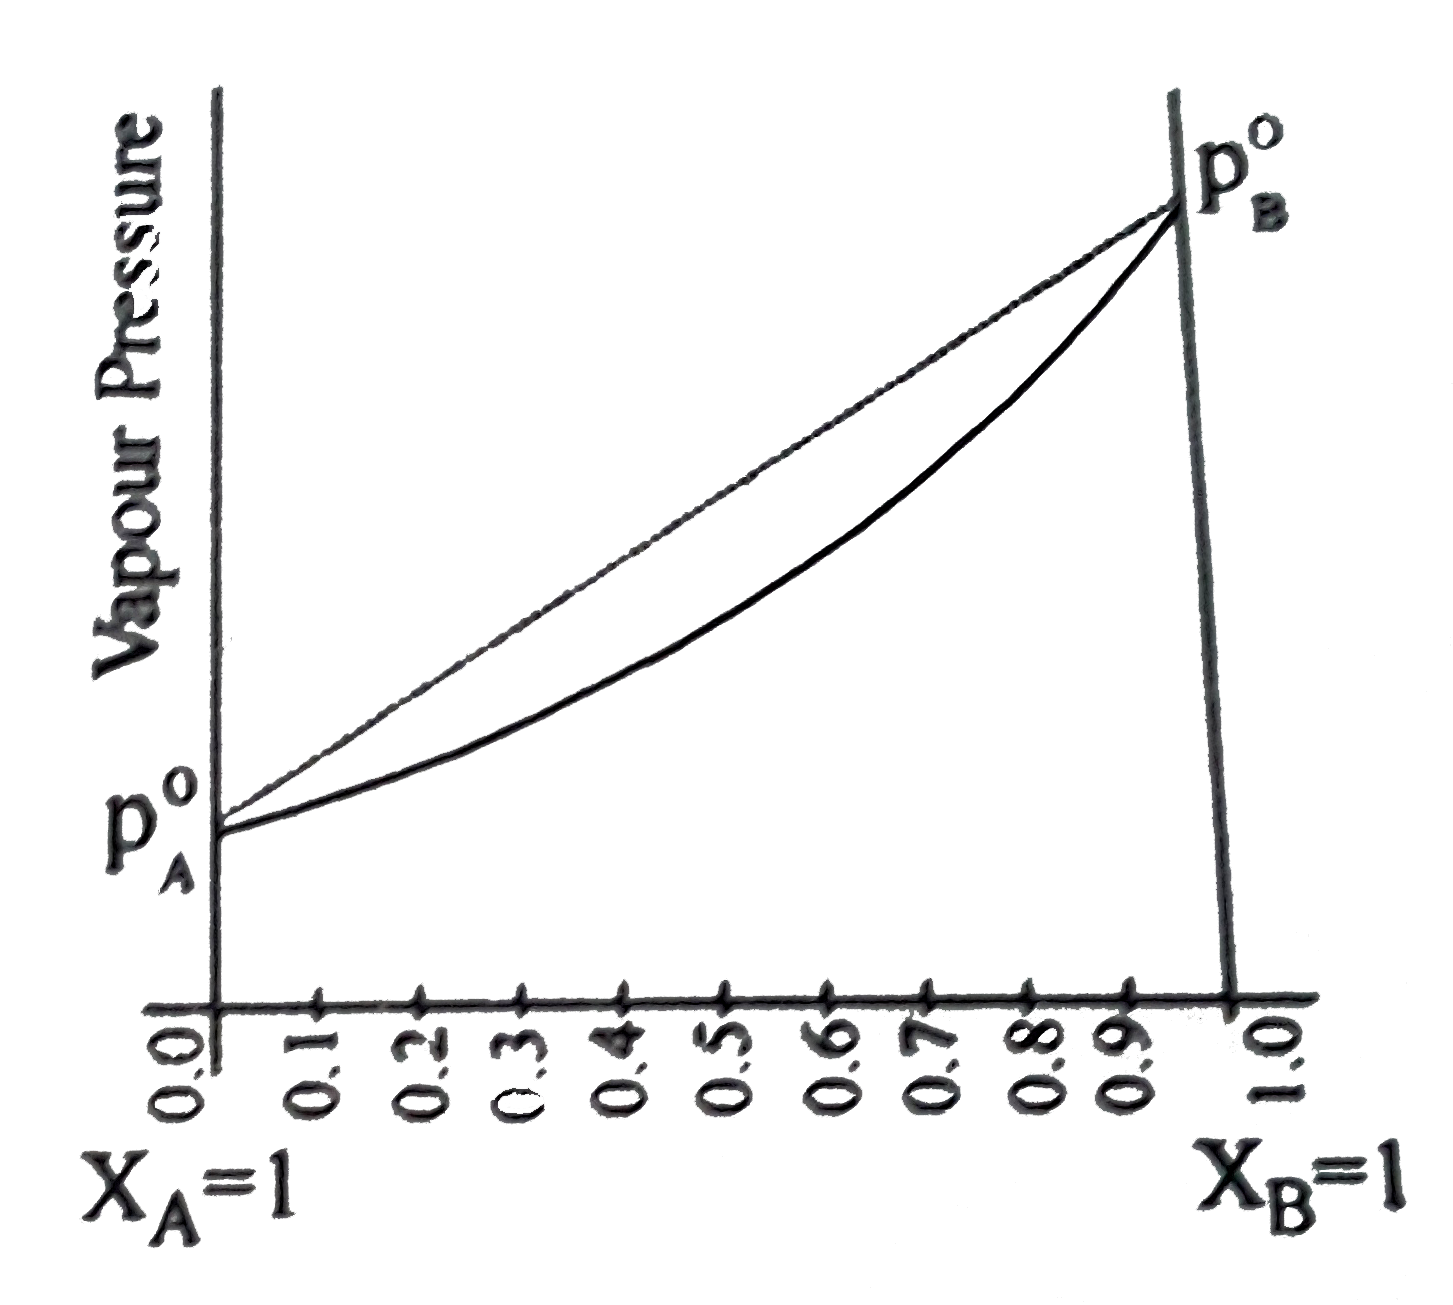 AXB>YBBXA<YACXBYAXAYB>1DXA>YA
Which of the following will be correct graph for variation of boiling point with composition ?
A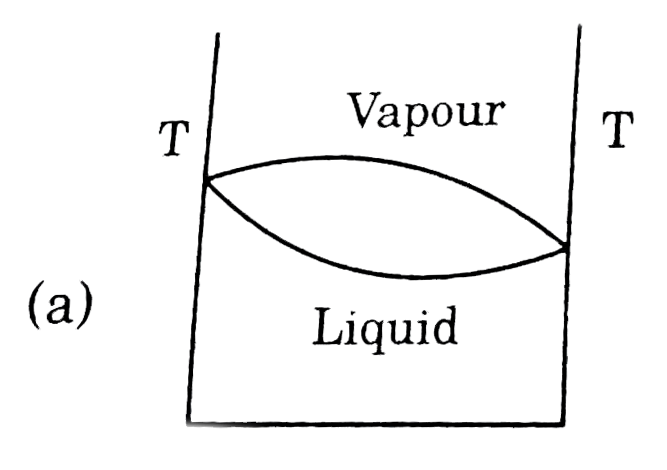 B
B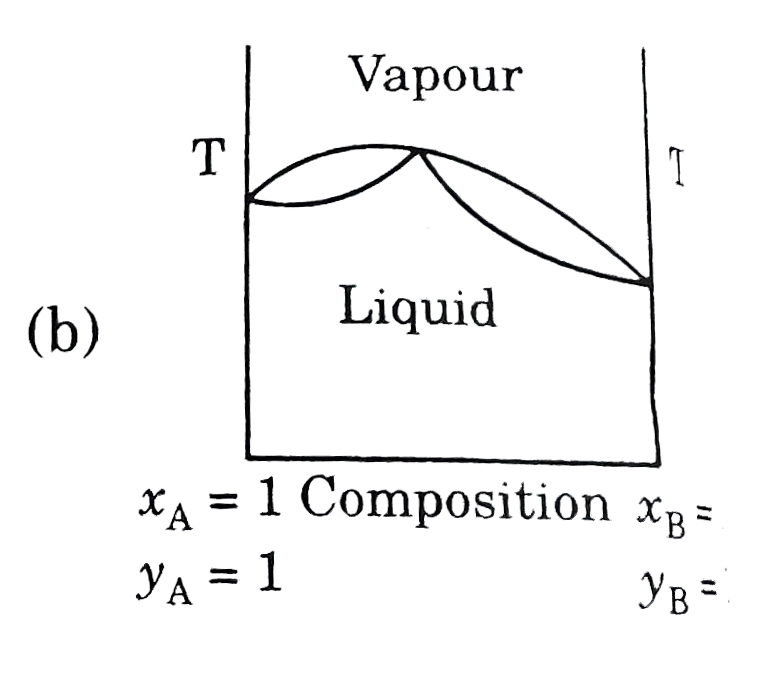 C
C D
D
Compreshension-II
In non-ideal solutions, at one of the intermediate compostions, the total vapour pressure is highest and the boiling point is lowest. At this point, the composition of the liquid and vapour phase is same. So, if liquid mixture vapouriese at this point and vapours are condensed, teh condensate contains same compositon as present in original liquid mixture. it means at this point liquid behaves like a pure liquid and is called an Azeotropic mixture.
Which of the following cannot form low boiling point azeotrope ?
View SolutionWhich of the following binary mixture will have same composition in liquid and vapour phase?
View SolutionCompreshension-II
In non-ideal solutions, at one of the intermediate compostions, the total vapour pressure is highest and the boiling point is lowest. At this point, the composition of the liquid and vapour phase is same. So, if liquid mixture vapouriese at this point and vapours are condensed, teh condensate contains same compositon as present in original liquid mixture. it means at this point liquid behaves like a pure liquid and is called an Azeotropic mixture.
Which of the following cannot form low boiling point azeotrope ?
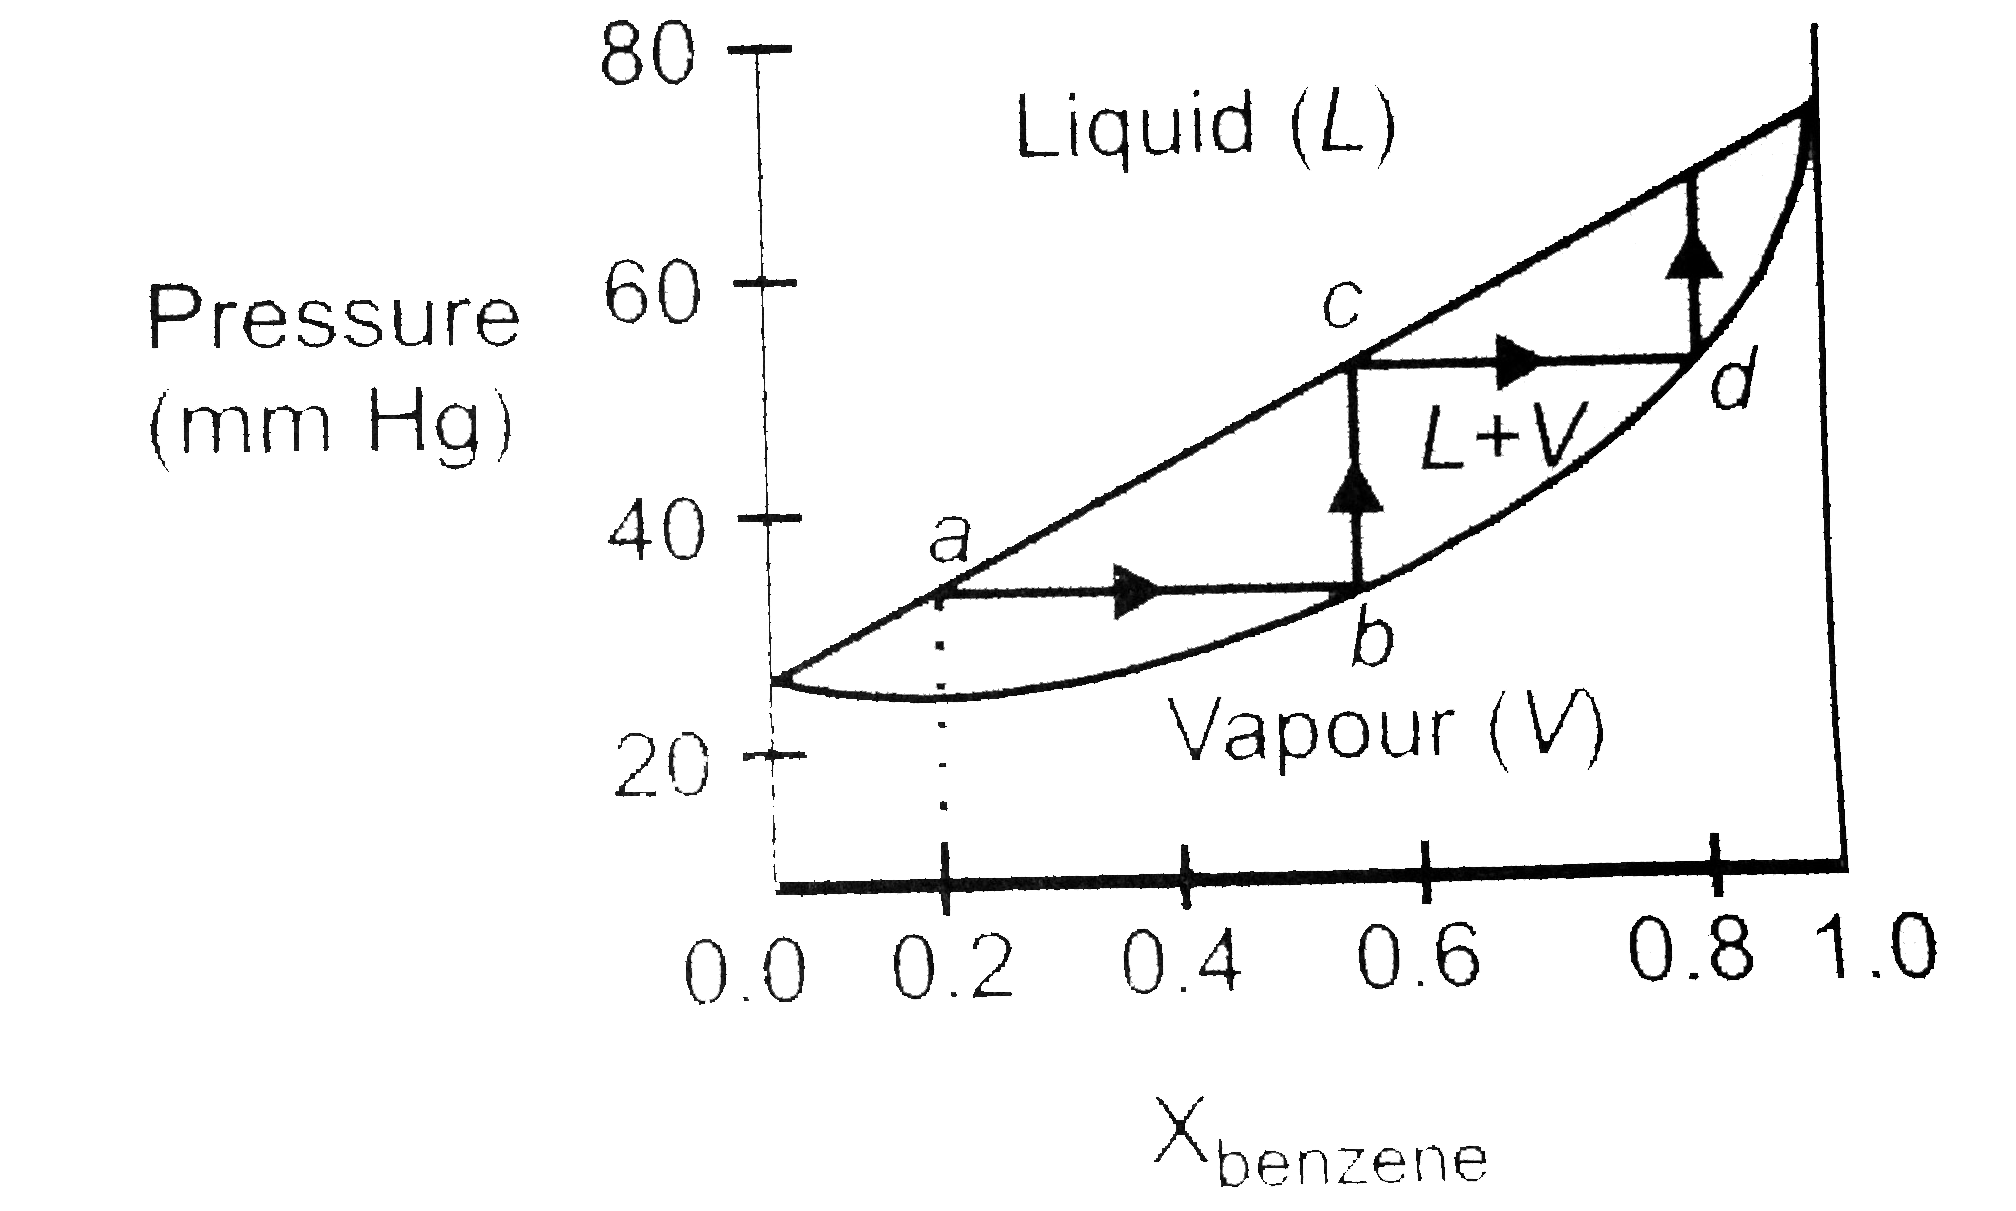
View SolutionA graph is plotted between the vapour pressure and mole fraction of a solutionn containing benzene and toluene. Select the correct statements.
View SolutionCompreshension-II
In non-ideal solutions, at one of the intermediate compostions, the total vapour pressure is highest and the boiling point is lowest. At this point, the composition of the liquid and vapour phase is same. So, if liquid mixture vapouriese at this point and vapours are condensed, teh condensate contains same compositon as present in original liquid mixture. it means at this point liquid behaves like a pure liquid and is called an Azeotropic mixture.
Which of the following cannot form low boiling point azeotrope ?
View Solution
