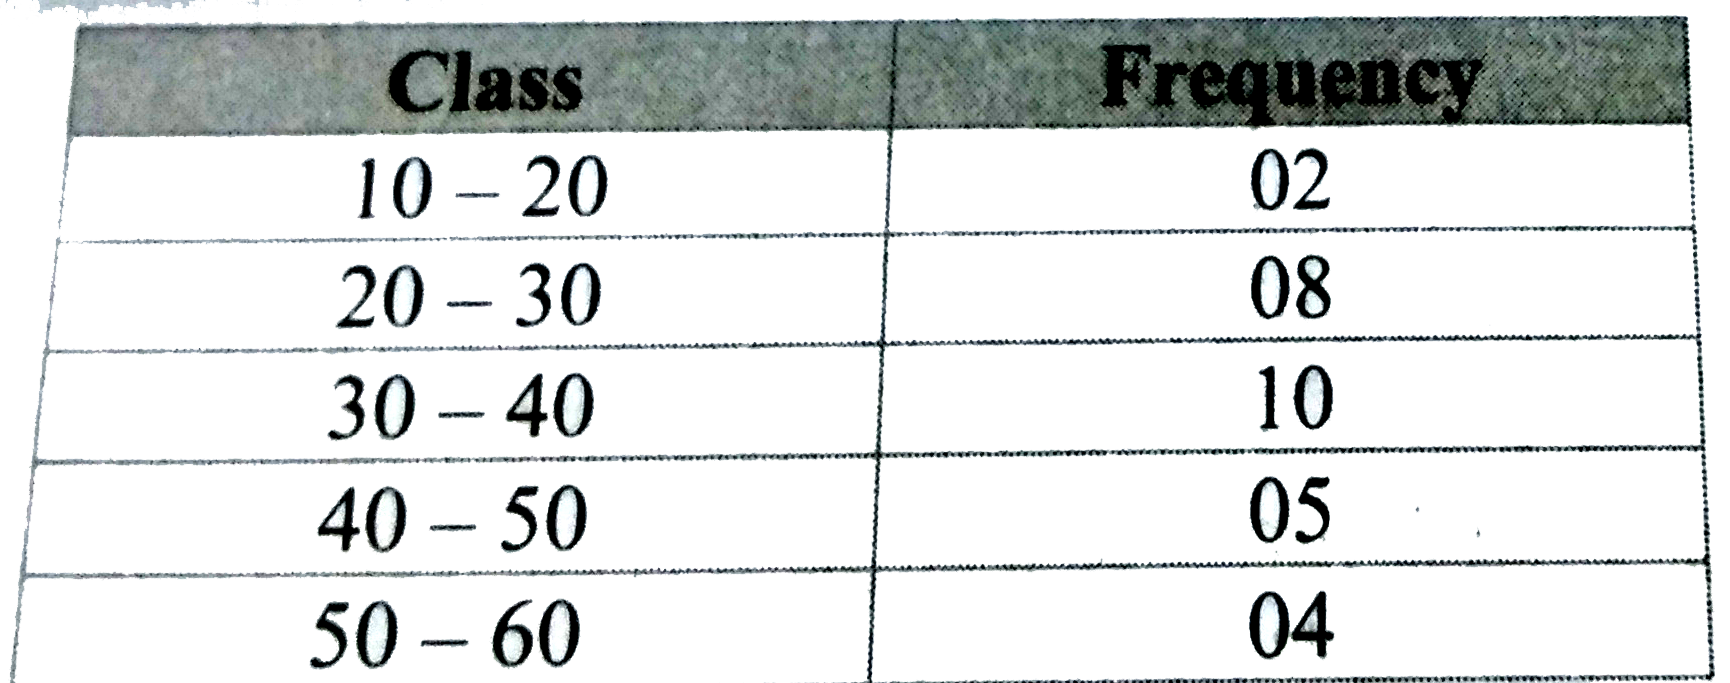
Draw a cumulative frequency curve and cumulative frequency polygon for
the following frequency distribution by less than method.

The given frequency distribution is not continuous. So, we first make it continuous and prepare the cumulative frequency distribution as under.
(##XRD07_E0137_s01##)
Now, we plot points (9.5,5),(19.5),(29.5,40),(39.5,63),(49.5,80),(59.5,91)and(69.5,100). and join them by a free hand smooth curve to obtain the required ogive as shown in Figure.
The cumulative frequency polygon is obtained by joining these points by line segments as shown in Figure.
(##XRD07_E0137_s02##)
Topper's Solved these Questions
Similar Questions
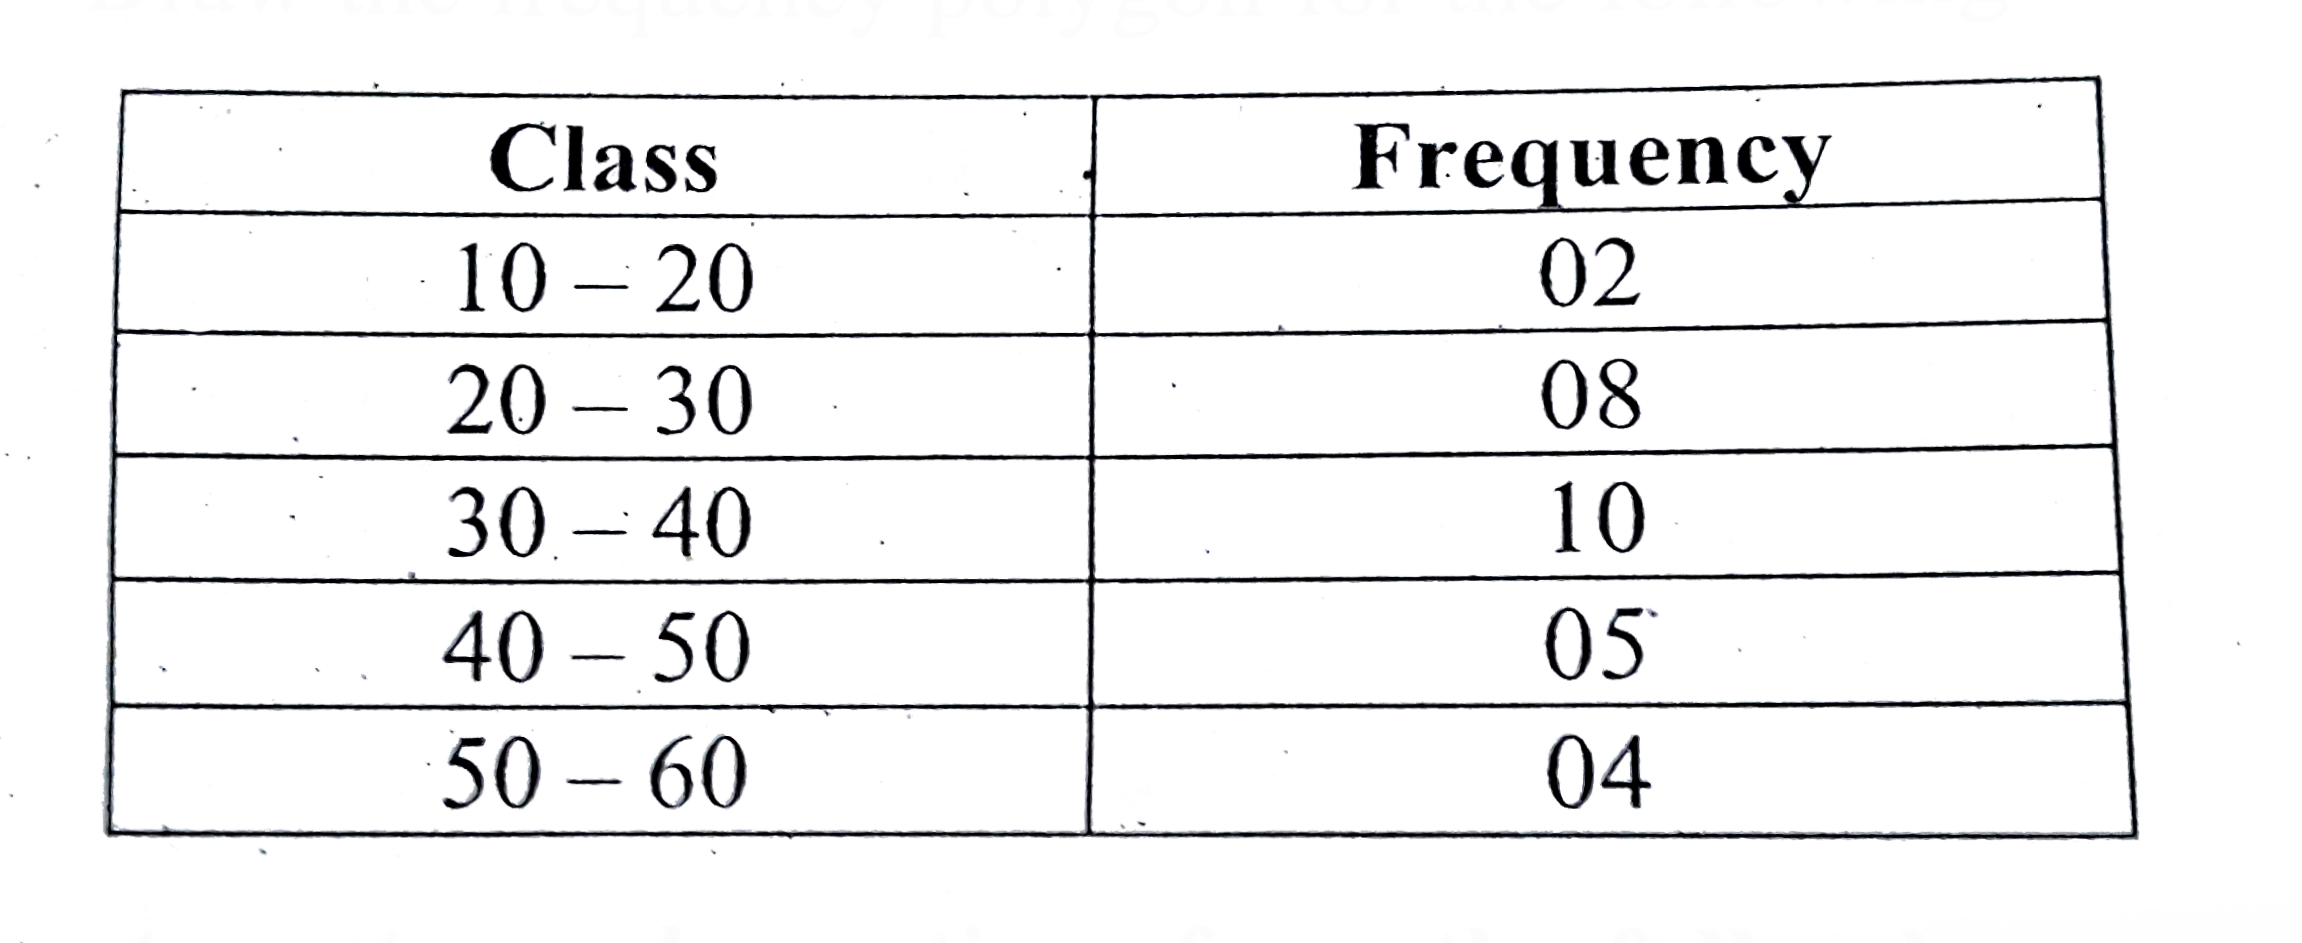
Draw frequency polygon for the following frequency distribution.
 View Solution
Draw the frequency polygon for the following frequency distribution:
 View Solution
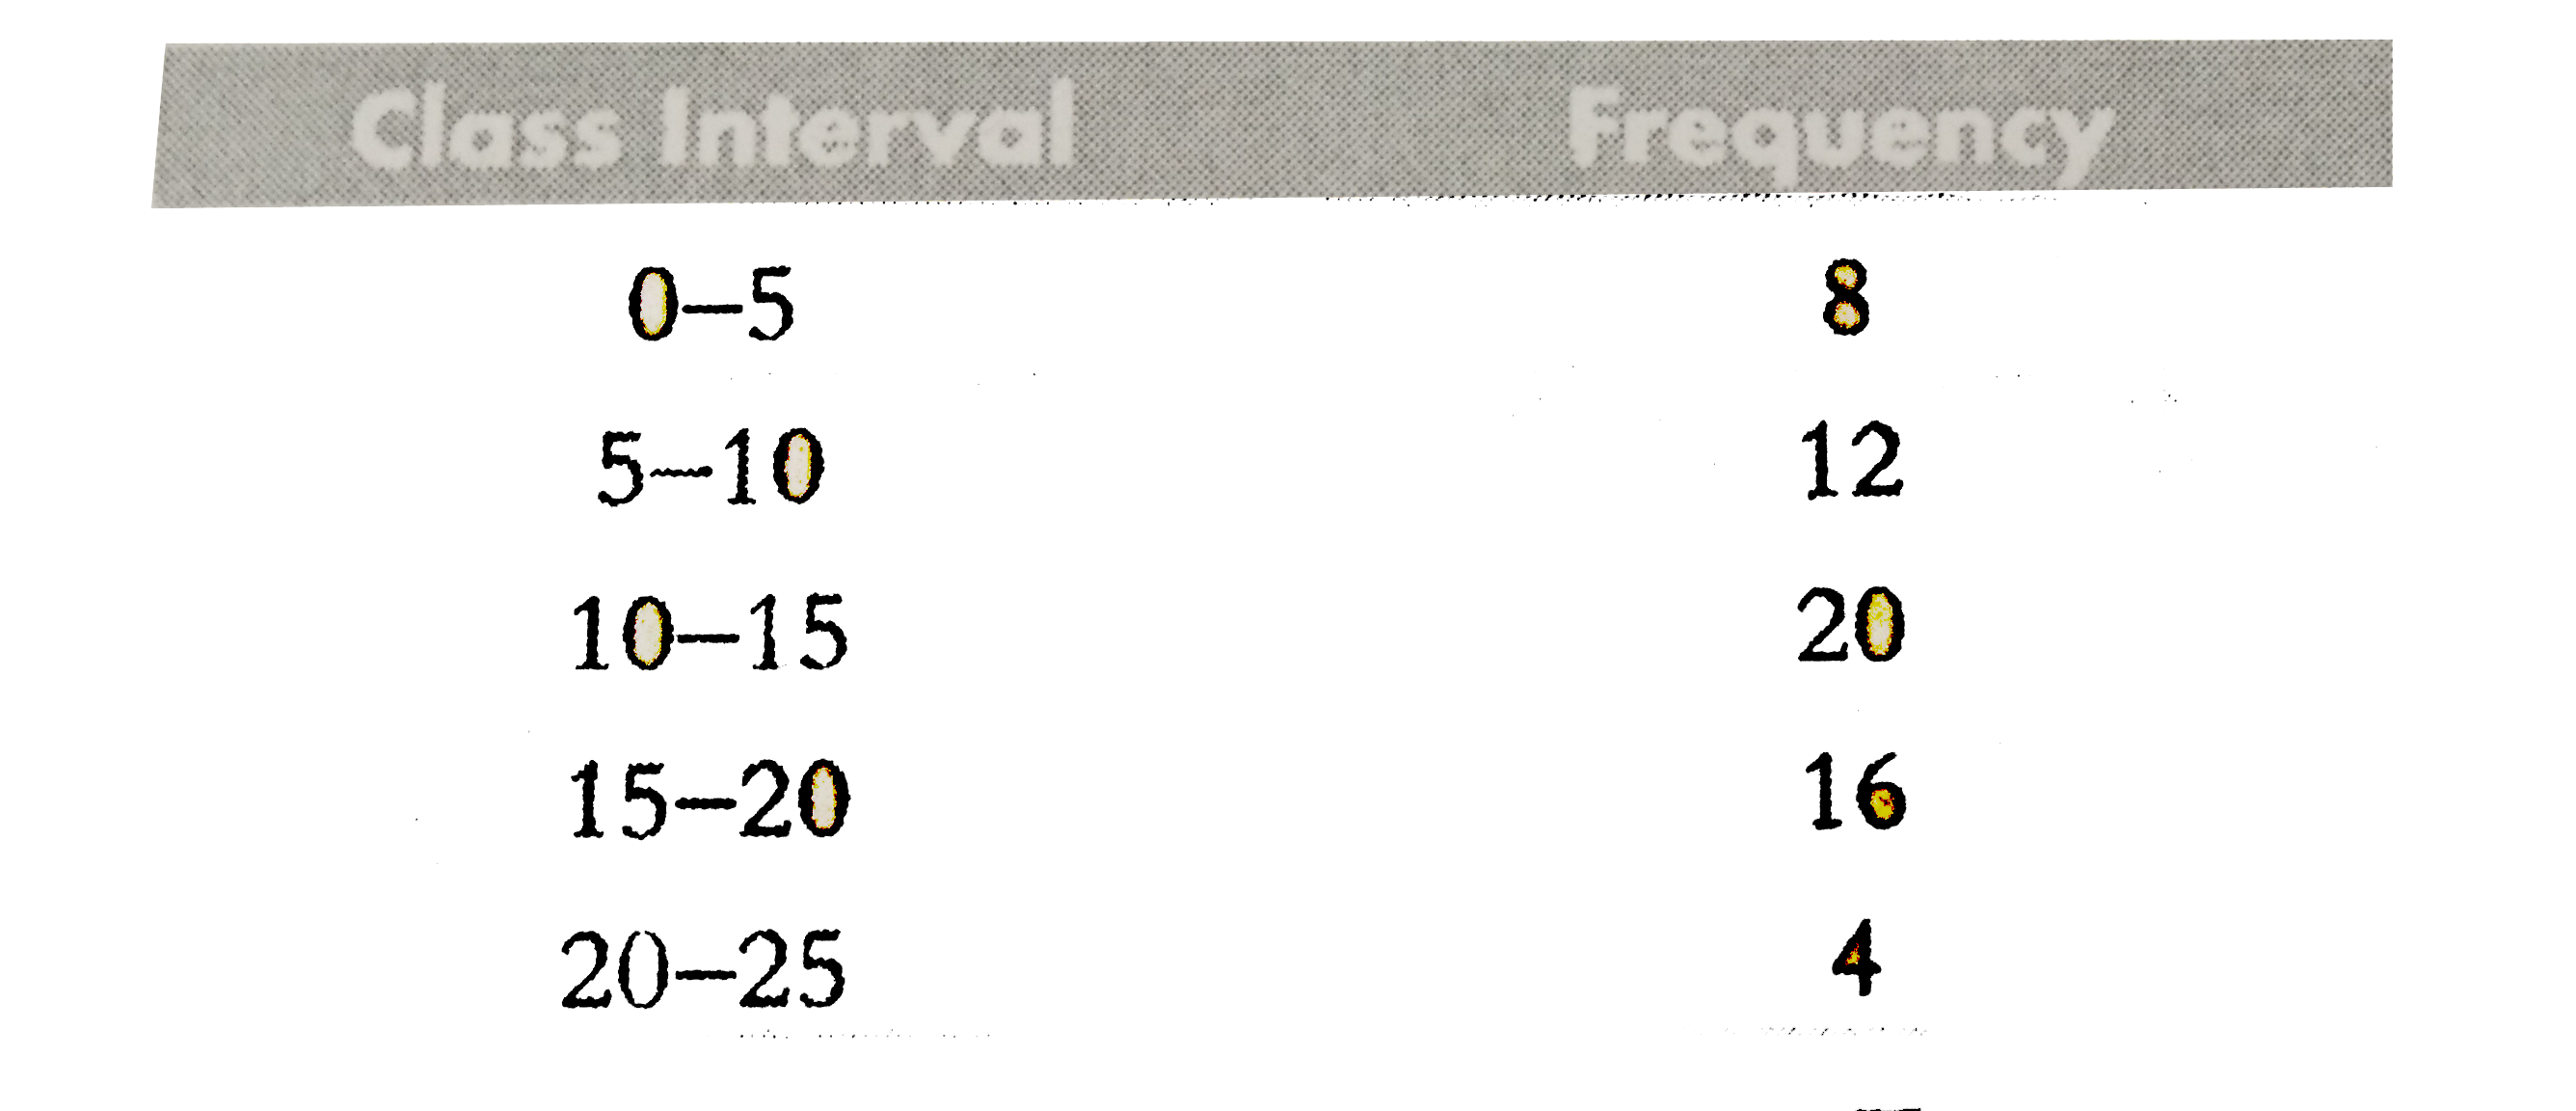
Draw a frequency polygon for the following frequency distribution:
 View Solution
Draw a frequency polygon for the following frequency distribution.
 View Solution
Draw an OGIVE and the cumulative frequency polygon for the following frequency distribution by less than method
View SolutionDraw a frequency polygon for the following grouped frequency distrbution table.
 View Solution
Draw the frequency polygon representing the following frequency distribution
 View Solution
Draw a frequency polygon for the following grouped frequency distribution table :
 View Solution
Draw the frequency polygon for the following distribution :
 View Solution
Draw the Histogram for the following frequency distribution.
 View Solution

