P-T graphs of an ideal gas are as shown in figures-2.42 below. Choose the wrong statement from the options given:
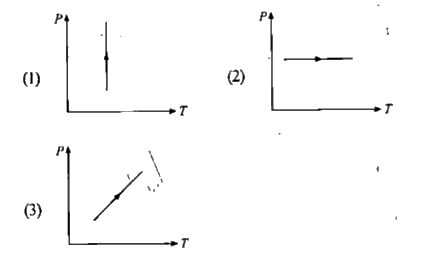
Density of gas is increasing in graph (1)
Density of gas decreasing in graph (2)
Density of gas is constant in graph (3)
None of the above
Step by step video & image solution for P-T graphs of an ideal gas are as shown in figures-2.42 below. Choose the wrong statement from the options given: by Physics experts to help you in doubts & scoring excellent marks in Class 12 exams.
Topper's Solved these Questions
- BOOK - PHYSICS GALAXY - ASHISH ARORACHAPTER - Kinetic Theory of Gases and Gas LawsEXERCISE - Numerical MCQs Single Options Correct28videos
Kinetic Theory of Gases and Gas Laws
- BOOK - PHYSICS GALAXY - ASHISH ARORACHAPTER - Kinetic Theory of Gases and Gas LawsEXERCISE - Advance MCQs with One or More Options Correct15videos
Kinetic Theory of Gases and Gas Laws
- BOOK - PHYSICS GALAXY - ASHISH ARORACHAPTER - Kinetic Theory of Gases and Gas LawsEXERCISE - Discussion Question18videos
Kinetic Theory of Gases and Gas Laws
- BOOK - PHYSICS GALAXY - ASHISH ARORACHAPTER - HEAT TRANSFER EXERCISE - Unsolved Numerical Problems for Preparation of NSEP,INPhO&IPhO66videos
HEAT TRANSFER
- BOOK - PHYSICS GALAXY - ASHISH ARORACHAPTER - MAGNETIC EFFECTS OF CURRENT AND MAGNETISMEXERCISE - U.N.P79videos
MAGNETIC EFFECTS OF CURRENT AND MAGNETISM
Similar Questions
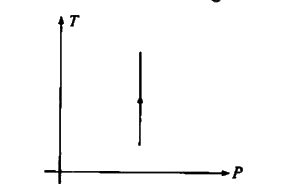
Pressure versus temperature graph of an ideal gas are as shown in figure-2.39. Choose the wrong statement
 View Solution
The process on an ideal gas, shown in figure,is <br><imga≤ocr_imageload∈g=lazysrc=https://d10lpgp6xz60nq.cloudfront.net/physics_imagesHCV_VOL2_C24_E01_027_Q01.pngwh=80%mx-autosty≤=background:white;>
View Solution
Knowledge Check
- Question 1 - Select One
Circuit as shown in figure below, choose the correct statement
 A(A) current in resistance R and current in inductor L.a.c. source will be in 90^(@ phase differenceBotential drop across R and potential drop across L will be in same phaseCcurrent through C and current through L will be in 90∘ phase differenceDcurrent in R and current in L will be in same phase
 - Question 2 - Select One
Pressure versus temperature graphs of an ideal gas are as shown in figure. Choose the wrong statement
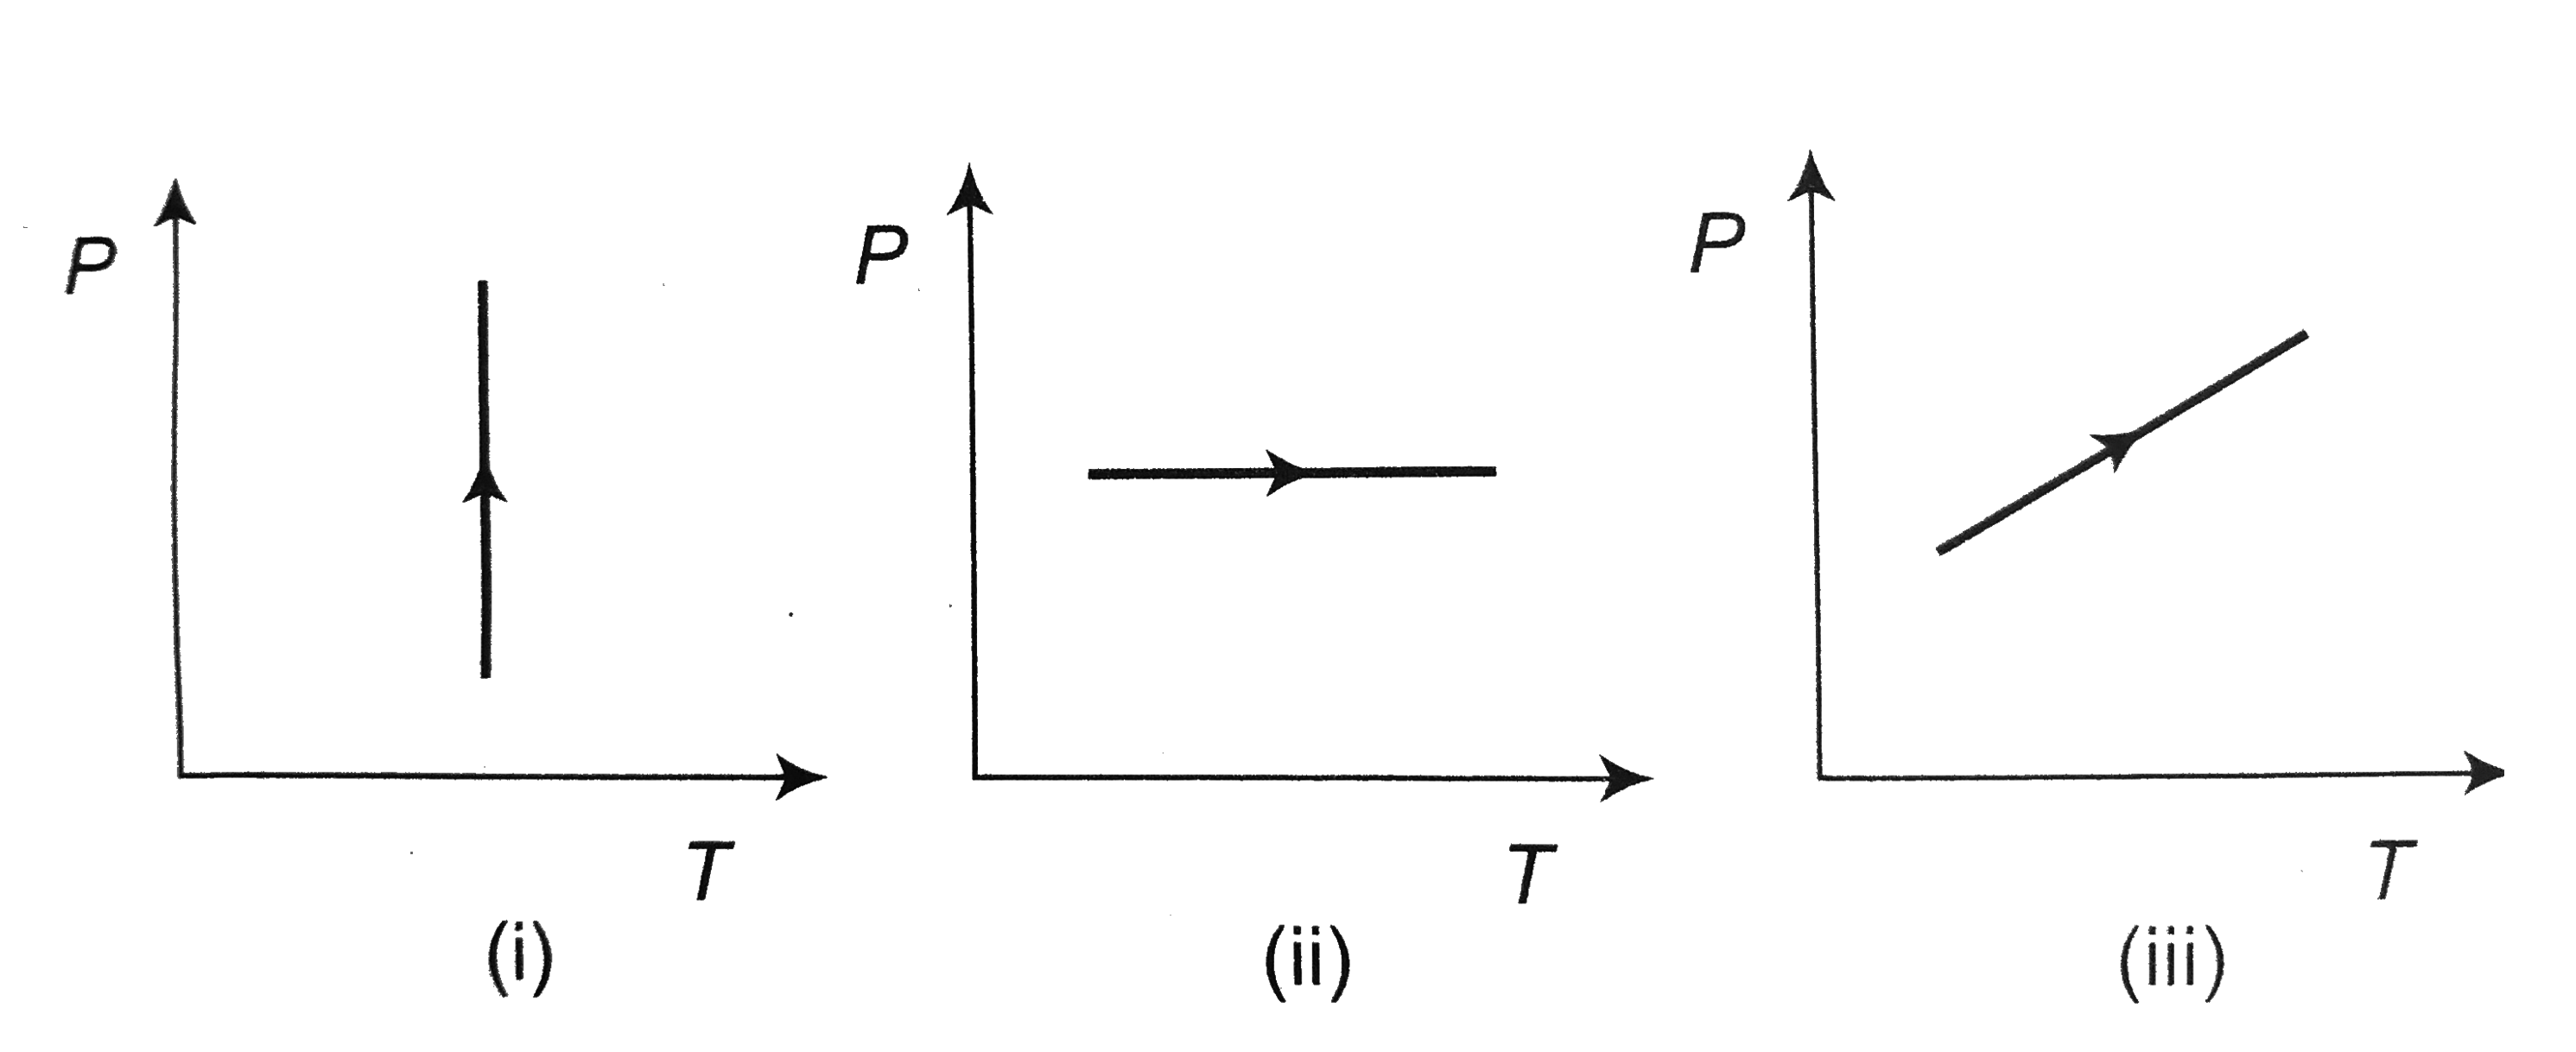 ADensity of gas is increased in graph (i)BDensity of gas is decrease in graph (ii)CDensity of gas is constant in graph (iii)DNone of these
 - Question 3 - Select One
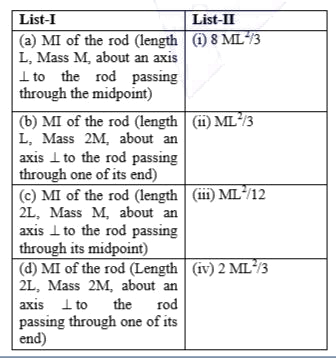
Choose the correct answer from the options given below :A(a)–(ii),(b)–(iii),(c)–(i),(d)–(iv)B(a)–(ii),(b)–(i),(c)–(iii),(d)–(iv)C(a)–(iii),(b)–(iv),(c)–(ii),(d)–(i)D(a)–(iii),(b)–(iv),(c)–(i),(d)–(ii)
Choose the incorrect option from the options given below
View SolutionChoose the masculine gender from the options given below:
View SolutionChoose the intensive property from the options given below
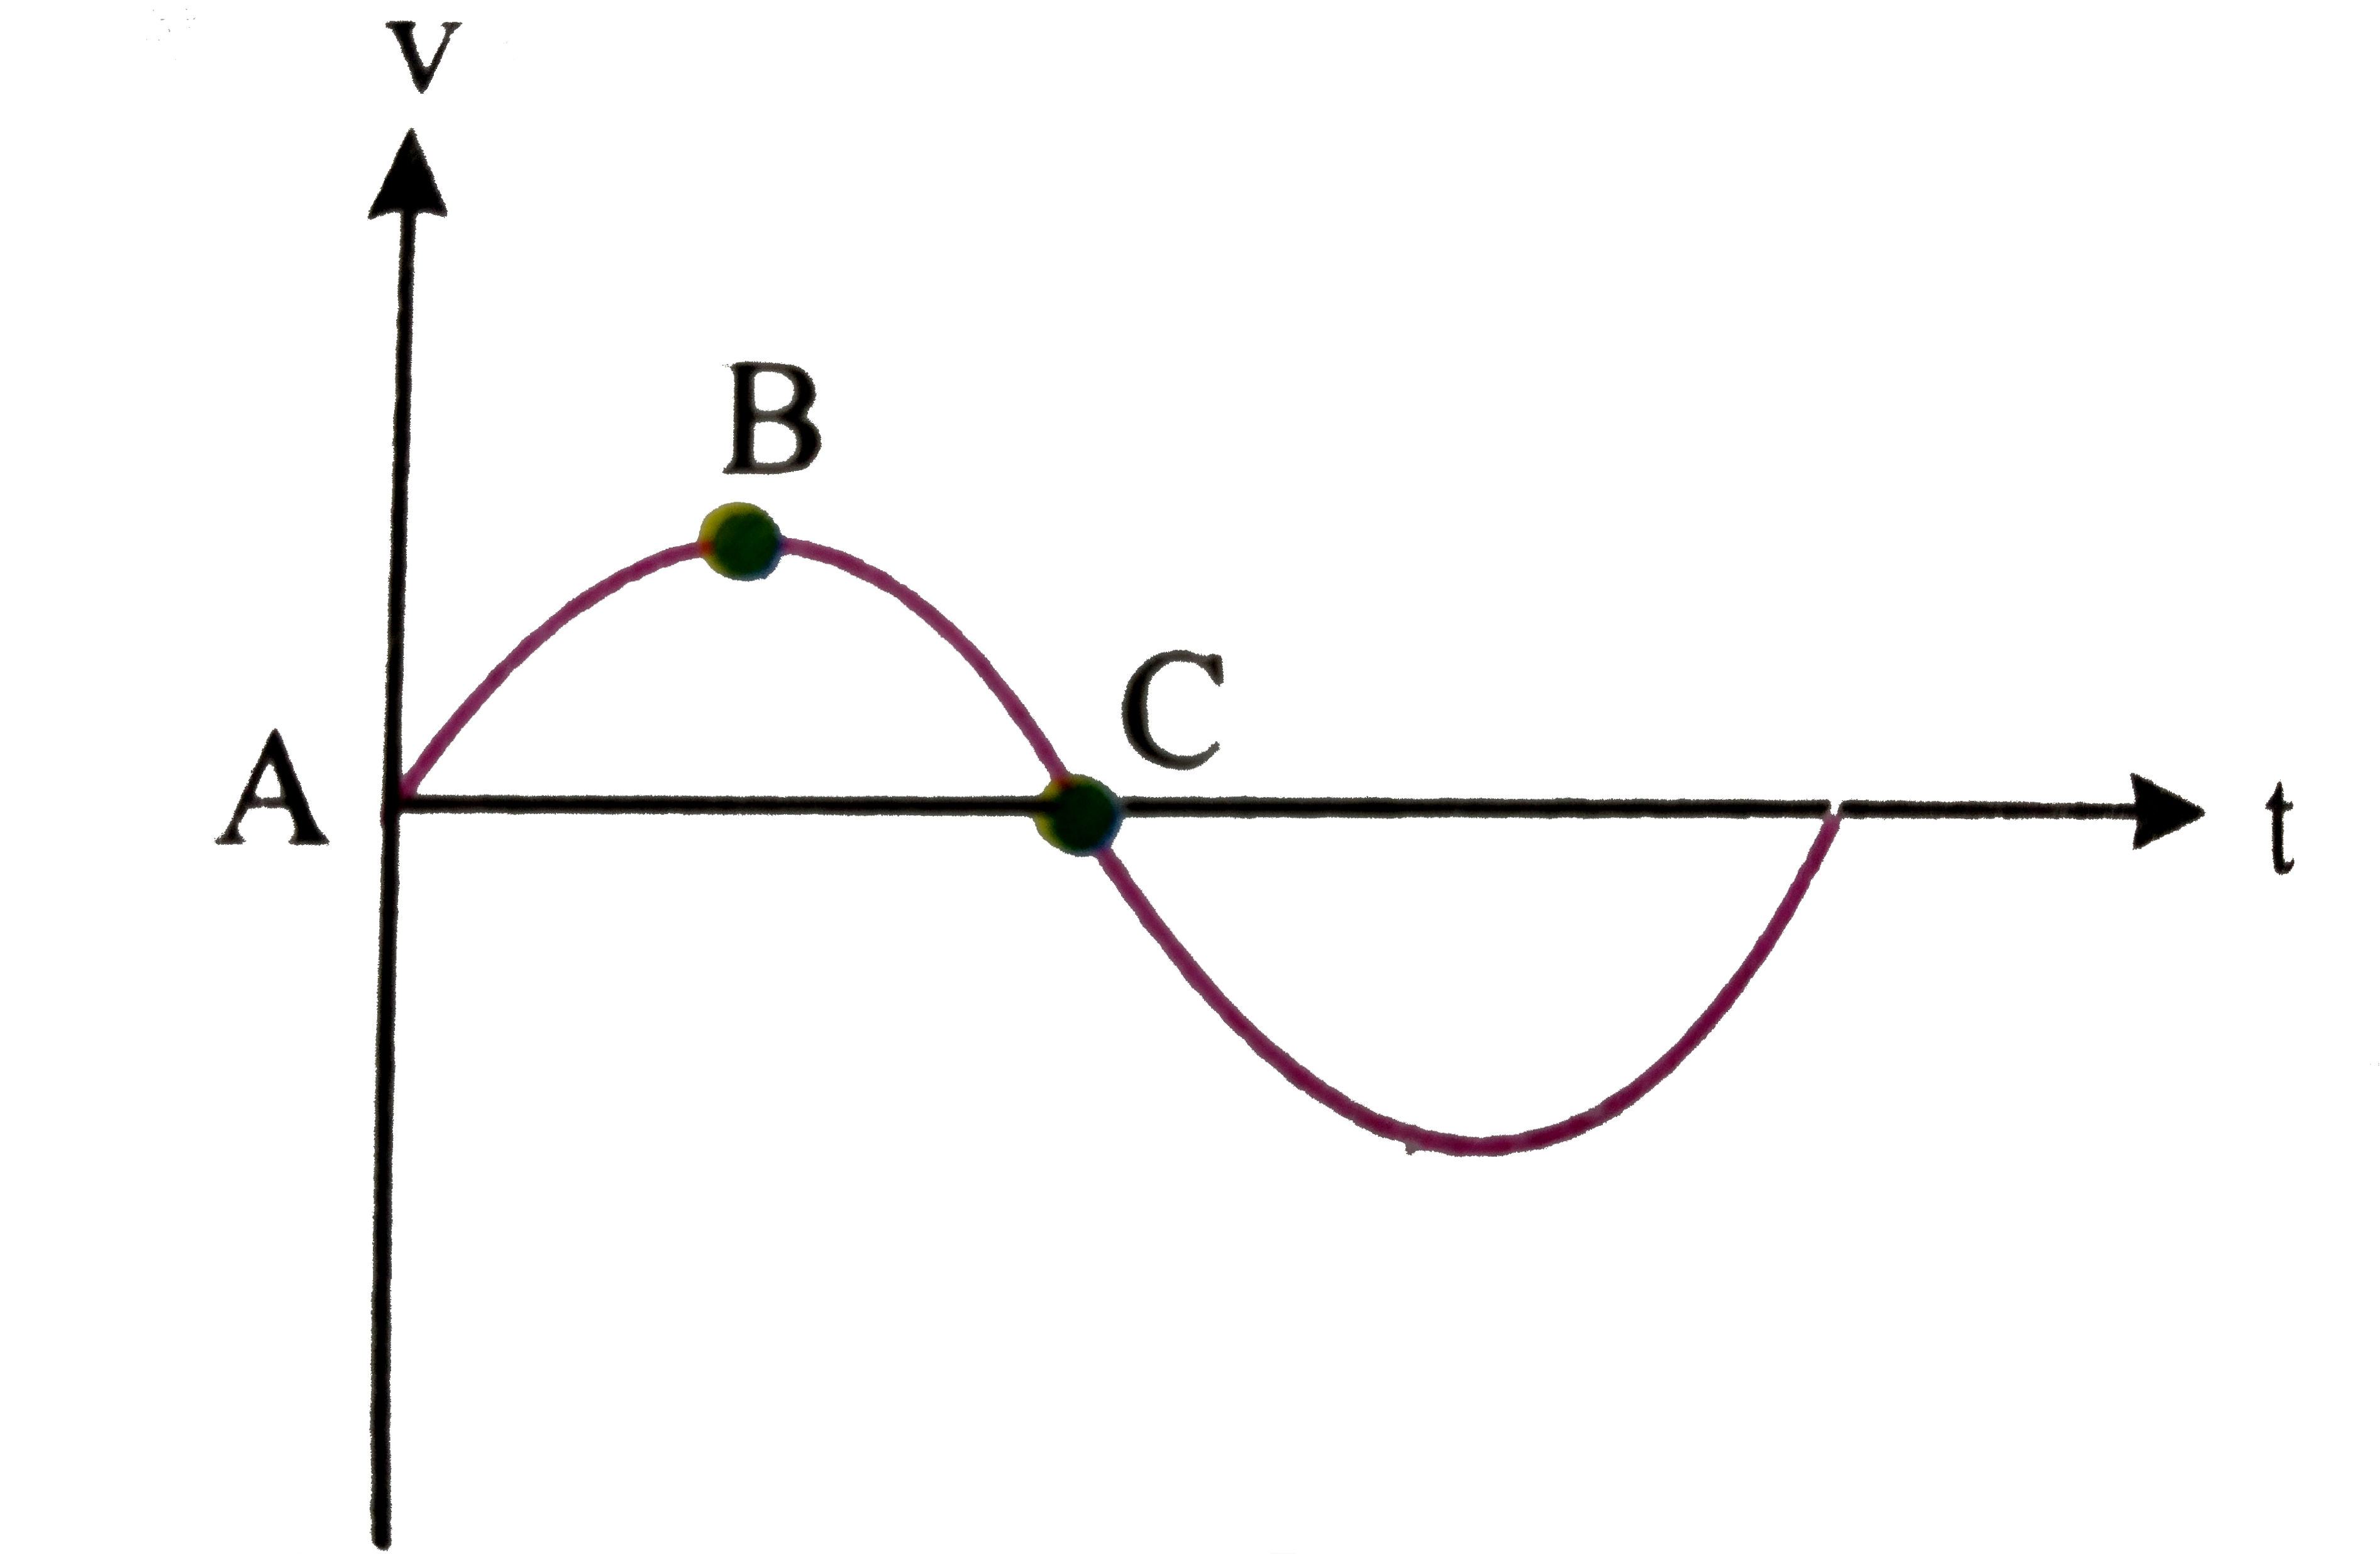
View Solutionv−t graph of a particle in SHM is as shown is figure. Choose the wrong option.
 View Solution
graph of an ideal gas is as shown in figure.
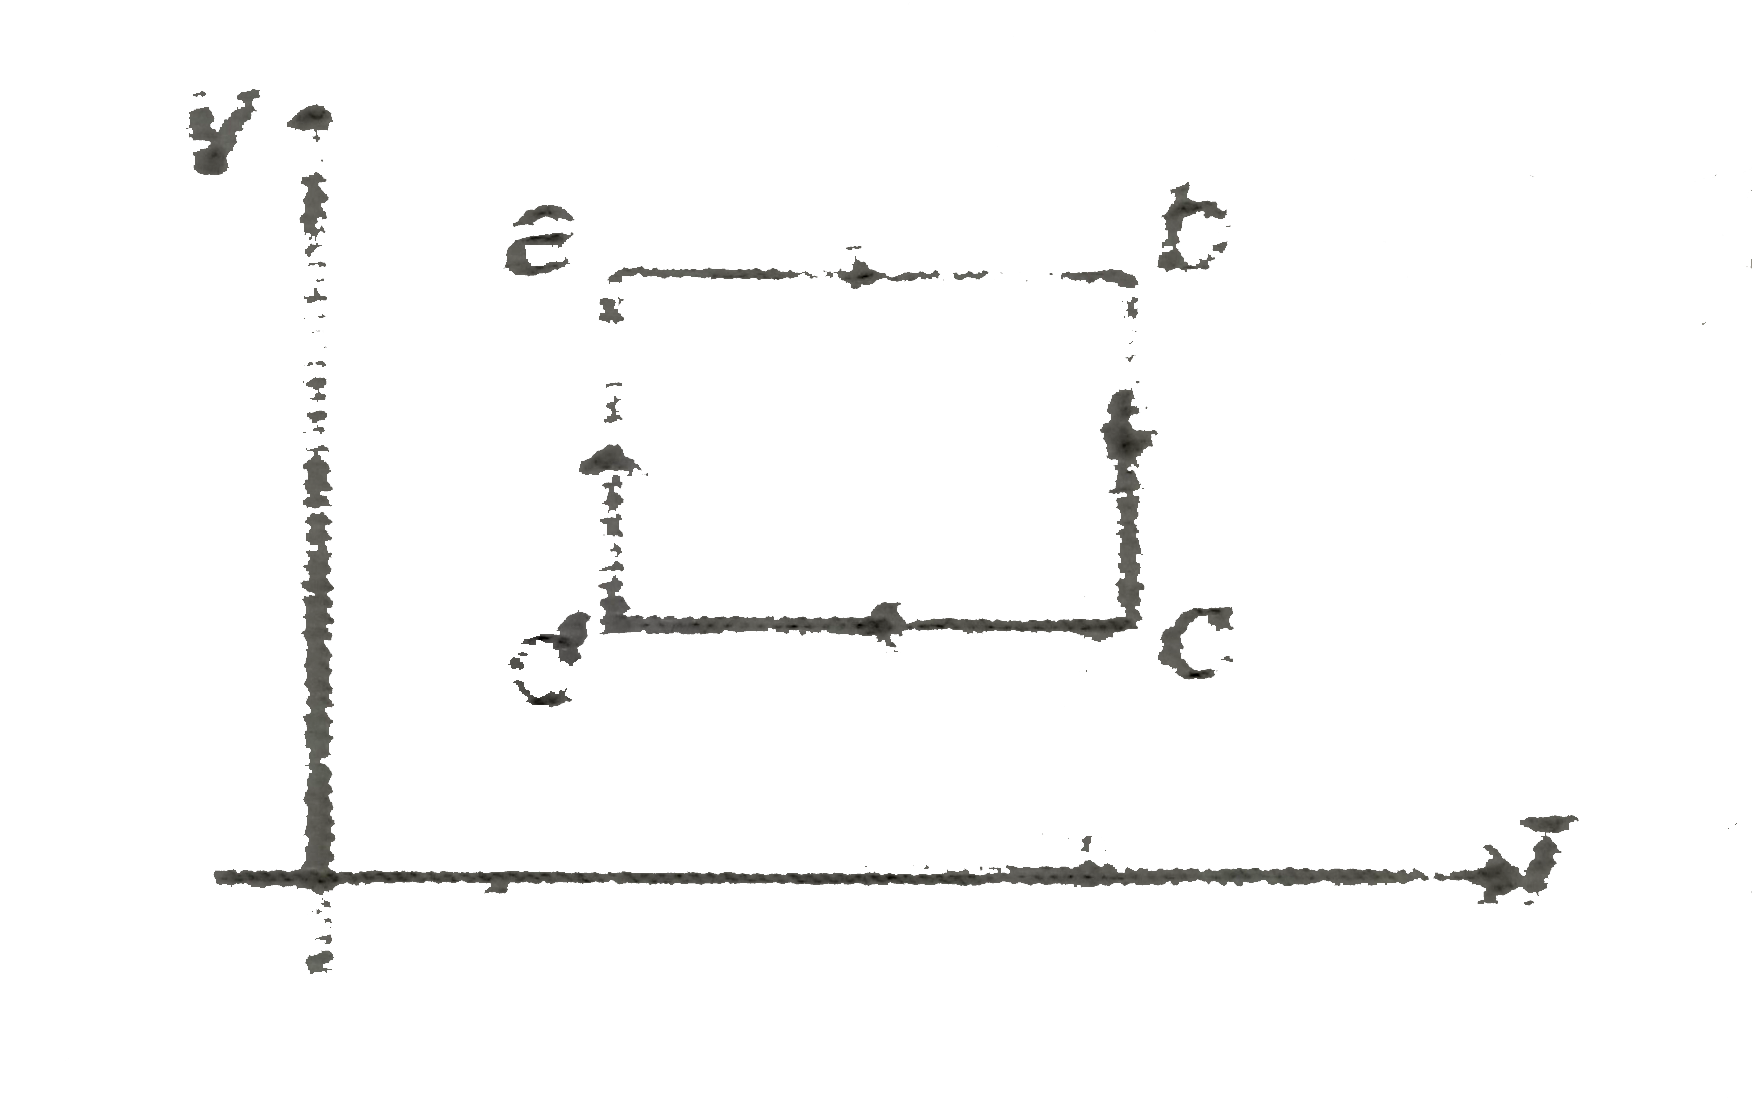
Heat is supplied to the gas in process (s).View Solution

