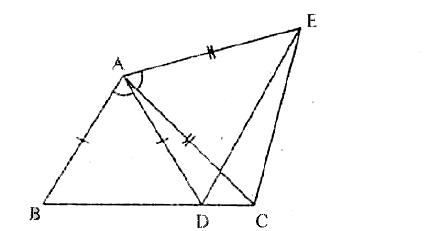
In the figure, AC = AE, AB = AD and BAD = EAC. Show that BC = DE
 Solution in Kannada
Step by step video & image solution for In the figure, AC = AE, AB = AD and BAD = EAC. Show that BC = DE by Maths experts to help you in doubts & scoring excellent marks in Class 12 exams.
Updated on:21/07/2023Topper's Solved these Questions
- TRIANGLESBOOK - SUBHASH PUBLICATIONCHAPTER - TRIANGLESEXERCISE - Exercise 5.2
7 Videos
- TRIANGLESBOOK - SUBHASH PUBLICATIONCHAPTER - TRIANGLESEXERCISE - Exercise 5.3
4 Videos
- THREE DIMENSIONAL GEOMETRYBOOK - SUBHASH PUBLICATIONCHAPTER - THREE DIMENSIONAL GEOMETRYEXERCISE - TRY YOURSELF
11 Videos
- VECTOR ALGEBRA BOOK - SUBHASH PUBLICATIONCHAPTER - VECTOR ALGEBRA EXERCISE - TRY YOURSELF
4 Videos
Similar Questions
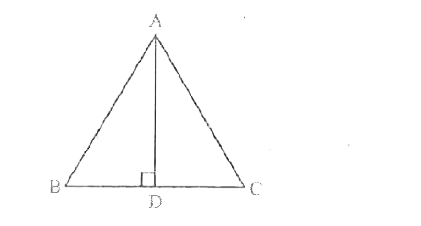
In ΔABC, AD is the perpendicular bisector of BC. Show that ΔABC is an isoscelss tringle in which AB = AC.

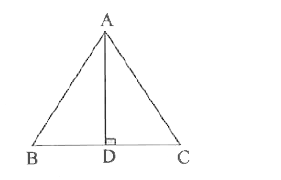
View SolutionAD is an altiude of an isosceles triangle ABC in which AB = AC. Show that
(i) AD bisects BC (ii) AD bisects A.

View SolutionFind the equation of the plane through the intersection of the planes 3x−y+2z−4=0 and z+y+z−2=0 and the point (2,2,1).
View SolutionFind the area of the triangle with vertices A(1,1,2), B(2,3,5) and C(1,5,5).
View SolutionHow many lines of symmetry does the above figure have ?
View SolutionDetermine the point of symmetry of a regular hexagon.
View SolutionDtermine the images of the following figure about the given line :
View SolutionIn the figure above (not to scale), ¯¯¯¯¯¯AB⊥¯¯¯¯¯¯CDandAD is the bisector of ∠BAE.AB=3cm and AC=5cm. Find CD.
View SolutionMatch the following Column A to Column B

View SolutionMatch the following Column A to Column B

View SolutionMatch the following Column A to Column B

View SolutionFind the area of the figure given below.

View SolutionThe area of the shaded part in the figure given below is ______.

View SolutionThe inequation represented by the graph given below is :
View SolutionThe inequation that best describes the graph given below is _________
View SolutionThe inequation that best describes the following graph is _________
View Solution
