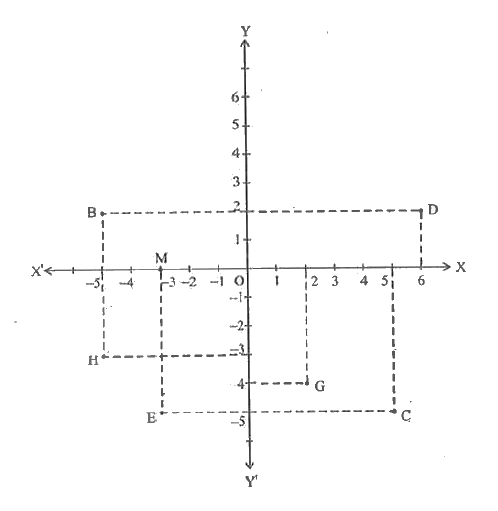
See Fig and write the

The co-ordinates of C Solution in Kannada
The correct Answer is:C(5,−5)
Step by step video & image solution for See Fig and write the The co-ordinates of C by Maths experts to help you in doubts & scoring excellent marks in Class 12 exams.
Updated on:21/07/2023Topper's Solved these Questions
- CO-ORDINATE GEOMETRY BOOK - SUBHASH PUBLICATIONCHAPTER - CO-ORDINATE GEOMETRY EXERCISE - EXERCISE 9.3
1 Videos
- CO-ORDINATE GEOMETRY BOOK - SUBHASH PUBLICATIONCHAPTER - CO-ORDINATE GEOMETRY EXERCISE - EXERCISE 9.3
1 Videos
- APPLICATIONS OF INTEGRALSBOOK - SUBHASH PUBLICATIONCHAPTER - APPLICATIONS OF INTEGRALSEXERCISE - TRY YOURSELF
5 Videos
- CONSTRUCTIONS BOOK - SUBHASH PUBLICATIONCHAPTER - CONSTRUCTIONS EXERCISE - QUESTION
1 Videos
Similar Questions
In which quandrant or on which axis do each of the points (−2,4),(3,−1),(−1,0),(1,2)and(−3,−5) lie ? Verify you answer by locating them on the cartesian plane.
View SolutionIn which quandrant or on which axis do each of the points (−2,4),(3,−1),(−1,0),(1,2)and(−3,−5) lie ? Verify you answer by locating them on the cartesian plane.
View SolutionUsing integration, find the area of region bounded by the triangle whose vertices are (−1,0),(1,3) and (3,2).
View SolutionConstruct a triangle PQR in which QR = 6cm , ⌊Q=60∘ and PR - PQ =2cm.
View SolutionHow many lines of symmetry does the above figure have ?
View SolutionWhich of the following are correct chain isomers of butane ? (i)
View SolutionDetermine the point of symmetry of a regular hexagon.
View SolutionDtermine the images of the following figure about the given line :
View SolutionMatch the following Column A to Column B

View SolutionMatch the following Column A to Column B

View SolutionMatch the following Column A to Column B

View SolutionFind the area of the figure given below.

View SolutionThe area of the shaded part in the figure given below is ______.

View SolutionThe inequation represented by the graph given below is :
View SolutionThe inequation that best describes the graph given below is _________
View SolutionThe inequation that best describes the following graph is _________
View Solution
