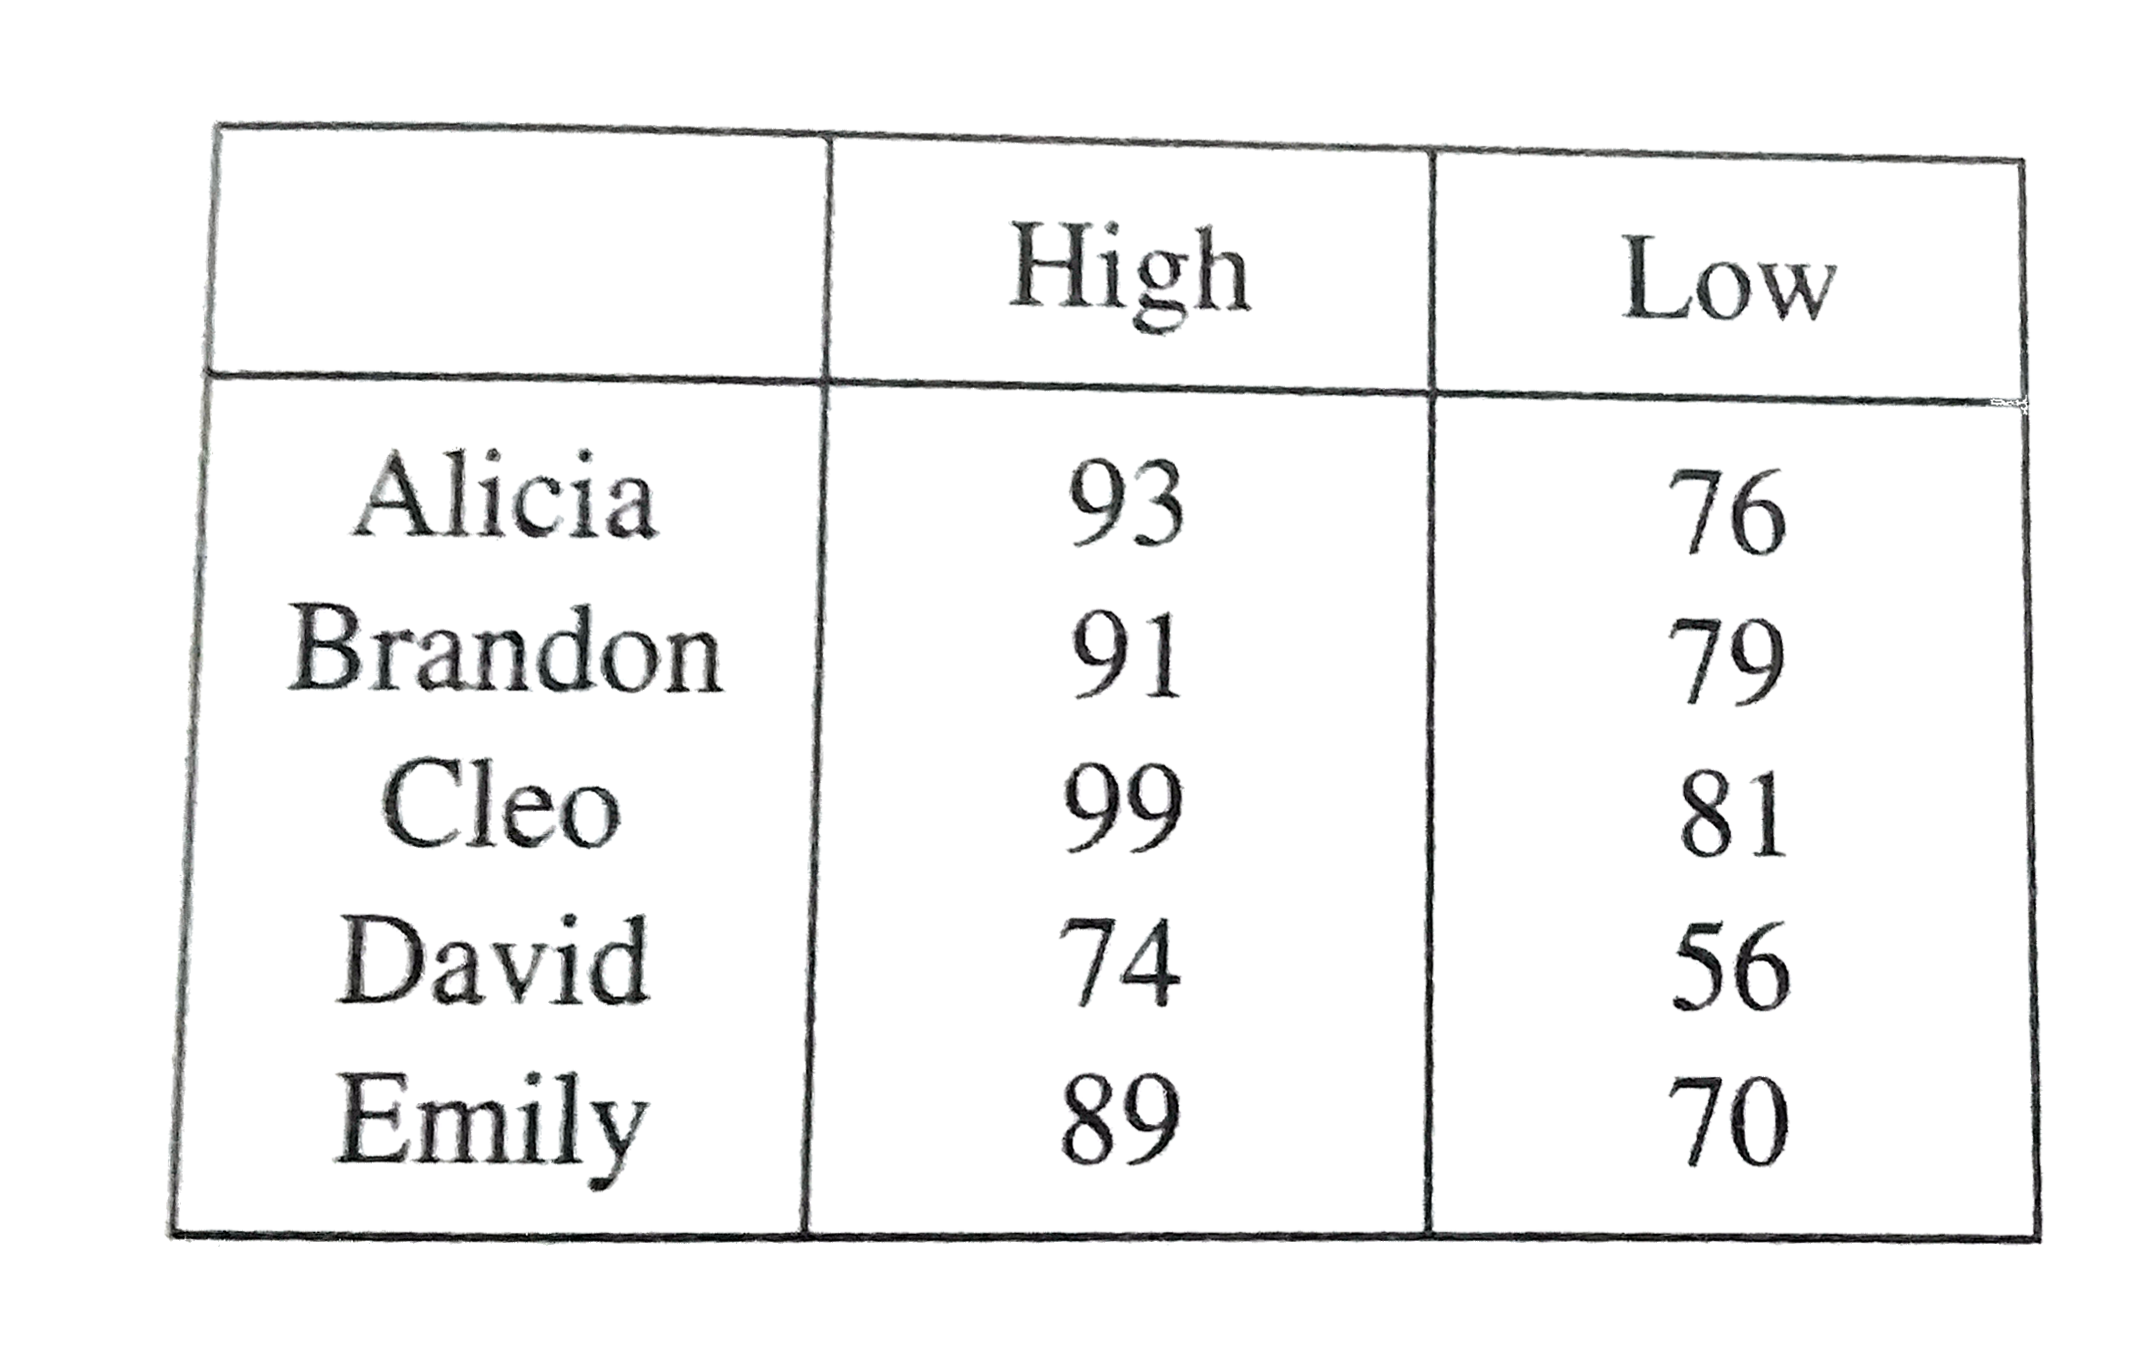
The highest and lowest test scores of five students in Mr . Canyon's science class are listed below . Which students had the greatest range of scores ?

Alicia
Brandon
Cleo
Emily
The correct Answer is:D
Step by step video, text & image solution for The highest and lowest test scores of five students in Mr . Canyon's science class are listed below . Which students had the greatest range of scores ? by Maths experts to help you in doubts & scoring excellent marks in Class 12 exams.
Topper's Solved these Questions
Similar Questions
n=12×2t3
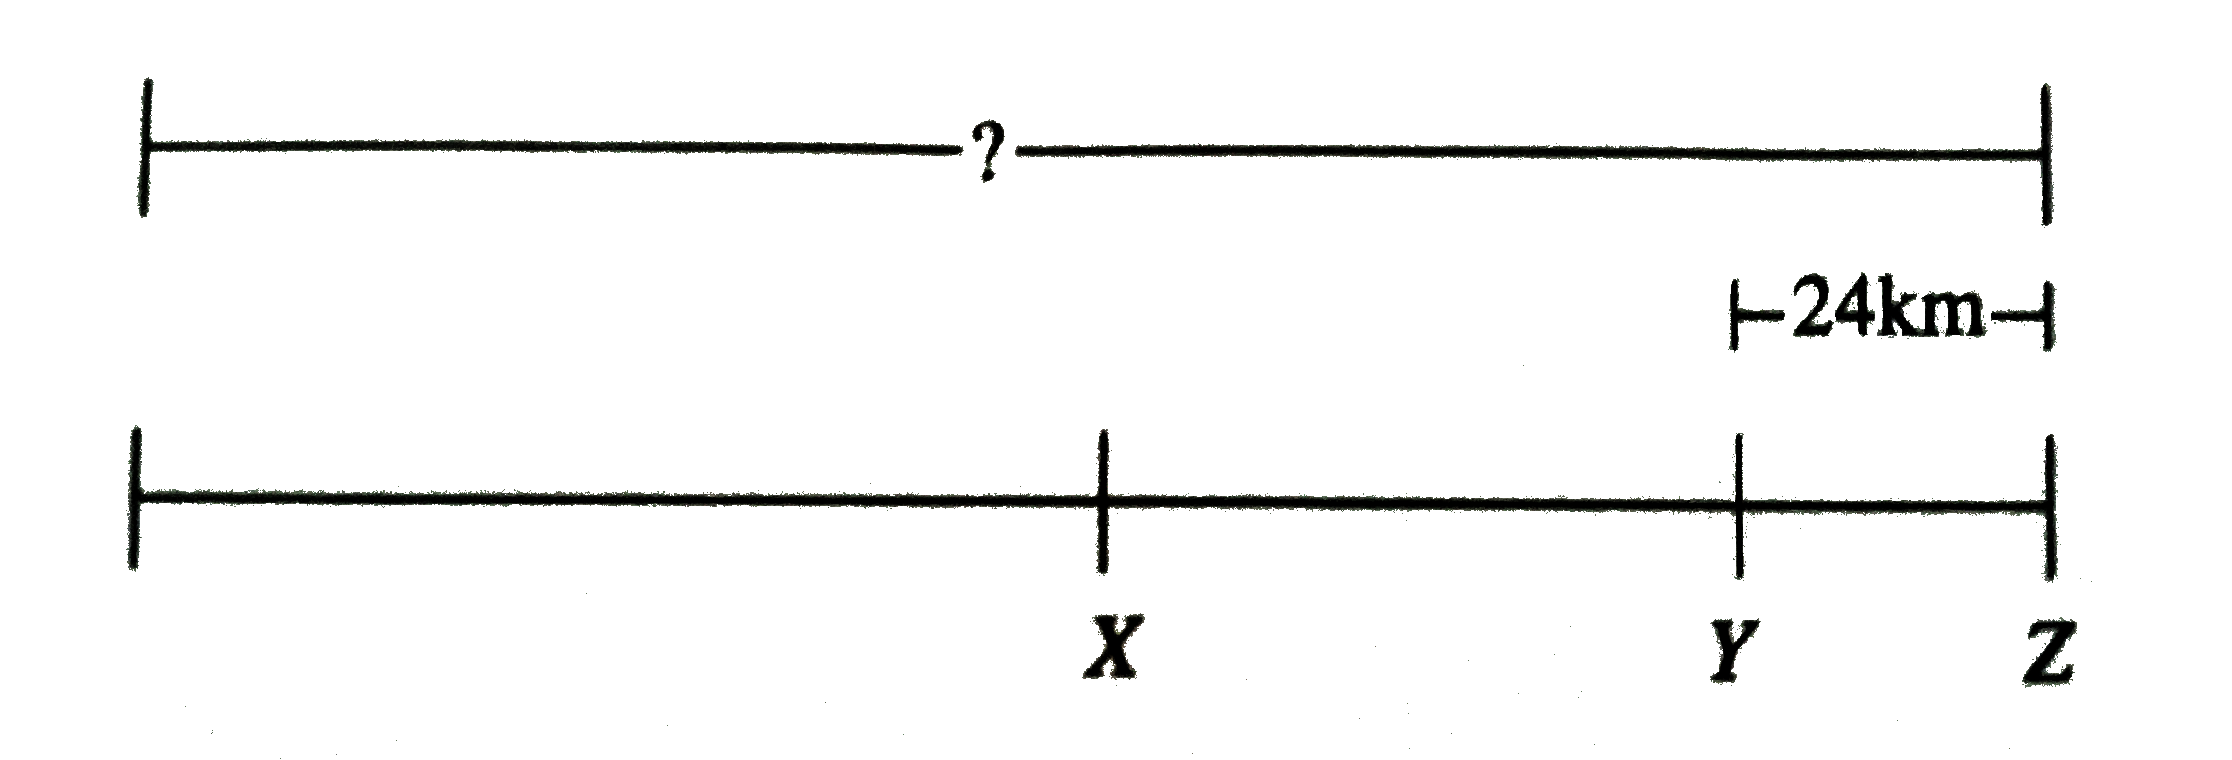
The number of mice in a certain colony is shown by the formula above, such that n is the number of mice and t is the time, in months, since the start of the colony. IF 2 years have passed since the start of the colony, how many mice does the colony contain now?View SolutionIn the hiking trail shown below .X marks the trail's halfway point .If ¯¯¯¯¯¯YZ measures 24 kilometers and is 13 the length of ¯¯¯¯xz , what is the total length , in kilometers of the trail ?
 01:37View Solution
Match the following lists:
 06:07View Solution
How many lines of symmetry does the above figure have ?
02:11View SolutionWhich of the following are correct chain isomers of butane ? (i)
01:31View SolutionDetermine the point of symmetry of a regular hexagon.
02:45View SolutionDtermine the images of the following figure about the given line :
02:17View SolutionMatch the following Column A to Column B
 05:41View Solution
Match the following Column A to Column B
 03:28View Solution
Match the following Column A to Column B
 02:31View Solution
Find the area of figure given below.
 02:21View Solution
Find the perimeter of the figure given below.
 02:03View Solution
Find the area of the figure given below.
 02:10View Solution
The area of the shaded part in the figure given below is ______.
 02:17View Solution
The inequation represented by the graph given below is :
02:10View SolutionThe inequation that best describes the graph given below is _________
04:23View Solution

