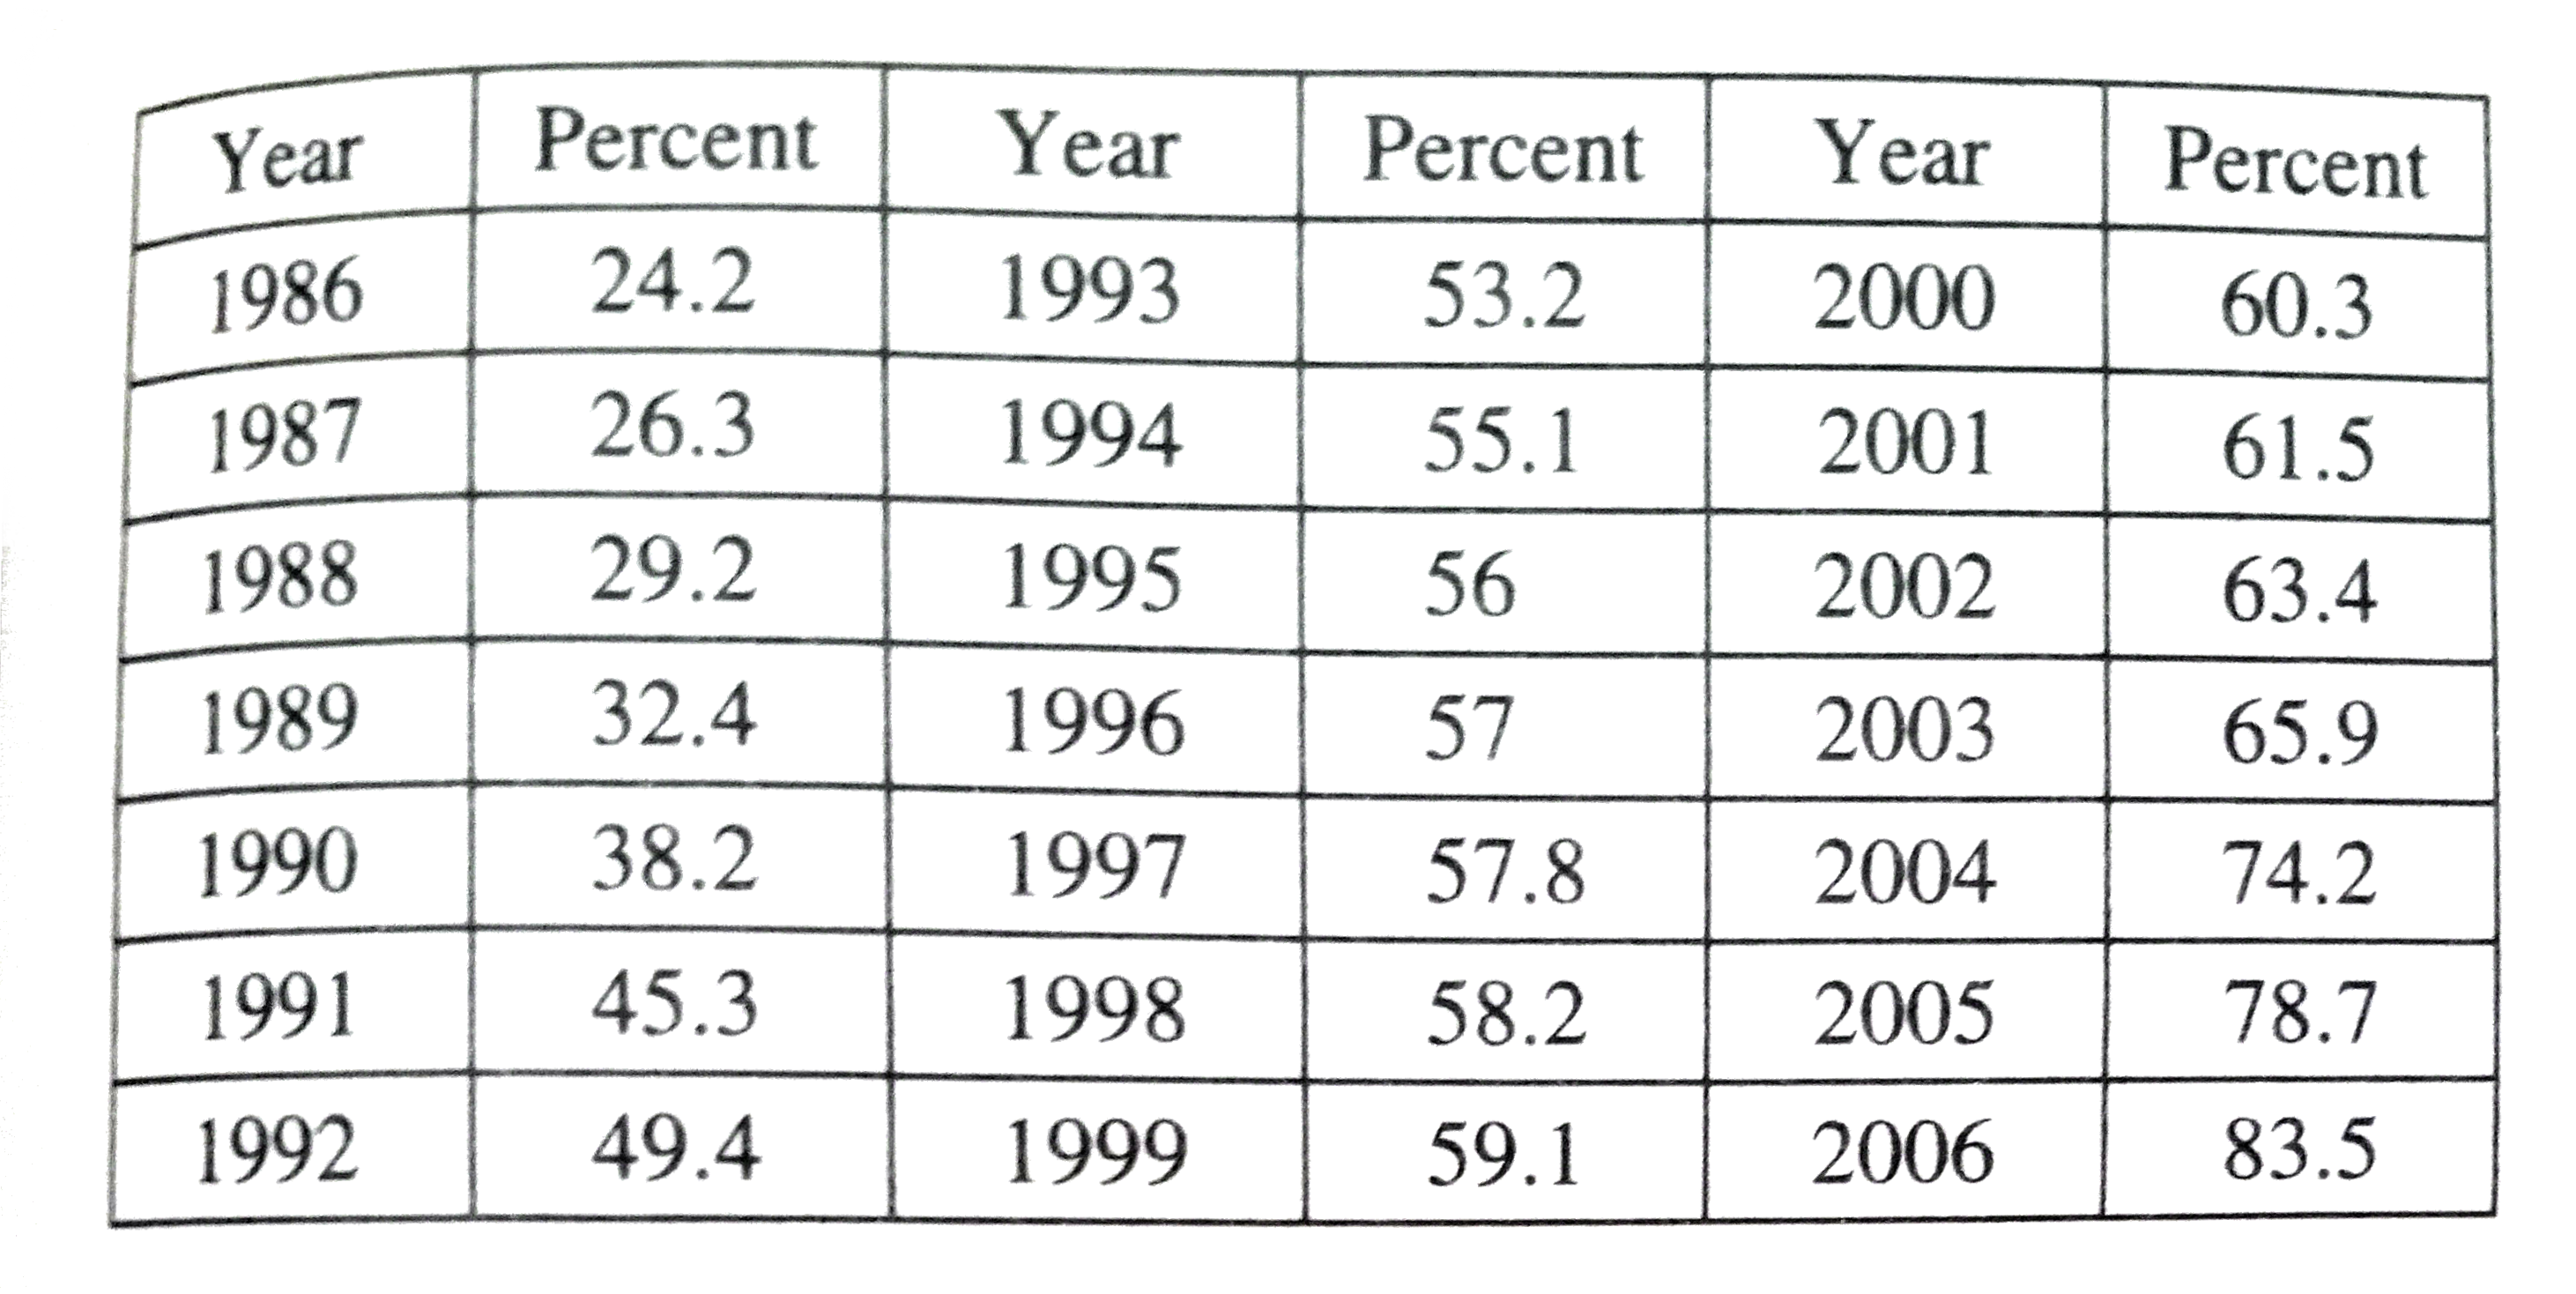
The table below shows the percents of U.S. citizens who had ever consumed Bob's soda , out of all soda consumers , for each year form 1986 through 2006.

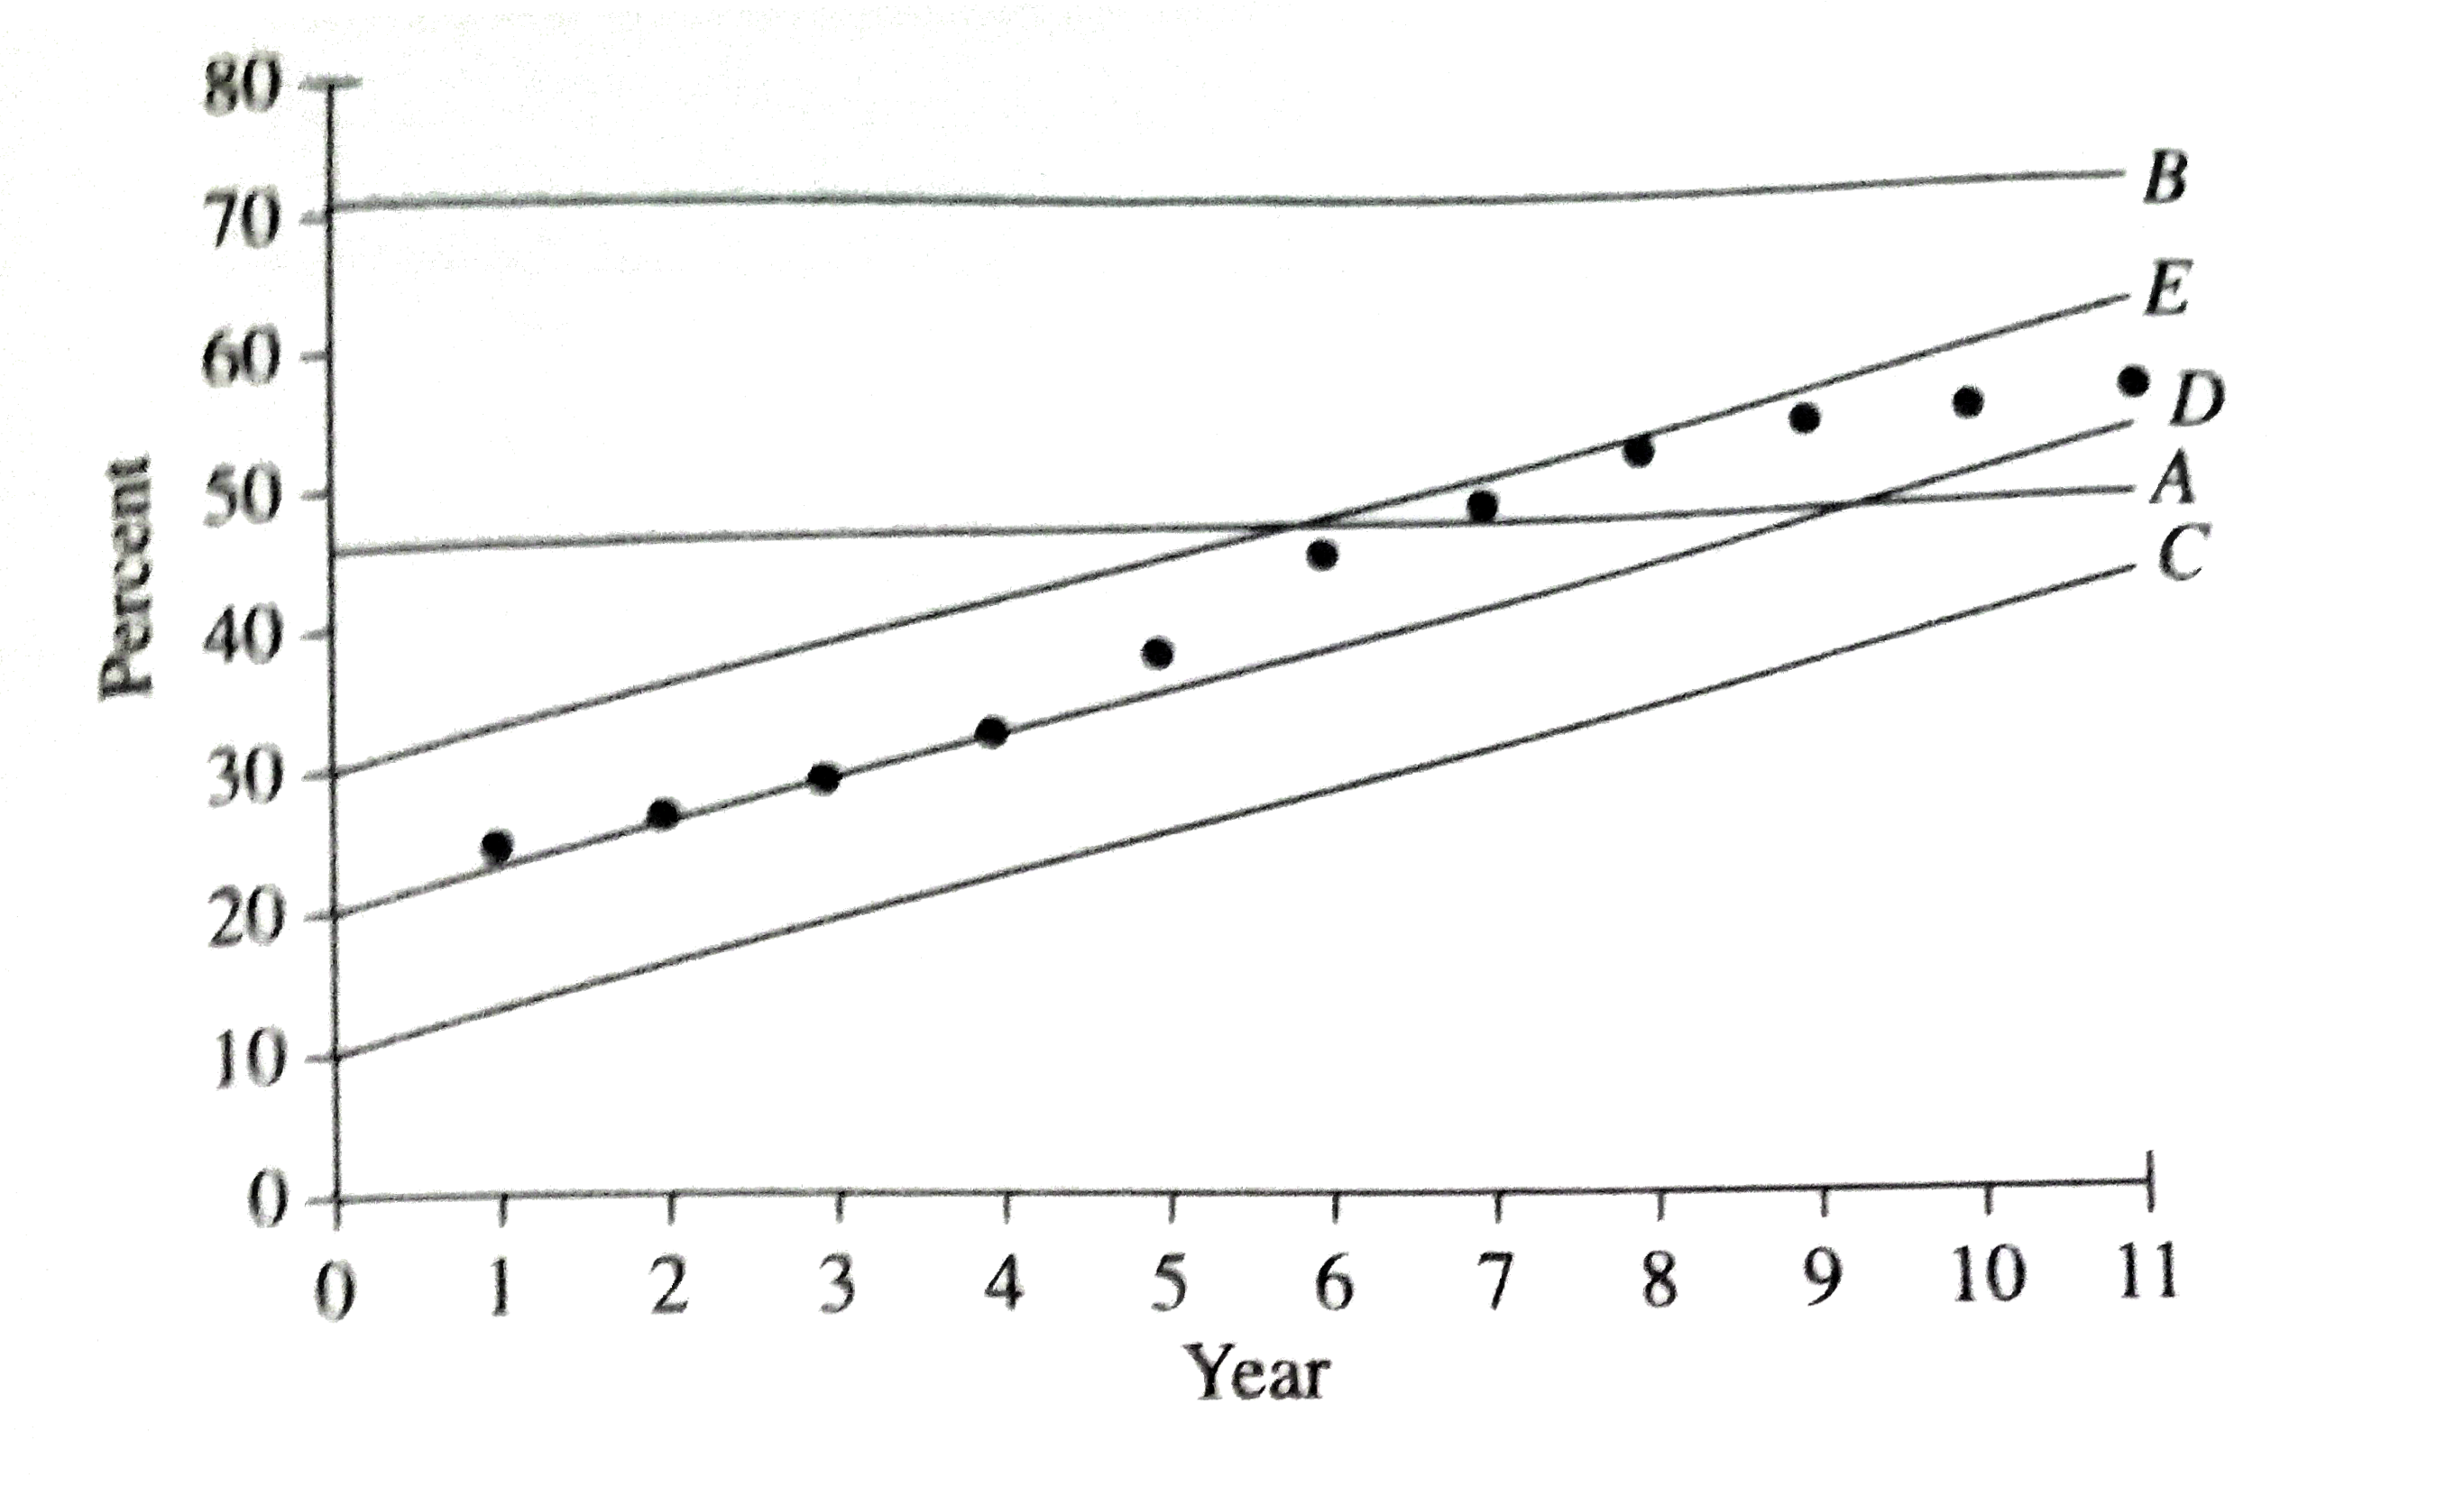
The figure below shows a scatterplot of the data in the table and solid lines that are possible modals for the data. Which of the 5 lines appears to be the best representation of the data ?

A
B
C
D
The correct Answer is:D
Topper's Solved these Questions
Similar Questions
If Alex can fold 12 napkins in x minutes, how many napkins can be fold in y hours?
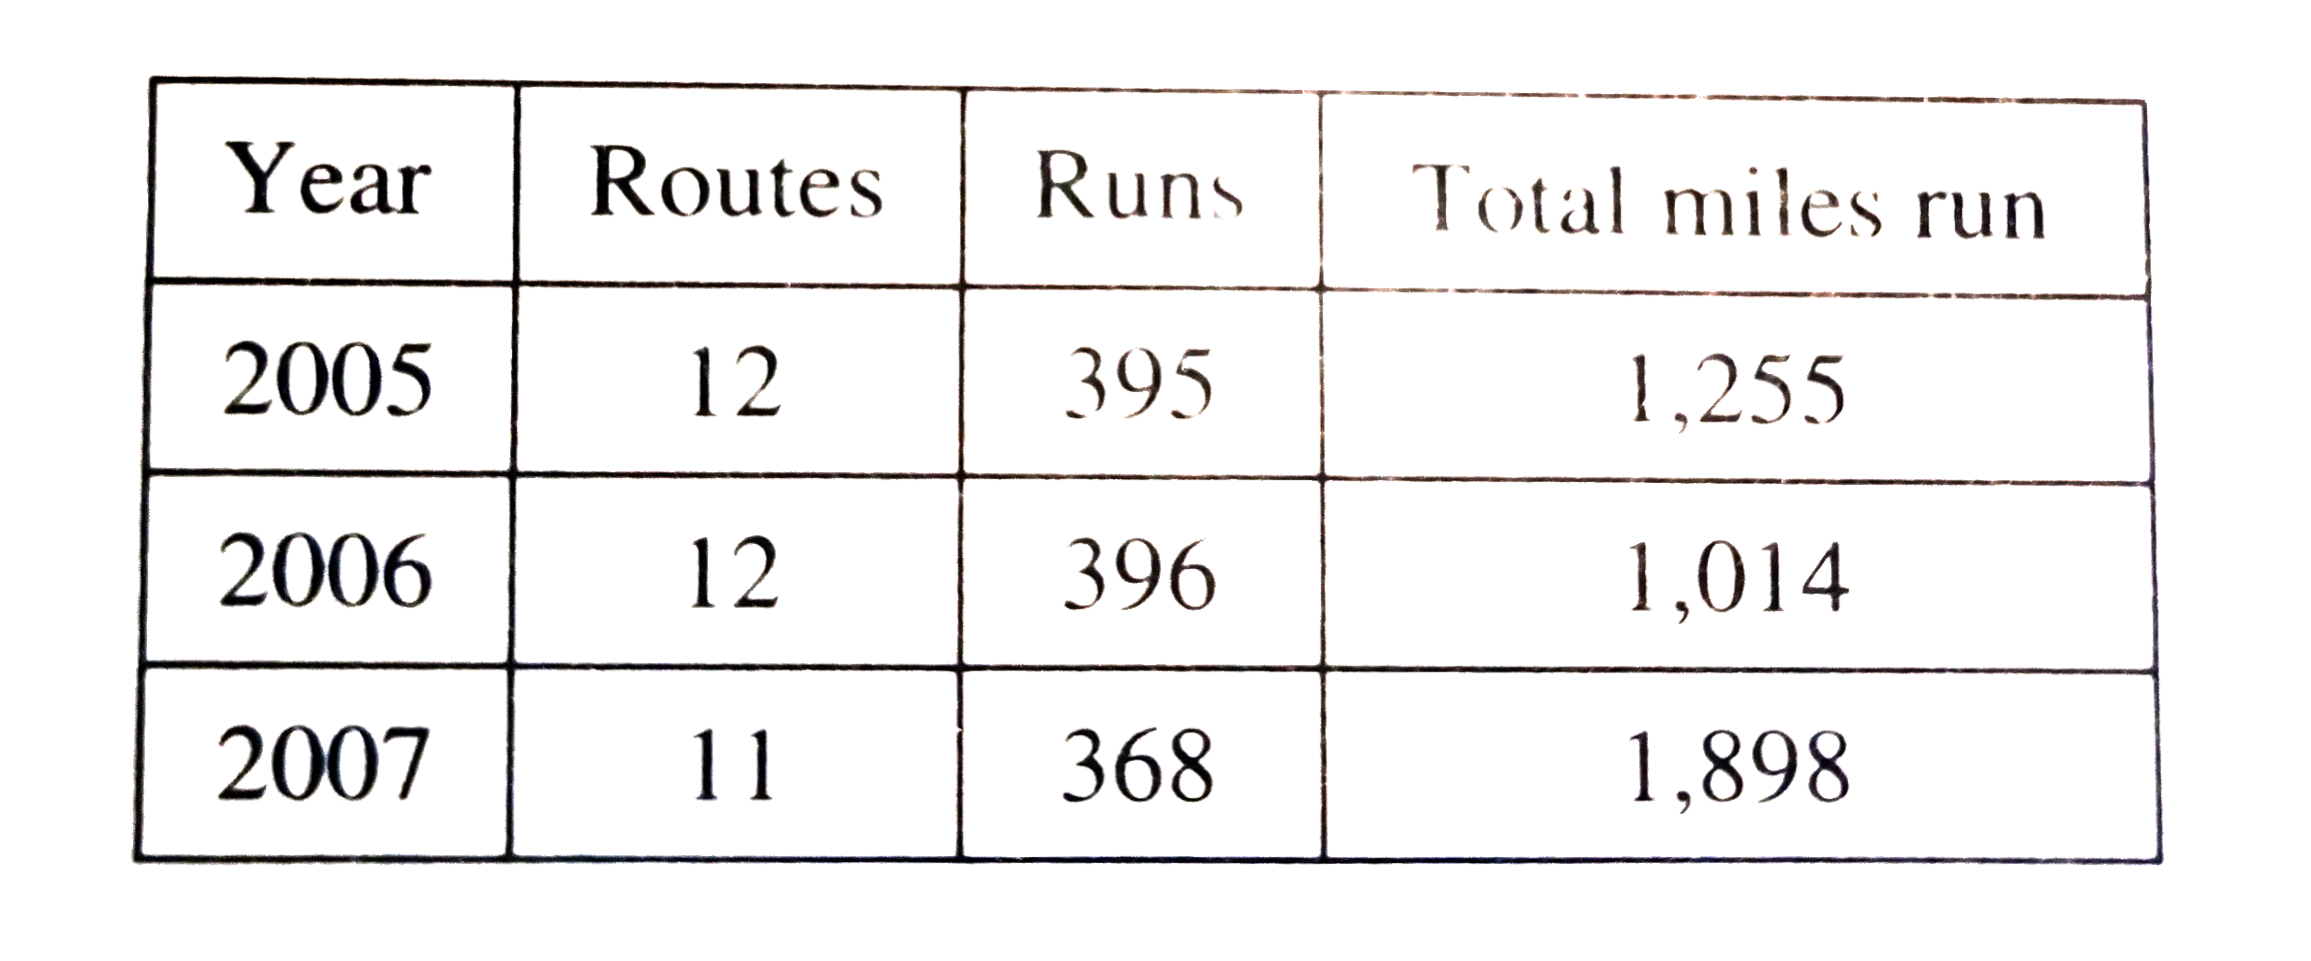
View SolutionFor each of 3 years , the table below gives the number of different routes a runner ran , the number of runs she ran , and the total number of miles she ran .

To the nearest tenth of a mile , what is the average number of miles the runner ran per run in 2005 ?
View SolutionFrom the following data, using weighted average method, calculate the cost of living index for the year 2006, taking 2002 as the base year.
ltimg src="https://d10lpgp6xz60nq.cloudfront.net/physics_images/PS_MATH_IX_C18_E03_005_Q01.png" width="80%"gt
View SolutionHow many lines of symmetry does the above figure have ?
View SolutionDetermine the point of symmetry of a regular hexagon.
View SolutionDtermine the images of the following figure about the given line :
View SolutionMatch the following Column A to Column B

View SolutionMatch the following Column A to Column B

View SolutionMatch the following Column A to Column B

View SolutionFind the area of figure given below.

View SolutionFind the perimeter of the figure given below.

View SolutionFind the area of the figure given below.

View SolutionThe area of the shaded part in the figure given below is ______.

View SolutionThe inequation represented by the graph given below is :
View SolutionThe inequation that best describes the graph given below is _________
View SolutionThe inequation that best describes the following graph is _________
View Solution
