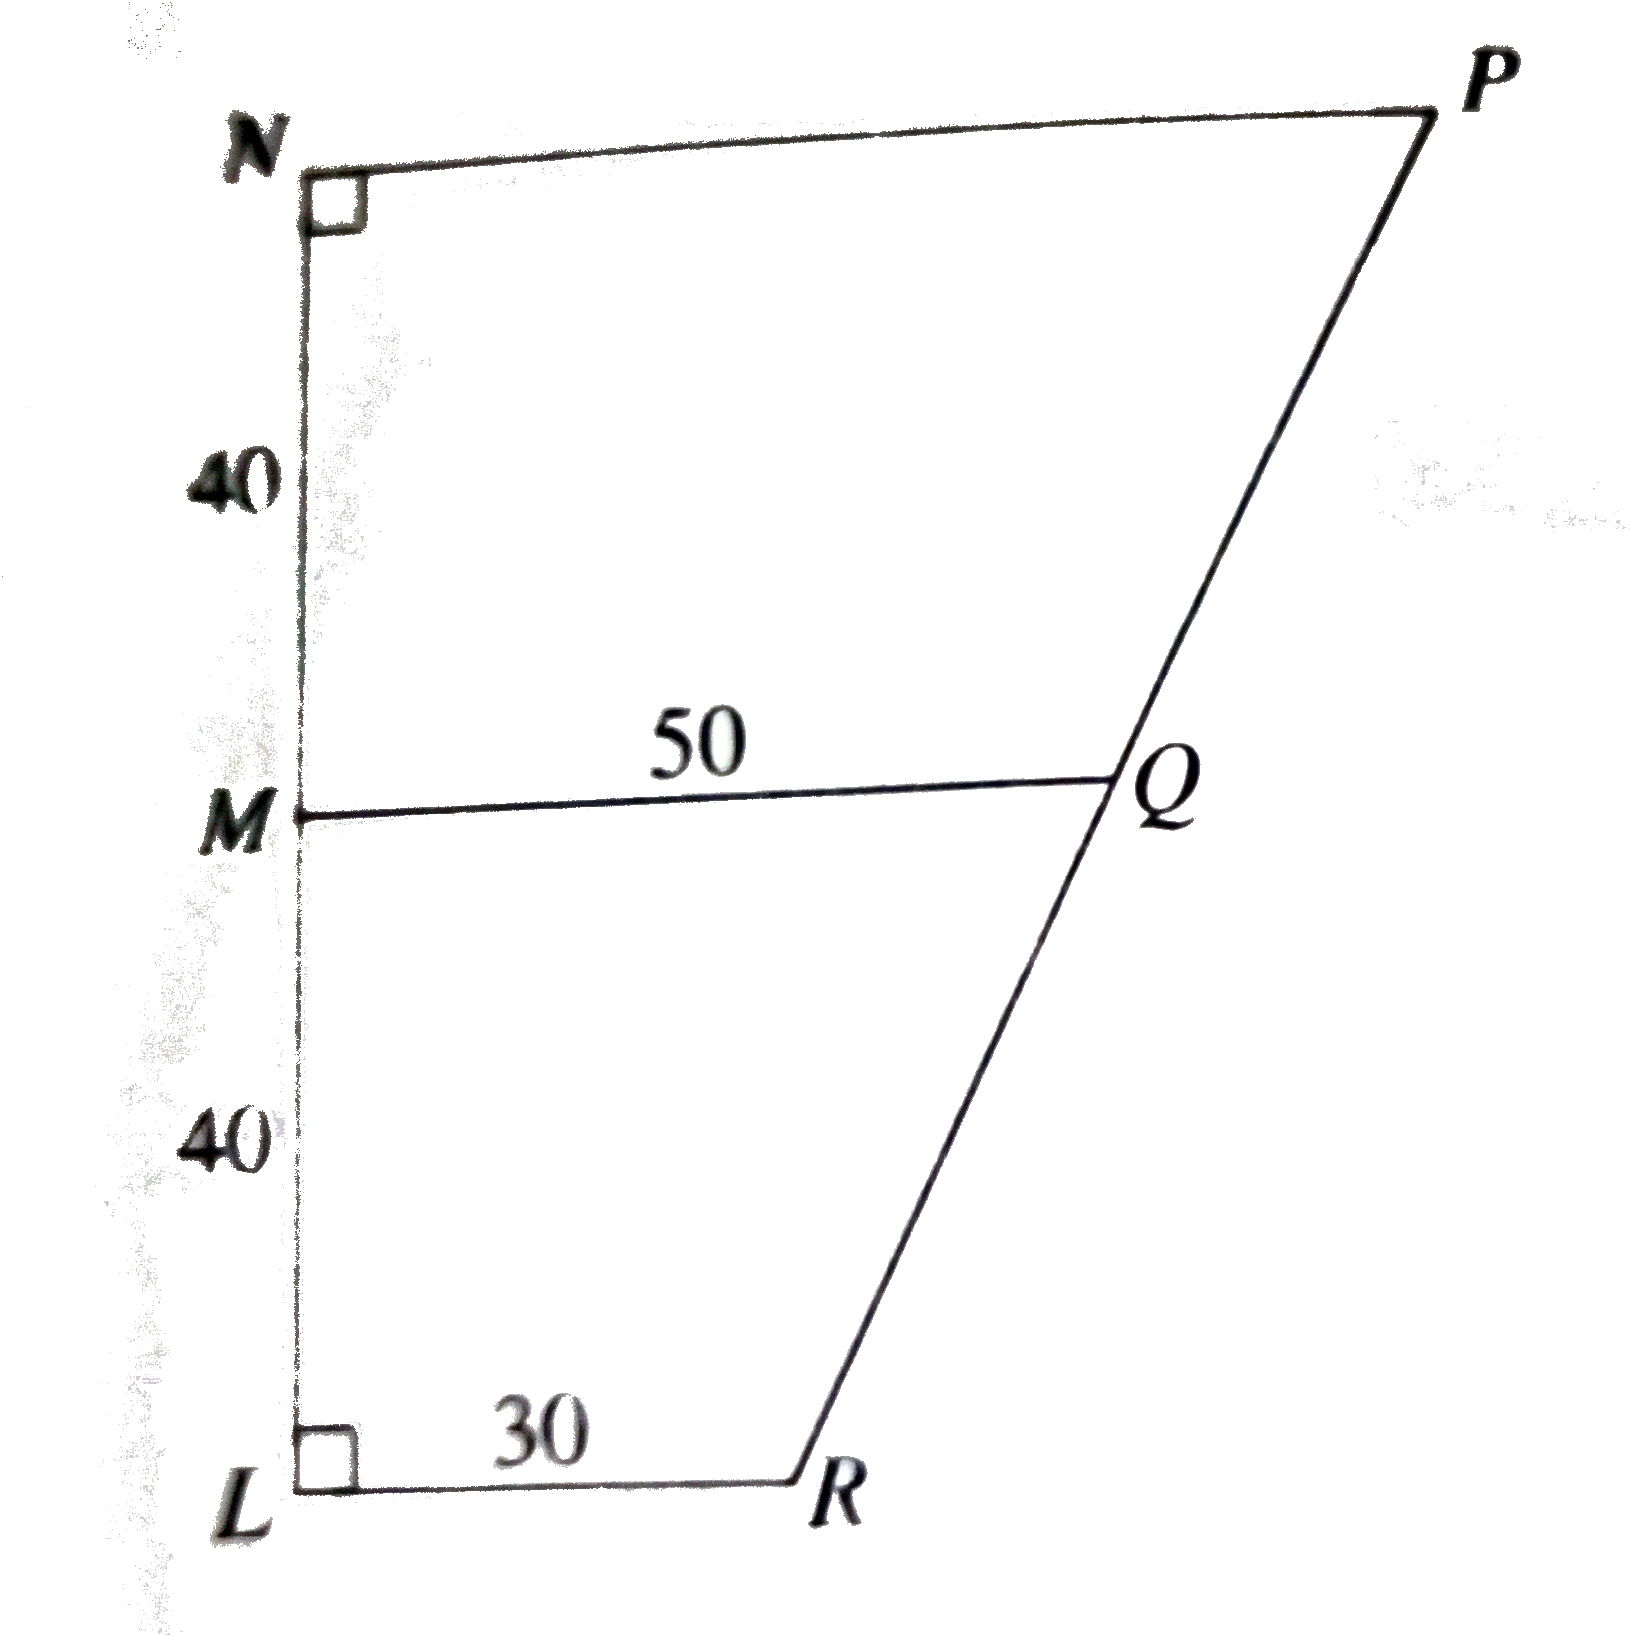
In the figure below , is on ¯¯¯¯¯¯NL and Q is on ¯¯¯¯¯¯PR . The measurements are given in feet . Both NPQM and MQRL are trapezoids. The area , A , of a trapezoid is given by A=12h(b1+b2) , where h is the height and b1 and b2 are the lengths of the 2 parallel sides.

What is the area of MQRL , in square feet ?
3,200
1,750
1,600
600
The correct Answer is:C
Step by step video, text & image solution for In the figure below , is on bar(NL) and Q is on bar(PR) . The measurements are given in feet . Both NPQM and MQRL are trapezoids. The area , A , of a trapezoid is given by A=1/2h(b_1+b_2) , where h is the height and b_1 and b_2 are the lengths of the 2 parallel sides. What is the area of MQRL , in square feet ? by Maths experts to help you in doubts & scoring excellent marks in Class 12 exams.
Topper's Solved these Questions
Similar Questions
Which of the following expressions is equivalent to 2a+4b+6c ?
02:28View SolutionA certain homeowner uses a gas edger to clean up his lawn every time he mows. If the edger uses 160 milliliters of fuel each time, what is the maximum number of times the homeowner can edge his lawn with 8 litres of fuel?( 1 liter = 1,000 milliliters)
02:11View SolutionIn the figure given below, bar(ED)||bar(AB) and bar(EF)||bar(BC) . If /_FED =40^(@) and /_ DEC =20^(@) , then the angle made by bar(BC) at the centre is
01:31View SolutionDetermine the point of symmetry of a regular hexagon.
02:45View SolutionDtermine the images of the following figure about the given line :
02:17View SolutionMatch the following Column A to Column B
 05:41View Solution
Match the following Column A to Column B
 03:28View Solution
Match the following Column A to Column B
 02:31View Solution
Find the area of figure given below.
 02:21View Solution
Find the perimeter of the figure given below.
 02:03View Solution
Find the area of the figure given below.
 02:12View Solution
The area of the shaded part in the figure given below is ______.
 02:10View Solution
Find the area of the shaded part in the figure given above.02:17View SolutionThe inequation represented by the graph given below is :
02:10View SolutionThe inequation that best describes the graph given below is _________
04:23View SolutionThe inequation that best describes the following graph is _________
03:02View Solution

