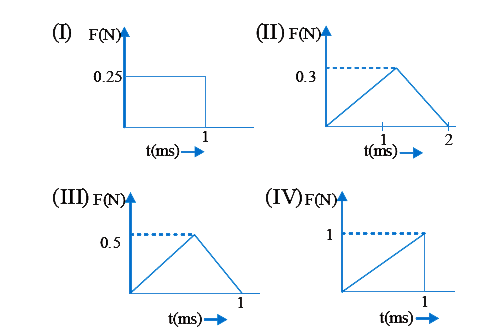
Figures I,II, III & IV depicts variation of force with time. In which situation impulse will be maximum ?
I & II
III & I
III & IV
Only IV
The correct Answer is:3
Step by step video & image solution for Figures I,II, III & IV depicts variation of force with time. In which situation impulse will be maximum ? by Physics experts to help you in doubts & scoring excellent marks in Class 12 exams.
Updated on:21/07/2023Similar Questions
Derive an expression for force and torque acting on an electric field. In which situation, torque on the dipole is (i) maximum and (ii) minimum
View SolutionThe distance time graph of a body is as shown in Figure. In which portion
(i) velocity is maximum (ii) velocity is minimum (iii) velocity is zero ?
View Solution
Knowledge Check
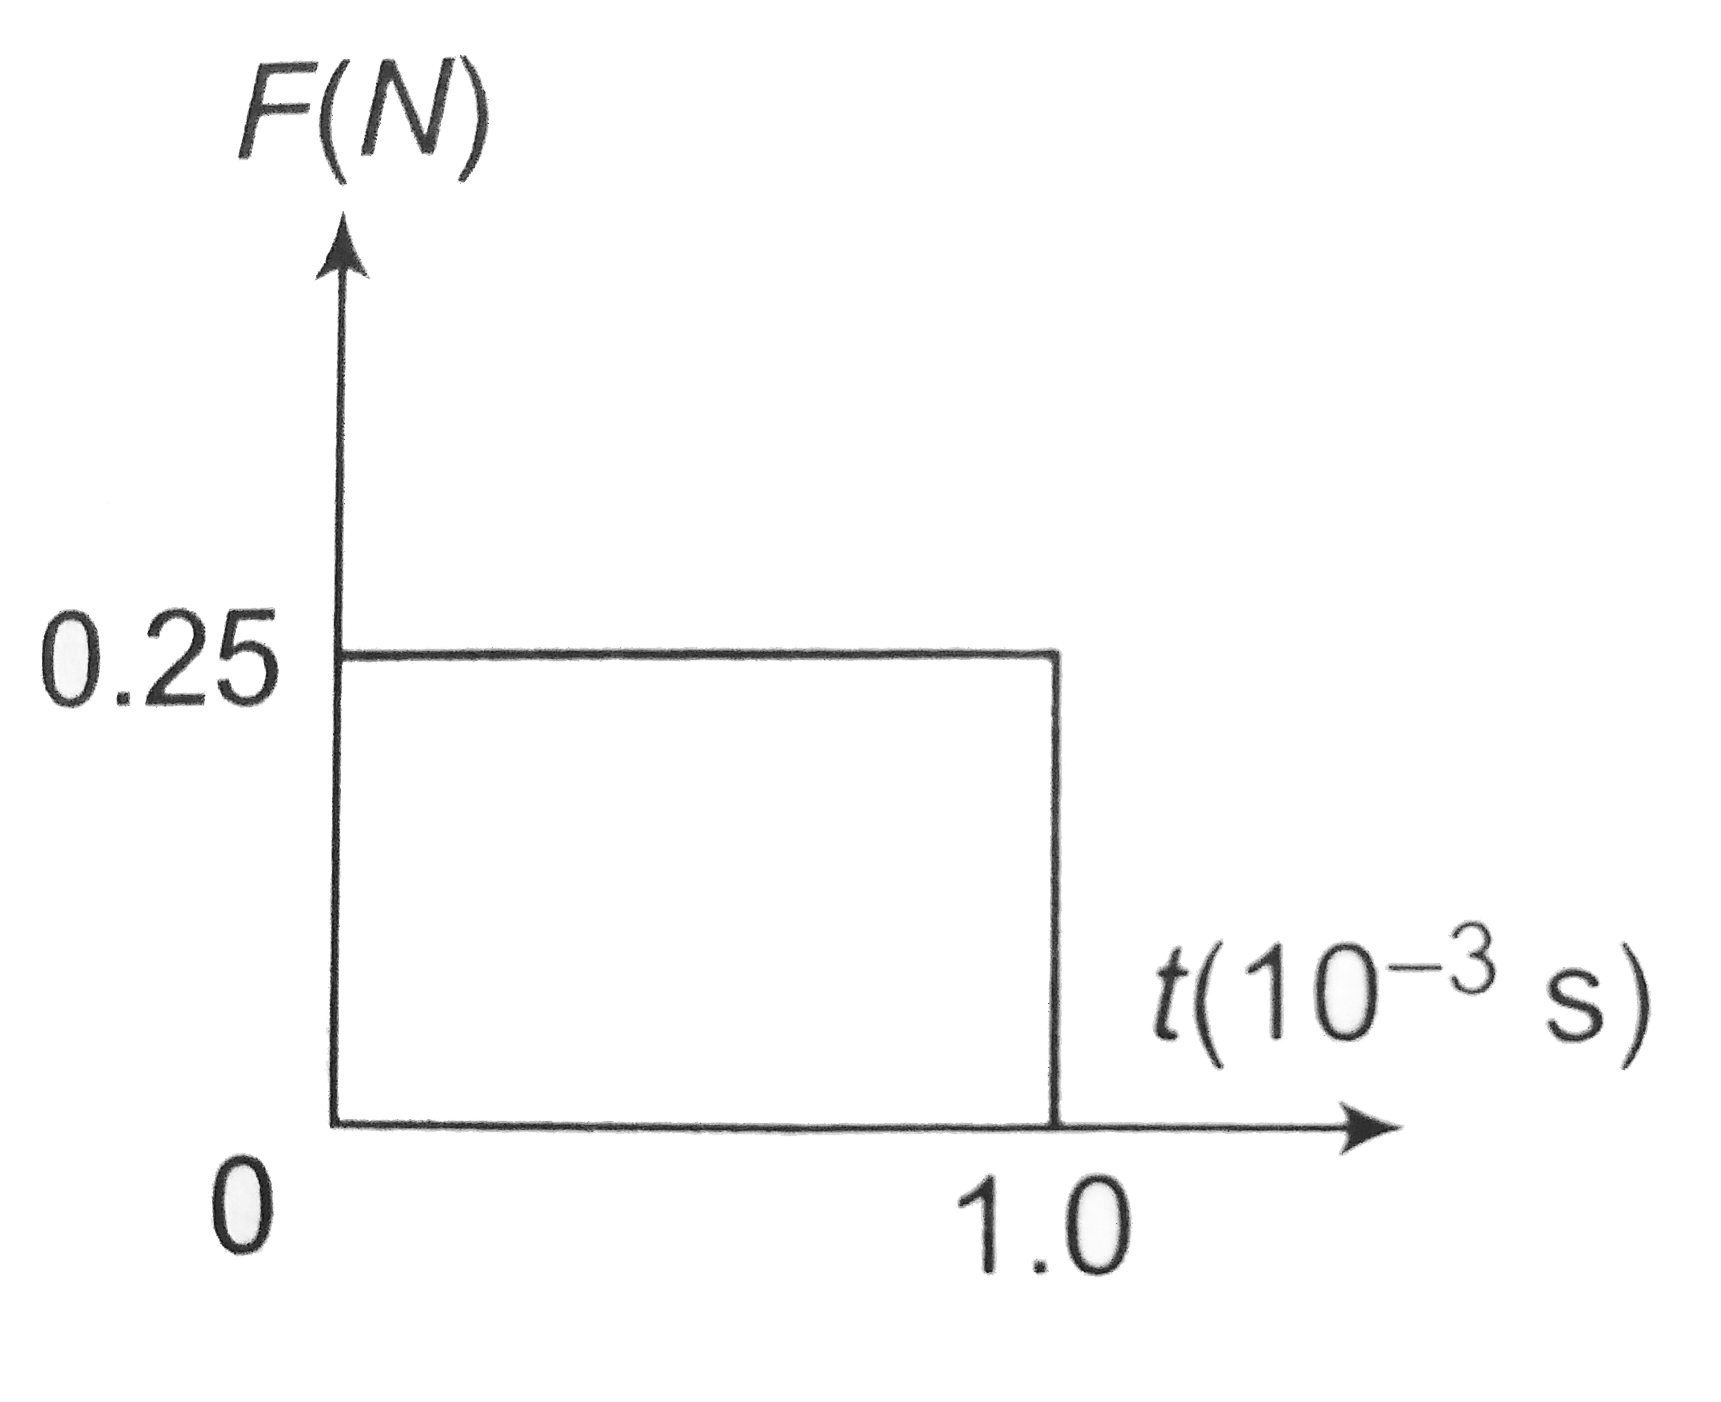
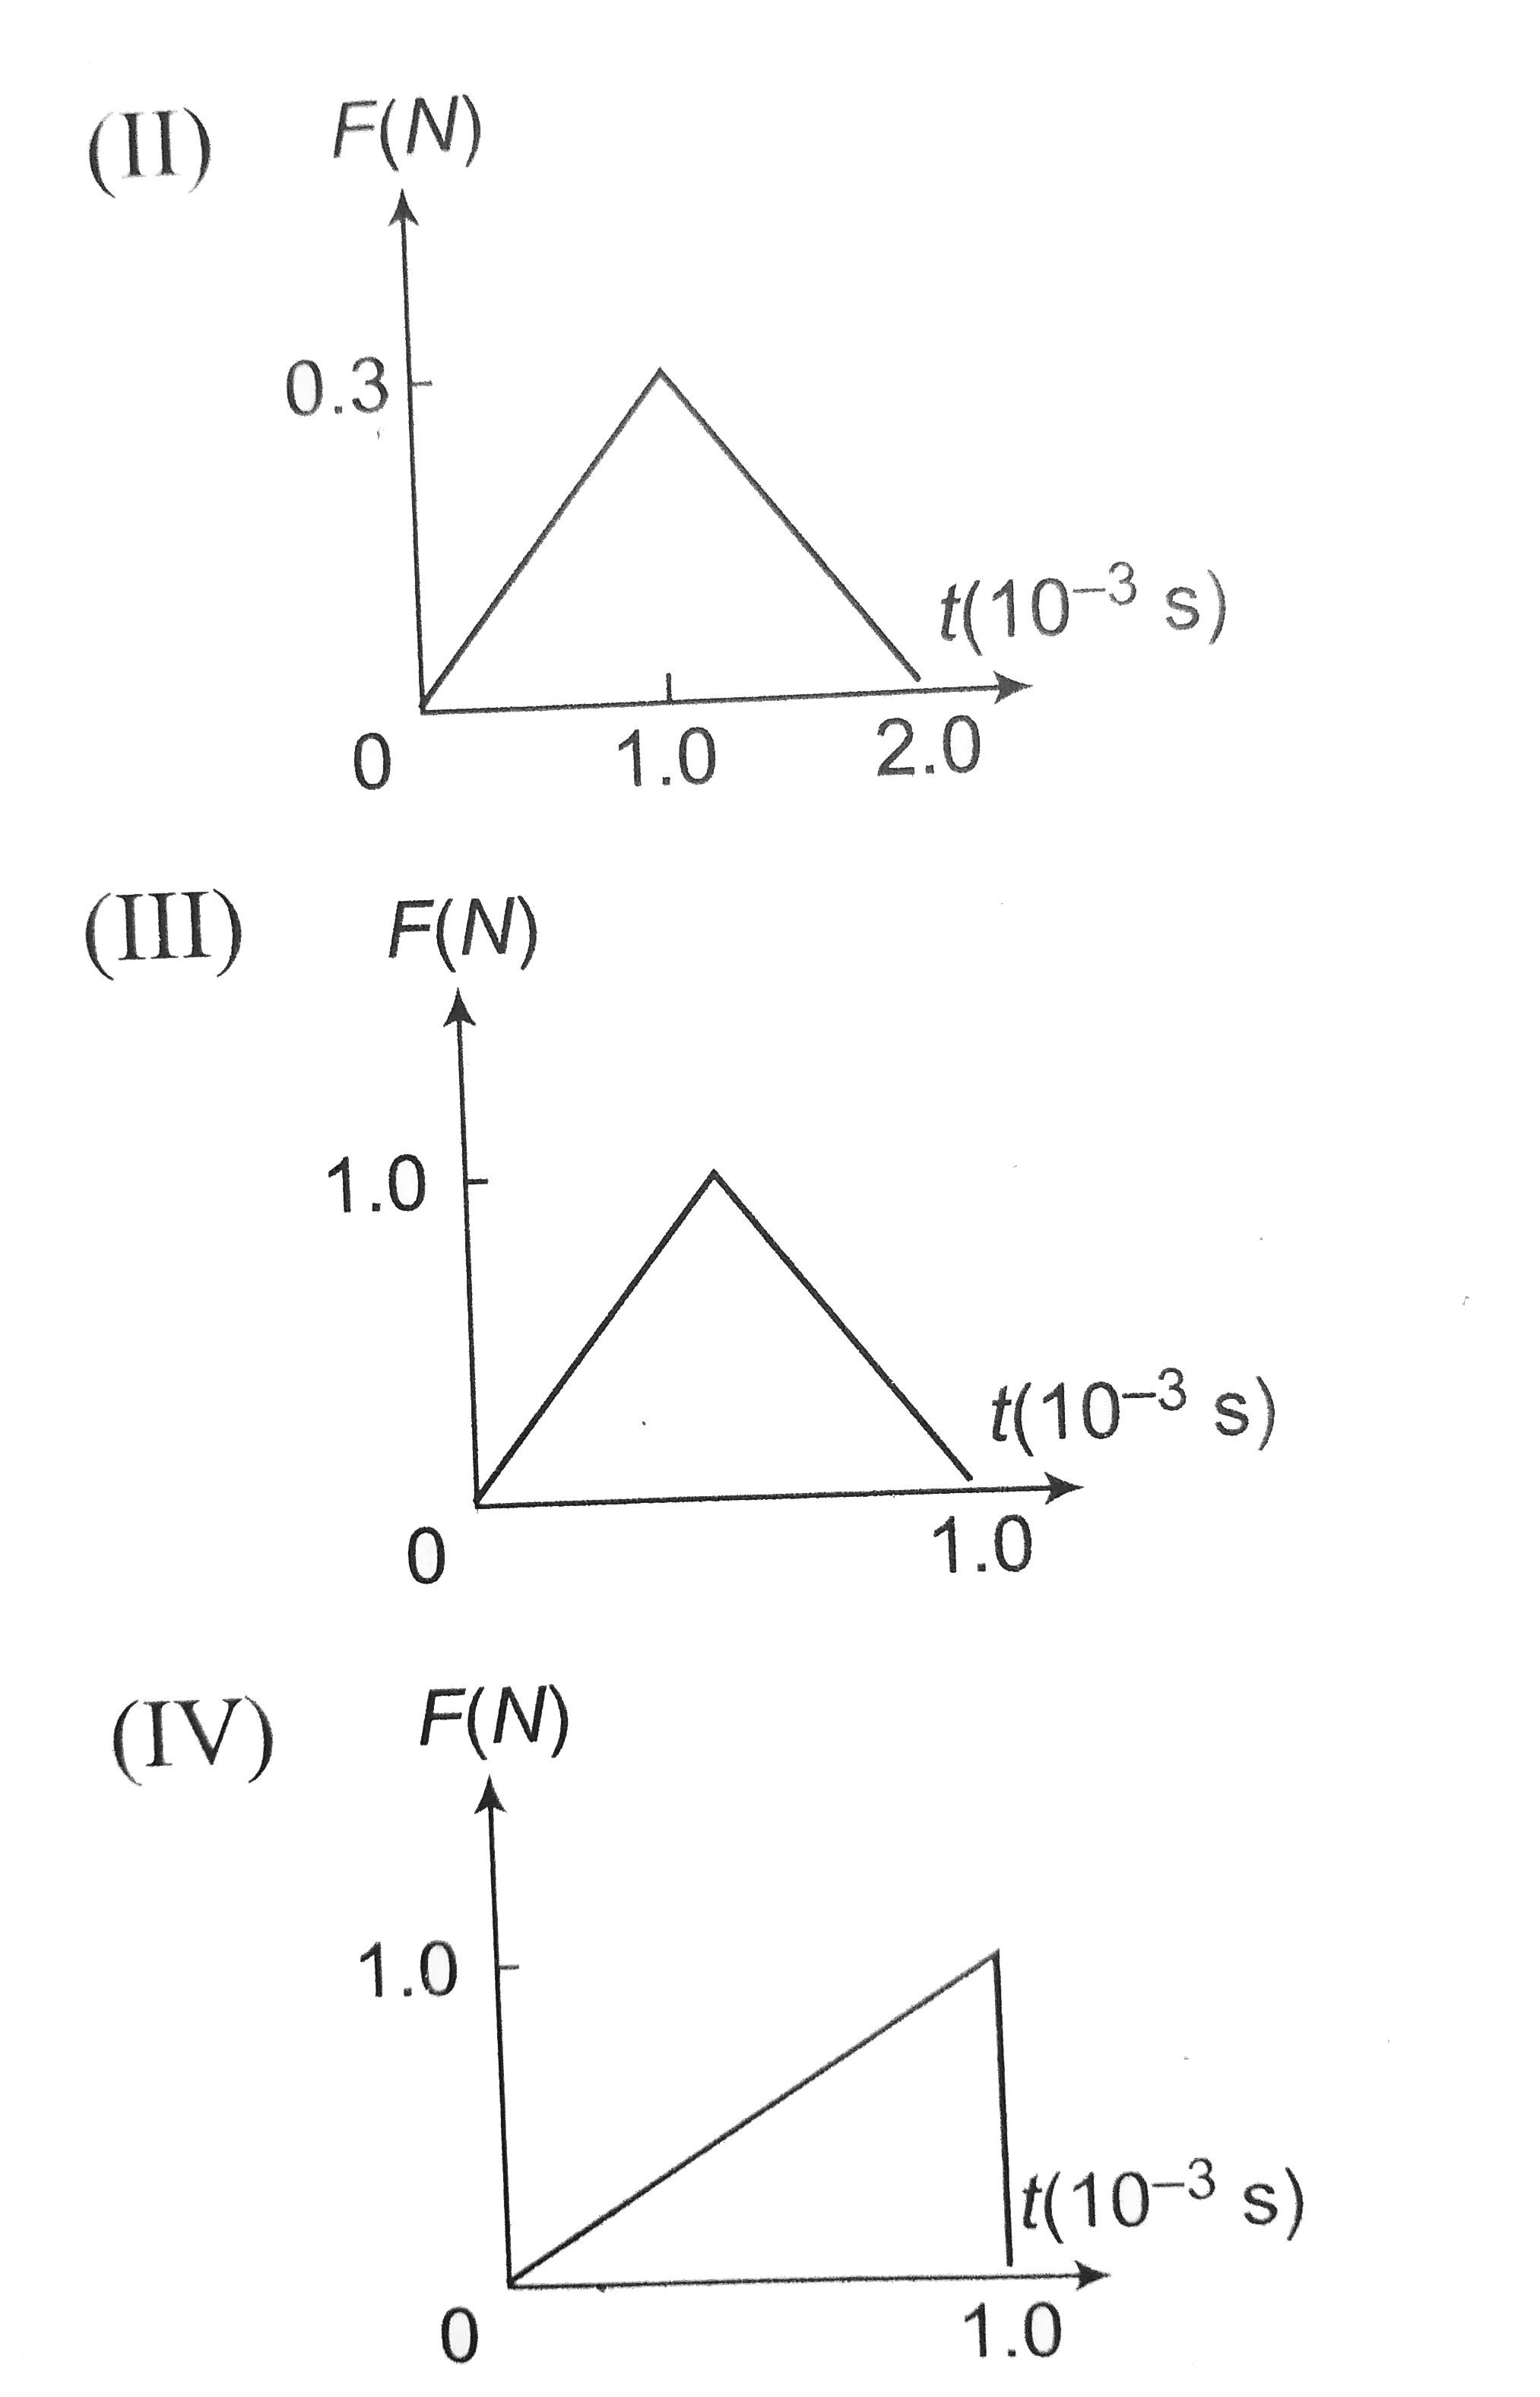
Figures I, II, III, and IV depict variation of force with time. The impulse is highest in the case of situations depicted. Figure(s).
 ,
,  AI and IIBIII and ICIII and IVDIV only
_E01_122_Q01.png)
A spherical ball is dropped in a long column of viscous liquid. Which of the following graphs represents the variation of-
(i). Gravitaional force with time
(ii). Viscous force with time
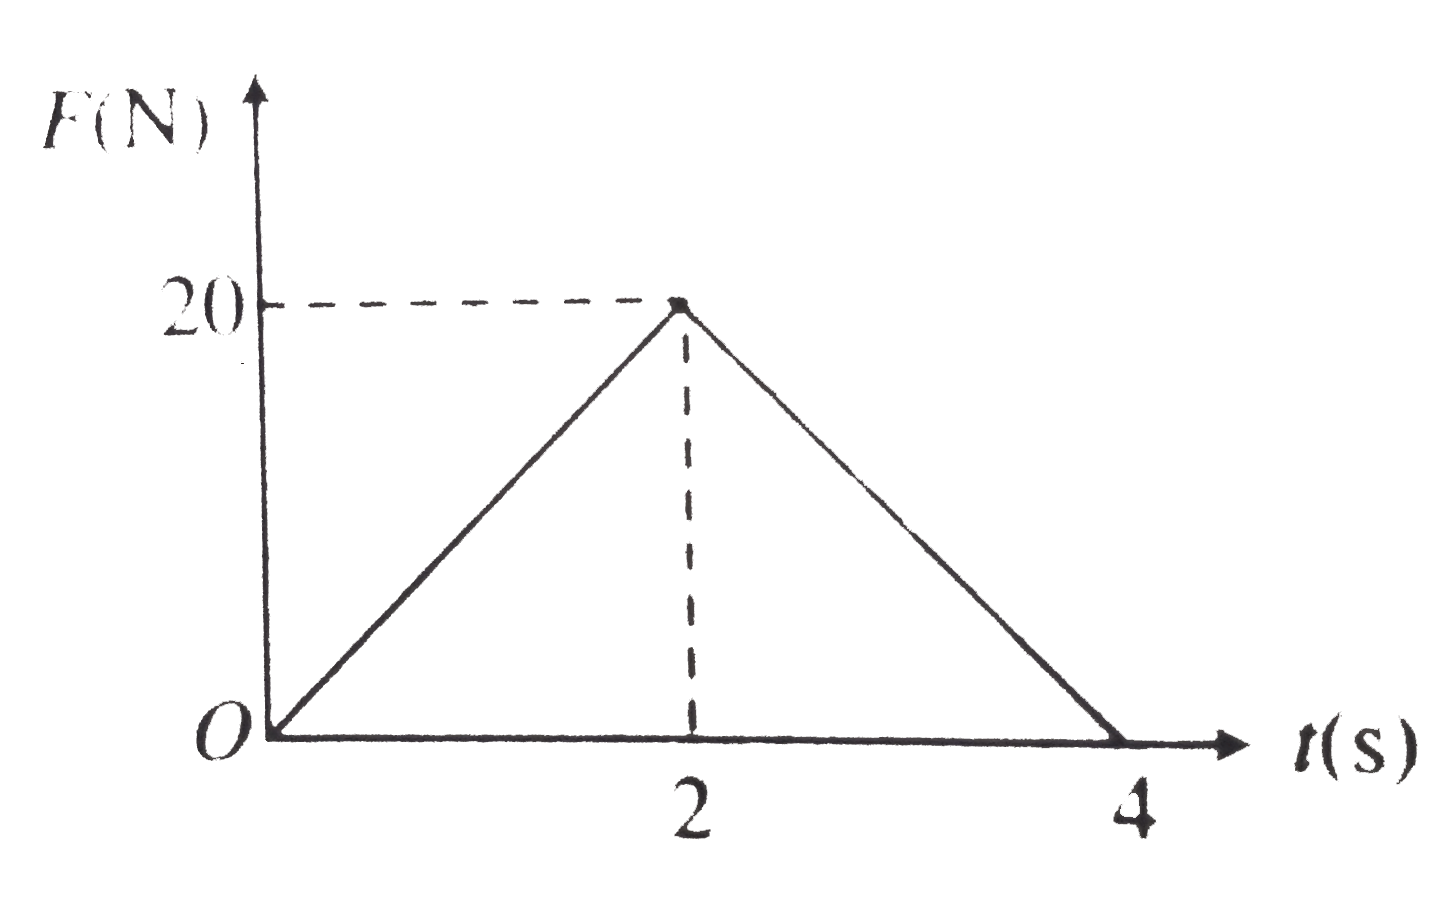
(iii). Net force acting on the ball with timeAQ, R, PBR, Q, PCP, Q, RDR, P, QFigure shows the variation of force acting on a boby with time. Assume the body to start from rest, the variation of its momentum with time is best represented by which plot?
 A
A B
B C
C D
D
The number of girl students in each class of co-ed. Middle school is depicted by the following pictograph: Class, No. of girls, = 4 girls I, Figure, II, Figure, III, Figure, IV, Figure, V, Figure, VI, Figure, VII, Figure, VIII, Figure, Observe the above pictograph and answer the following questions: Which class has the maximum number of girl students? Is the number of girls in class VI is less than the number of girls in class V? How many girls are there in VII class?
View SolutionFor a particle executing SHM, the displacement x is given by x=Acosωt. Identify the graph which represents the variation of potential energy (PE) as a function of time t and displacement x.
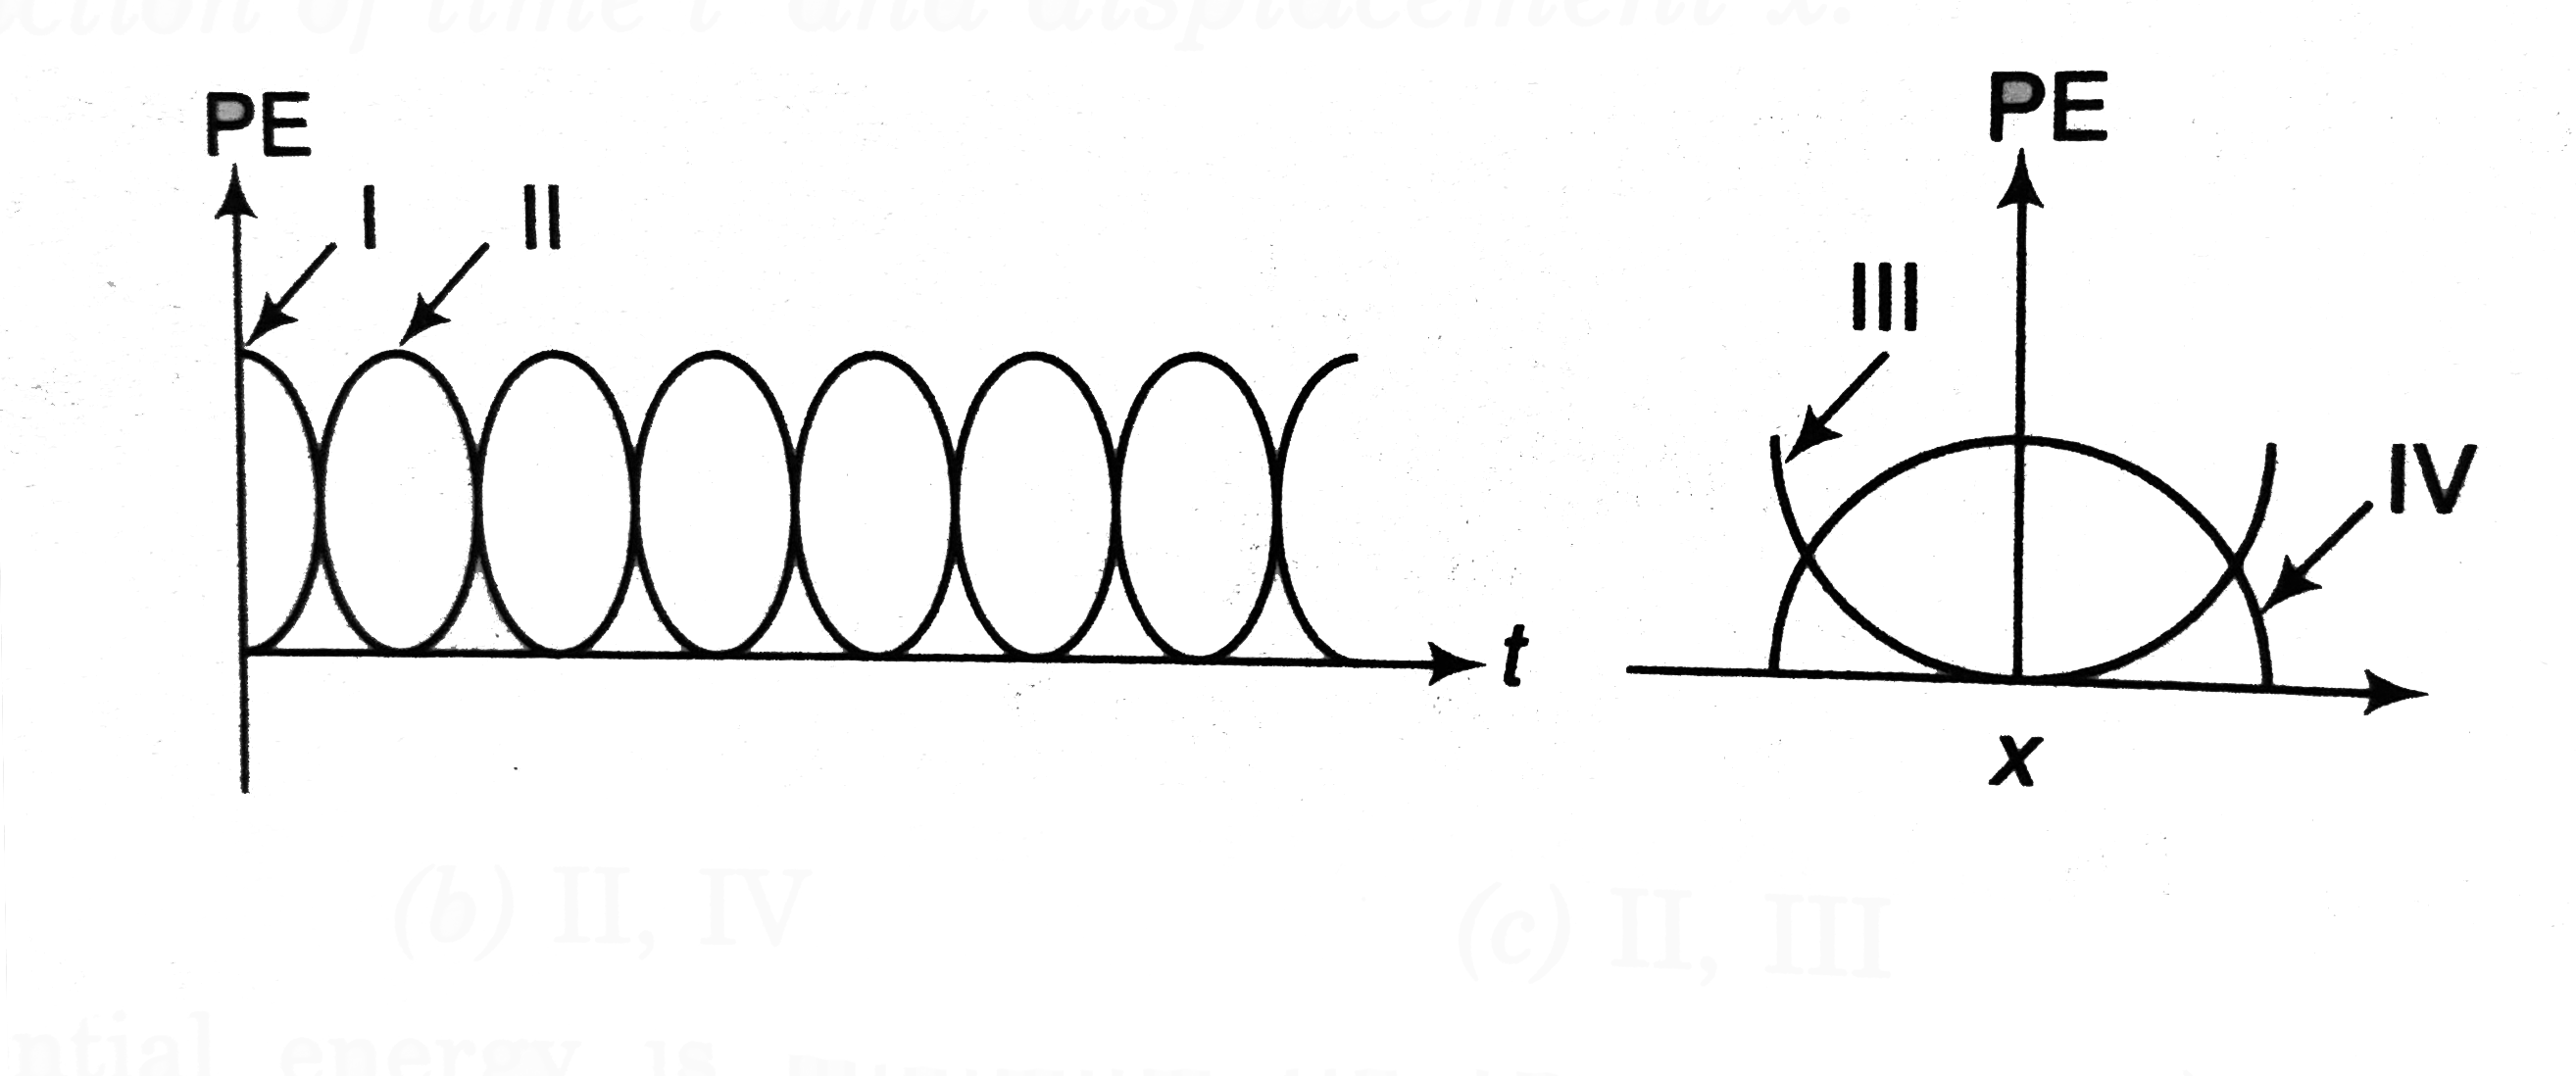
(a) I,III
(b) II,IV (c ) II,III
(d) I,IV
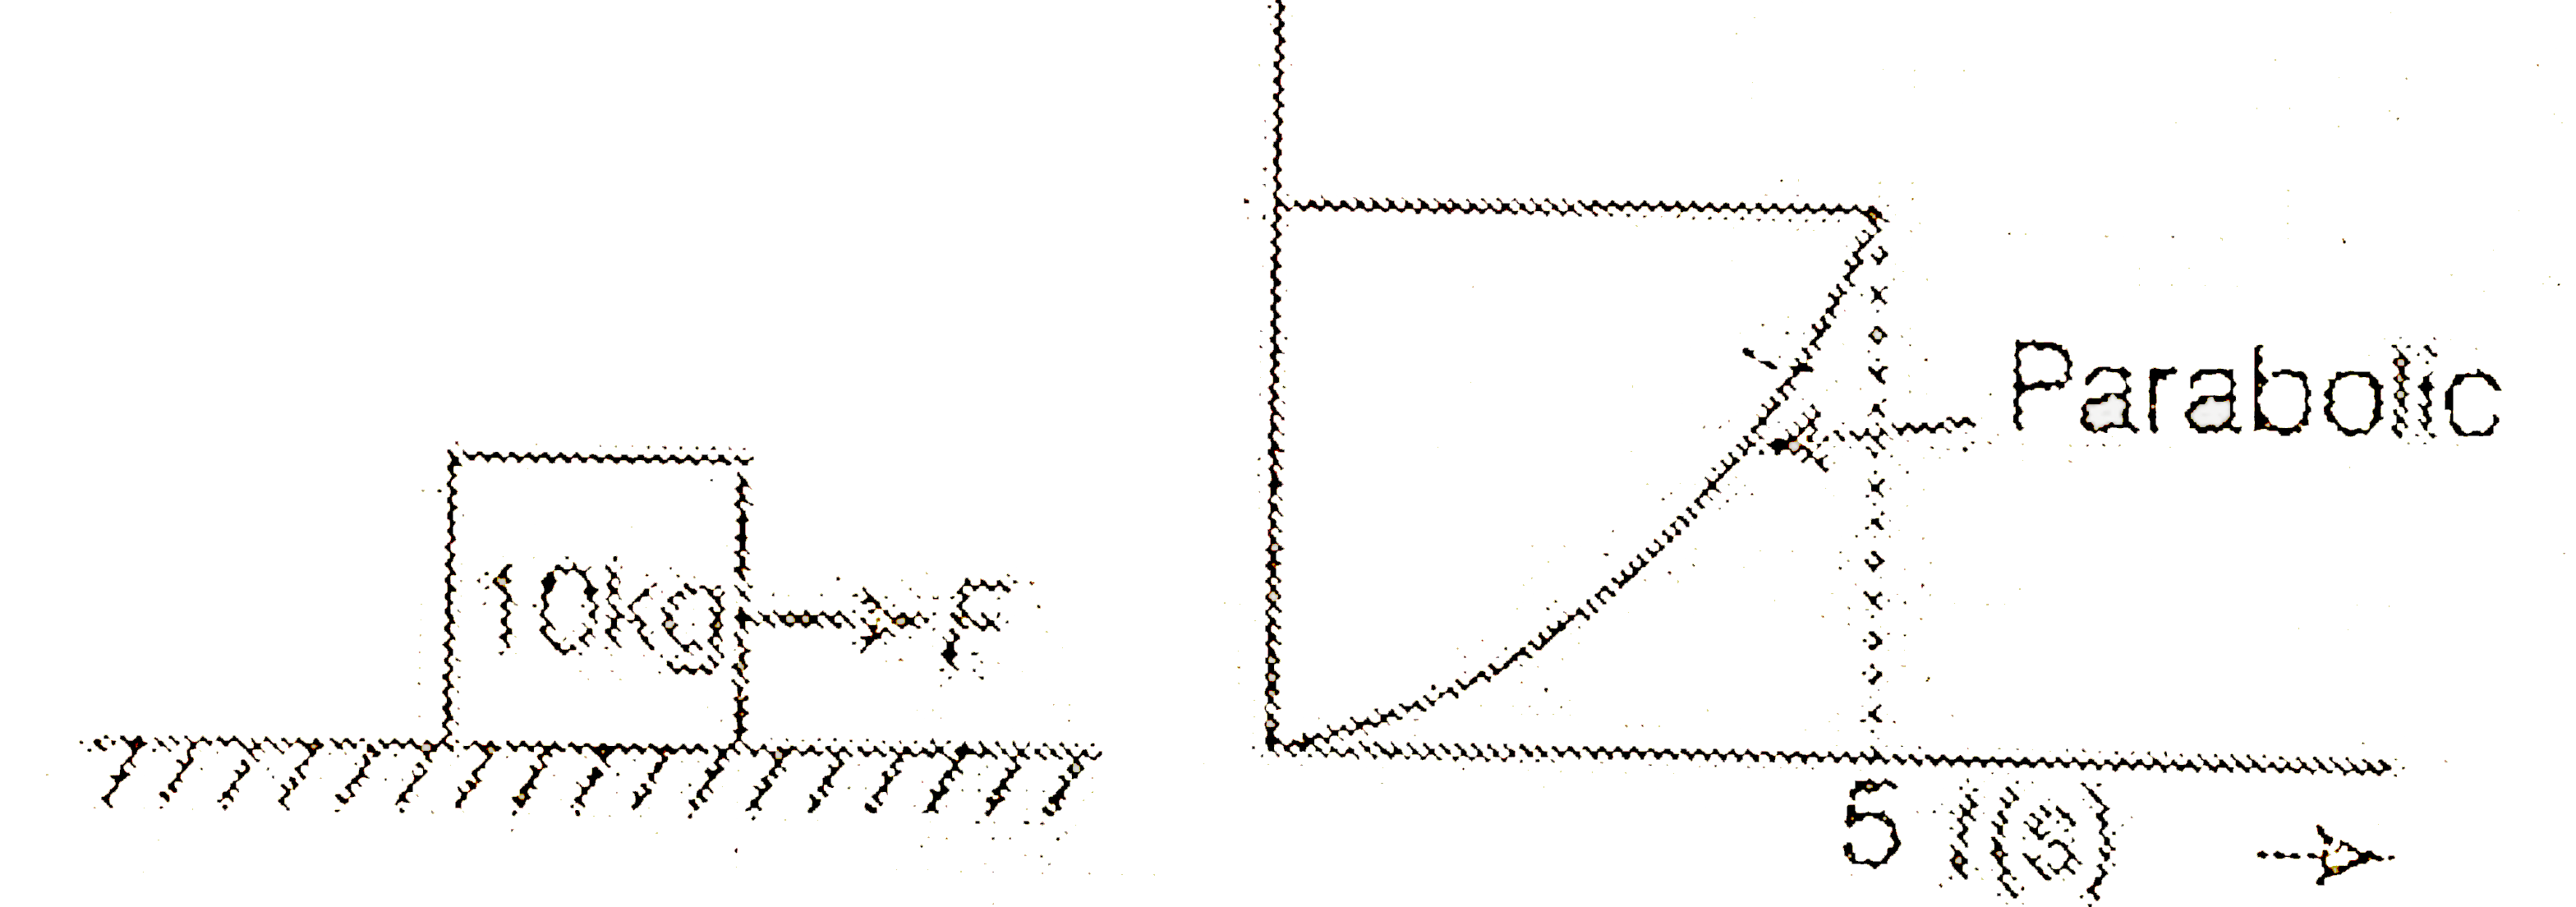
View SolutionA force F is applied to the initially, stationary cart. The variation of force with time is shown in the figure. The speed of cart at t = 5 s is
View SolutionA spherical ball is dropped in a long column of viscous liquid. Which of the following graphs represent the variation of
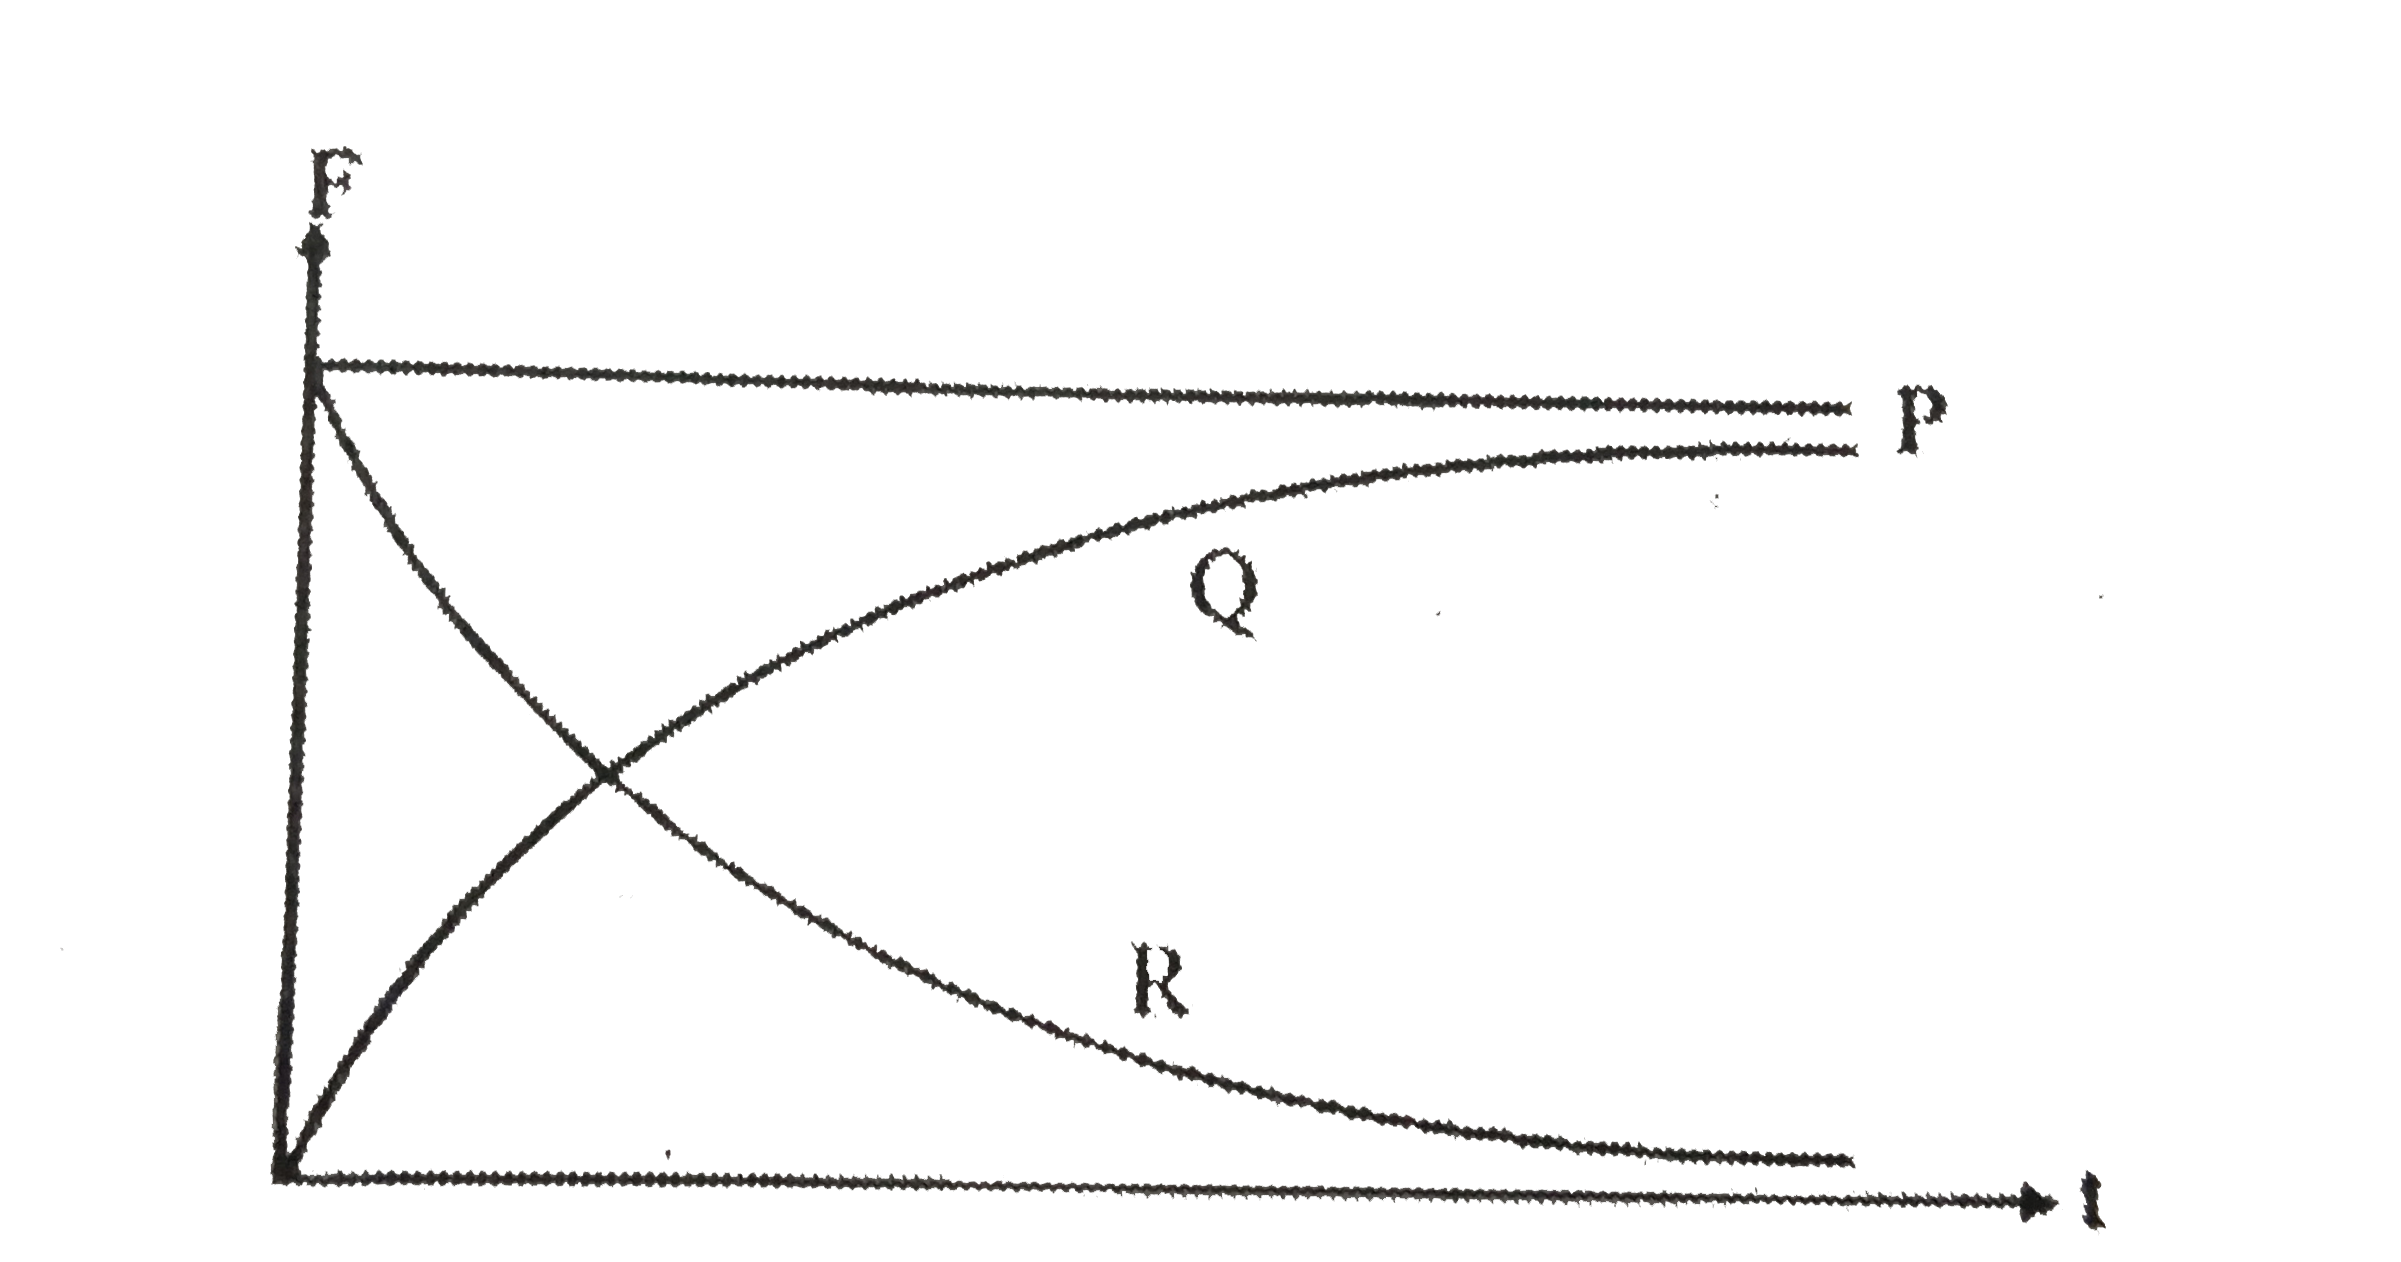
(l) gravitational force with time
(ii) viscous force with time
(iii) net force acting on the ball with time
View SolutionA spherical ball is dropped in a long column of viscous liquid. Which of the following graphs represent the variation of

(l) gravitational force with time
(ii) viscous force with time
(iii) net force acting on the ball with time
View Solution
