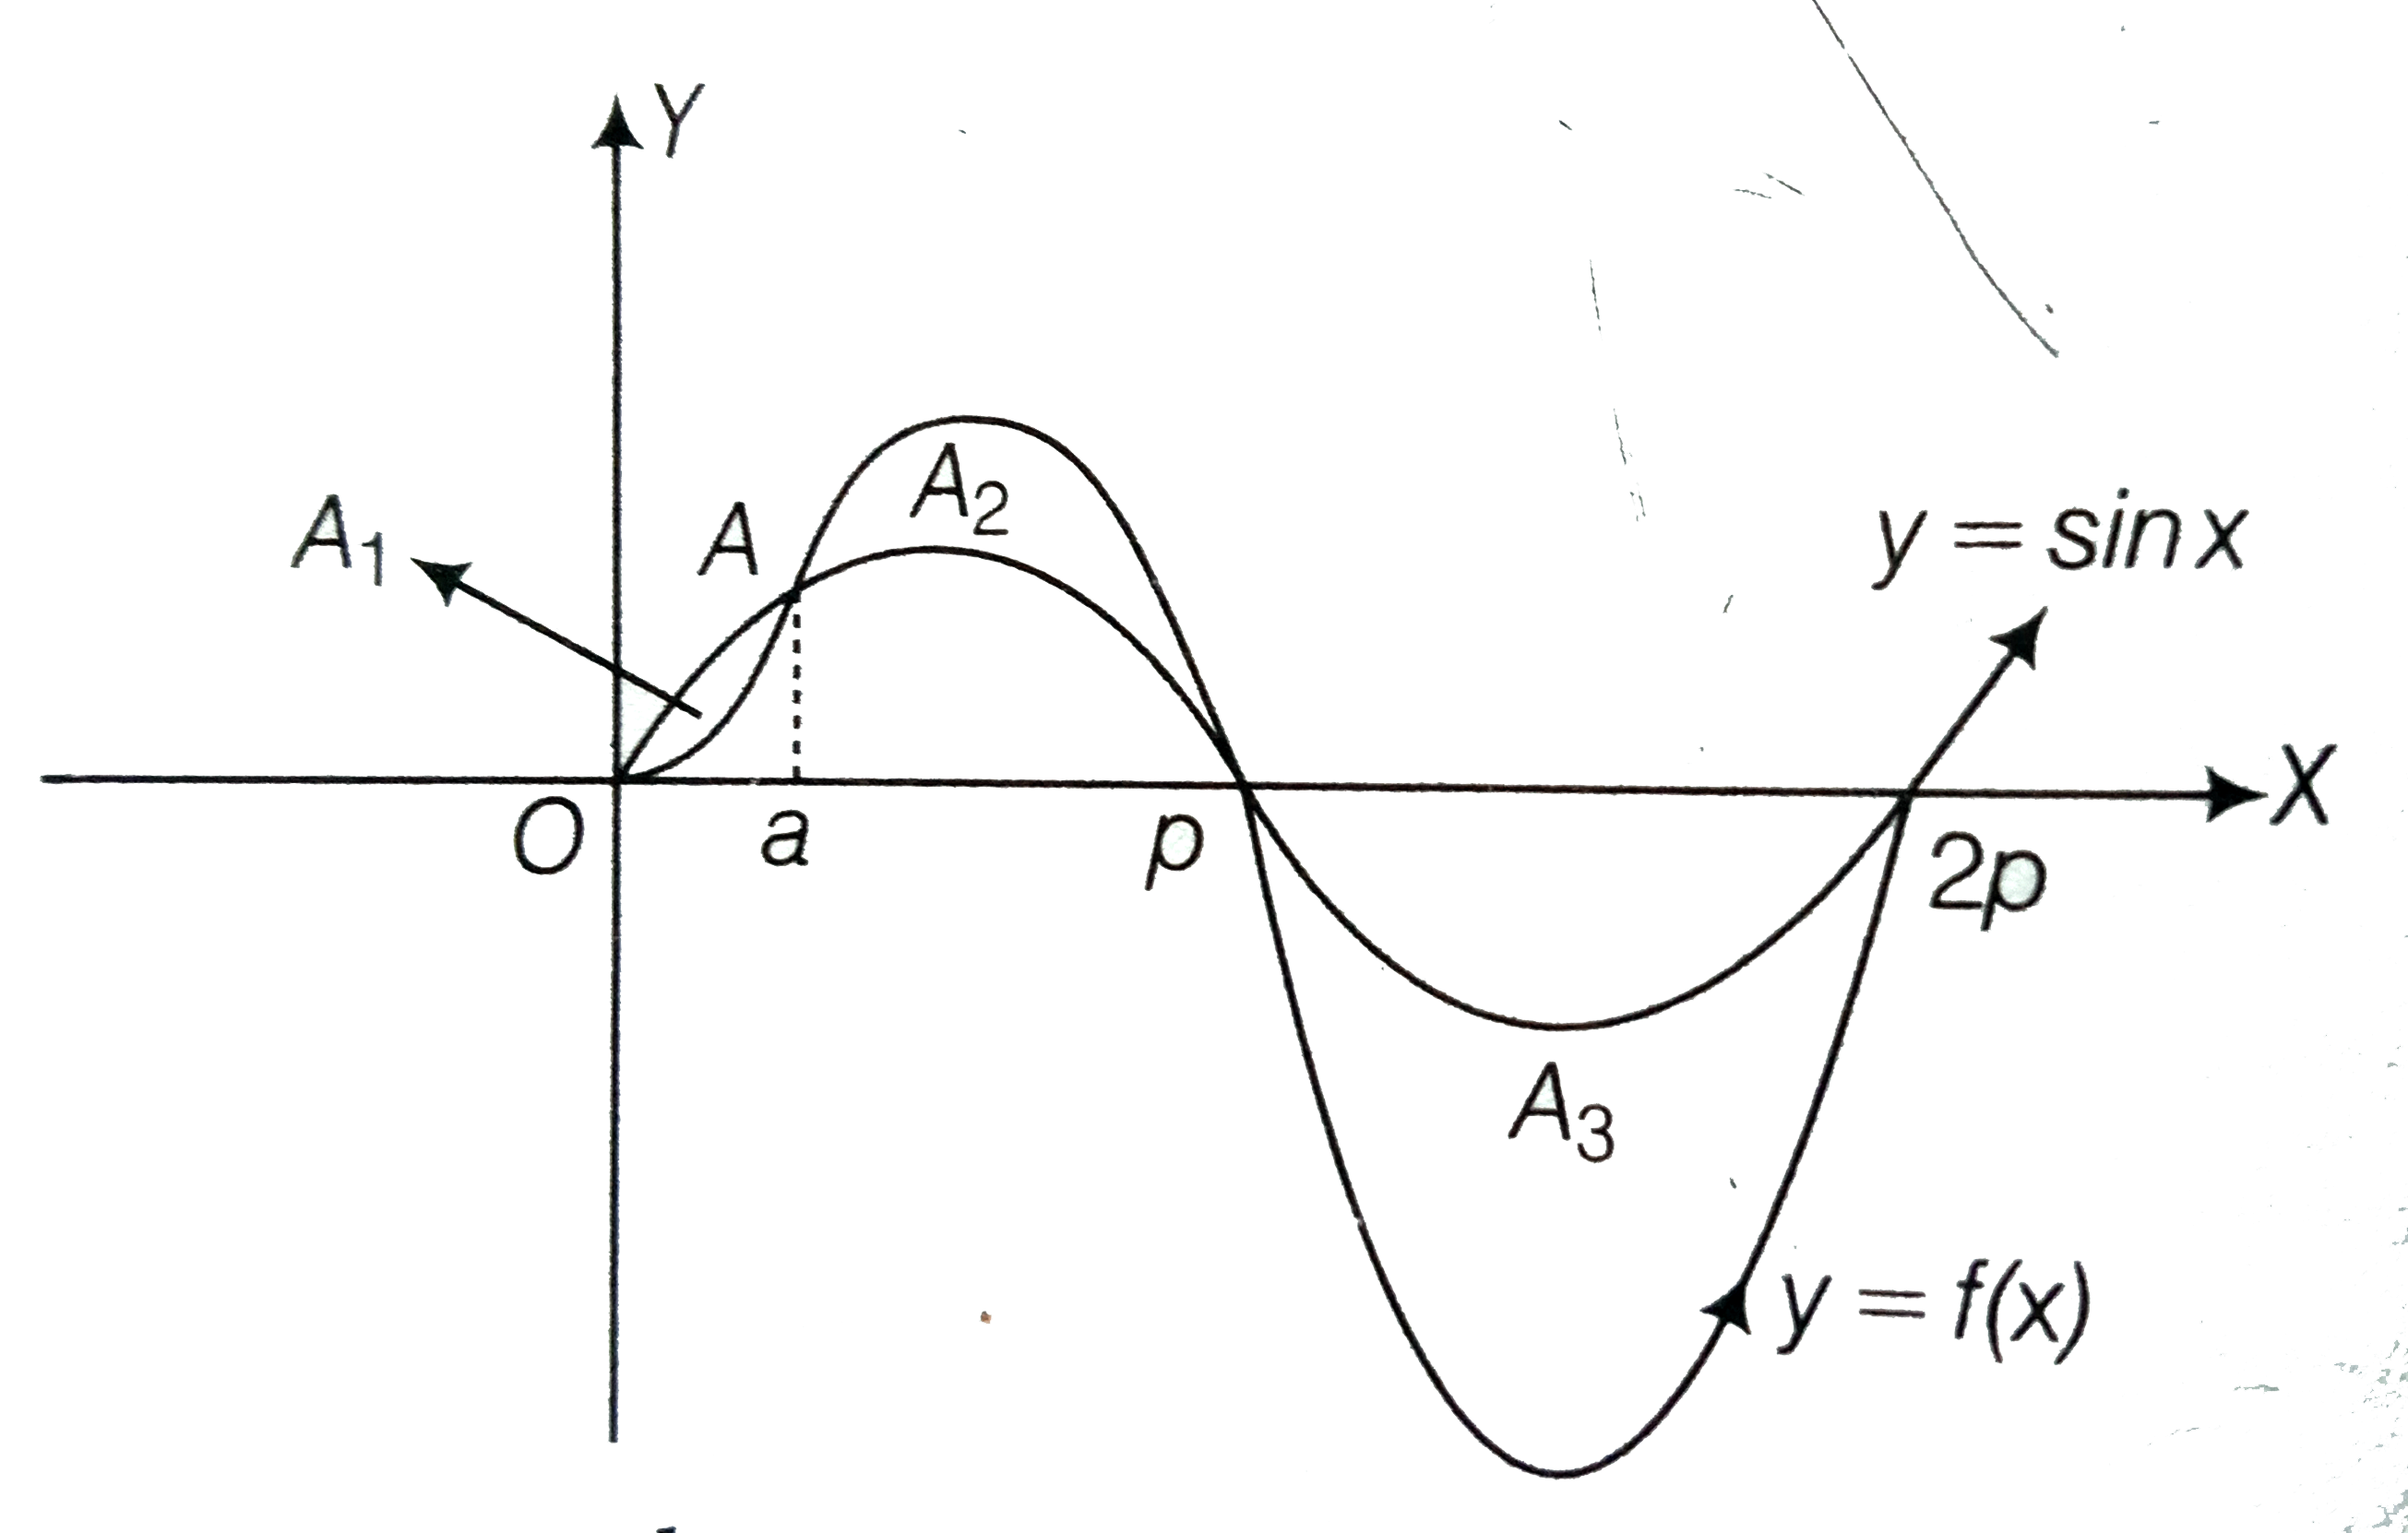
In the adjacent figure, the graphs of y=f(x)andy=sinx are given. The graphs of two equations intersect at P(a,f(a),Q(T,0)andR(2π,0). Let S1,S2andS3 represent areas bounded by the curves y−f(x)andy=sinx between x=0andx=a between x=aandx=π and between x=πandx=2π respectively. It is given that S=1−sint+(t−1)cost ∀t≤a represents the area bounded between y=f(x)andy=sinx.4.
Step by step video & image solution for In the adjacent figure, the graphs of y = f(x) and y = sinx are given. The graphs of two equations intersect at P(a, f(a),Q(T, 0) and R(2pi, 0). Let S_1, S_2 and S_3 represent areas bounded by the curves y-f(x) and y = sinx between x = 0 and x = a between x = a and x = pi and between x = pi and x=2pi respectively. It is given that S =1-sint + (t-1)cos t AA t le a represents the area bounded between y = f(x) and y =sinx.4. by Maths experts to help you in doubts & scoring excellent marks in Class 12 exams.
Updated on:21/07/2023Similar Questions
Knowledge Check
Area bounded by the curves y=xsinxand x-axis between x=0andx=2π is
A2πB3πC4πDNone of theseArea bounded by the curves y=xsinxand x-axis between x=0andx=2π is
A2πB3πC4πDNoneFind the area bounded by the curve y =sin x between x=0 and x=2π.
A1 sq unitB2 sq unitsC3 sq unitsD4 sq units
Find the area bounded by the curve y=cosxbetween x=0and x=2π.
View SolutionThe area bounded by the curves y=cosx and y=sinx between the ordinates x=0 and x=3π2 is
View SolutionIn the adjacent figure the graph of two function y=f(x) and y=sinx are given y=sin x intersects, y=f(x) at A(a,f(a)),B(π,0)andC(2π,0).
Ai(i=1,2,3) is the area bounded by the curves y=f(x)andy=sinx between x=0 and x=a,i=1 between x=a and x=π,i=2 between x=π and x=2π,i=3. If A1=1−sina+(a−1) cos a, determine the function f(x). Hence, determine a and A1. Also, calculate A2andA3.
 .
.
View SolutionThe area bounded by y=x|sinx| and x - axis between x=0,x=2π is
View SolutionThe area bounded by the curves y = cos x and y = sin x between the ordinates x = 0 and x=3π2, is
View Solution
