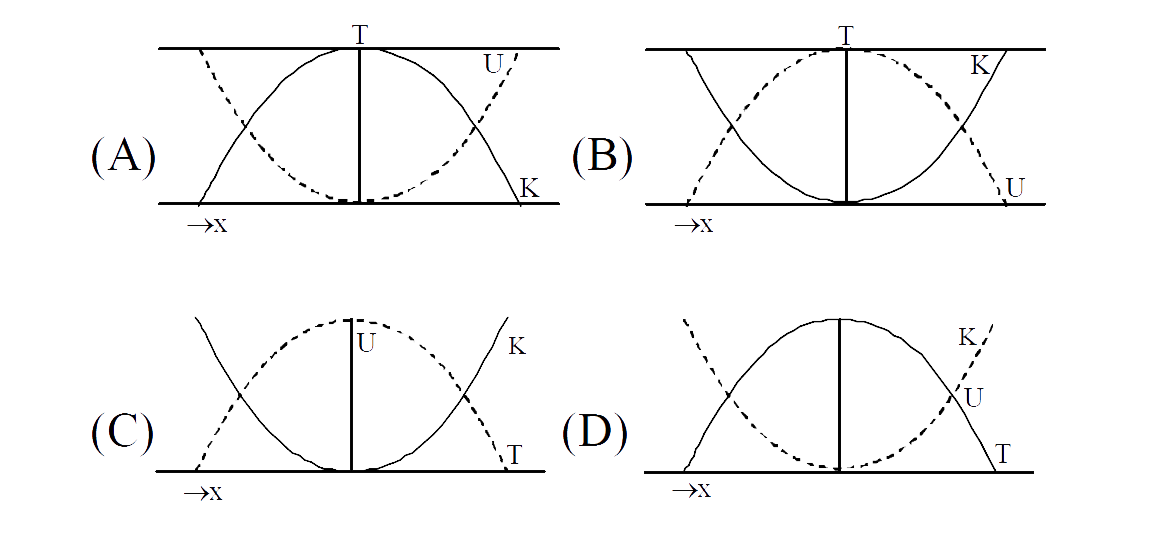
Draw a graph to show the variation of PE, KE and total energy of a simple harmonic oscillator with displacement.
To draw a graph showing the variation of potential energy (PE), kinetic energy (KE), and total energy (TE) of a simple harmonic oscillator with displacement (x), we will follow these steps:
Step 1: Understand the equations for PE and KE
- Potential Energy (PE): The potential energy of a simple harmonic oscillator is given by the formula:
PE=12kx2
or equivalently,
PE=12mω2x2
where k is the spring constant, m is the mass, and ω is the angular frequency.
- Kinetic Energy (KE): The kinetic energy is given by:
KE=12mv2
where v is the velocity. In terms of displacement, it can be expressed as:
KE=12mω2(a2−x2)
where a is the amplitude of the oscillation.
Step 2: Determine the maximum values
- At maximum displacement (x=±a), the potential energy is maximum:
PEmax=12mω2a2
and the kinetic energy is zero:
KE=0
- At the equilibrium position (x=0), the potential energy is zero:
PE=0
and the kinetic energy is maximum:
KEmax=12mω2a2
Step 3: Total Energy (TE)
- The total energy of the system is constant and is equal to the maximum potential energy or maximum kinetic energy:
TE=12mω2a2
Step 4: Plotting the graphs
1. Draw the axes: The horizontal axis represents displacement x (from −a to +a), and the vertical axis represents energy (PE, KE, TE).
2. Plot the Potential Energy (PE):
- The graph of PE is a parabola opening upwards, starting from the origin (0,0) at x=0 and reaching its maximum at x=±a.
3. Plot the Kinetic Energy (KE):
- The graph of KE is also a parabola, but it starts from its maximum value at x=0 and decreases to zero at x=±a.
4. Plot the Total Energy (TE):
- The total energy is a horizontal line across the graph at the value of 12mω2a2, indicating that it remains constant regardless of displacement.
Final Graph Representation
- The graph will show:
- The PE curve starting from (0,0) and peaking at (±a,12mω2a2).
- The KE curve starting from (0,12mω2a2) and touching the x-axis at (±a,0).
- A horizontal line representing the TE at 12mω2a2.
- Potential Energy (PE): The potential energy of a simple harmonic oscillator is given by the formula:
PE=12kx2
or equivalently,
PE=12mω2x2
where k is the spring constant, m is the mass, and ω is the angular frequency.
KE=12mv2
where v is the velocity. In terms of displacement, it can be expressed as:
KE=12mω2(a2−x2)
where a is the amplitude of the oscillation.
- At maximum displacement (x=±a), the potential energy is maximum:
PEmax=12mω2a2
and the kinetic energy is zero:
KE=0
PE=0
and the kinetic energy is maximum:
KEmax=12mω2a2
- The total energy of the system is constant and is equal to the maximum potential energy or maximum kinetic energy:
TE=12mω2a2
1. Draw the axes: The horizontal axis represents displacement x (from −a to +a), and the vertical axis represents energy (PE, KE, TE).
2. Plot the Potential Energy (PE):
- The graph of PE is a parabola opening upwards, starting from the origin (0,0) at x=0 and reaching its maximum at x=±a.
- The graph of KE is also a parabola, but it starts from its maximum value at x=0 and decreases to zero at x=±a.
- The total energy is a horizontal line across the graph at the value of 12mω2a2, indicating that it remains constant regardless of displacement.
- The graph will show:
- The PE curve starting from (0,0) and peaking at (±a,12mω2a2).
- The KE curve starting from (0,12mω2a2) and touching the x-axis at (±a,0).
- A horizontal line representing the TE at 12mω2a2.
Topper's Solved these Questions
Similar Questions
Draw a graph to show the the variation of P.E., K.E. and total eneryg of a simple harmonic oscillator with displacement .
View SolutionA particle is executing S.H.M. along a straight line. The graph showing the variation of kinetic, potential and total energy K, U and T respectively with displacement is -
 View Solution
Knowledge Check
- Question 1 - Select One
The phase of simple harmonic oscillator is
Aexpressed in timeBexpressed in angleCexpressed in distanceDa' and 'b' - Question 2 - Select One
Simple harmonic oscillations are
Aone dimensionalBthree dimensionalCtwo dimensionalDfour dimensional - Question 3 - Select One
In a simple harmonic oscillator, at the mean position
A(a) kinetic energy is minimum, potential energy is maximum.B(b) both kinetic and potential energies are maximum.C(c ) kinetic energy is maximum, potential energy is minimum.D(d) both kinetic and potenteal energies are minimum.
Draw a graph showing the variation of decay rate with number of active nuclei.
View SolutionIn. a simple harmonic oscillator, at the mean position
View SolutionA particle is executing S.H.M. along a straight line. The graph showing the variation of kinetic, potential and total energy K, U and T respectively with displacement is -
 View Solution
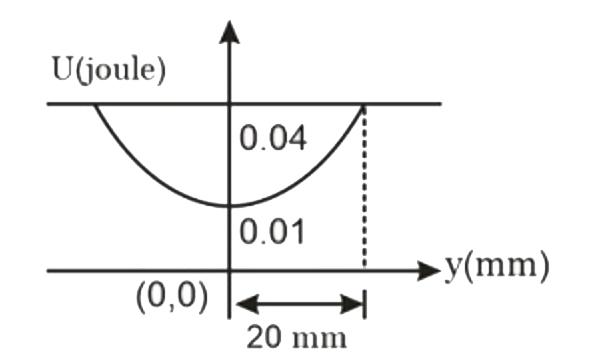
The variation of the potential energy of harmonic oscillator is as shown in the figure. The spring constant is
 View Solution
Frequency of variation of kinetic energy of a simple harmonic motion of frequency n is
View Solution

