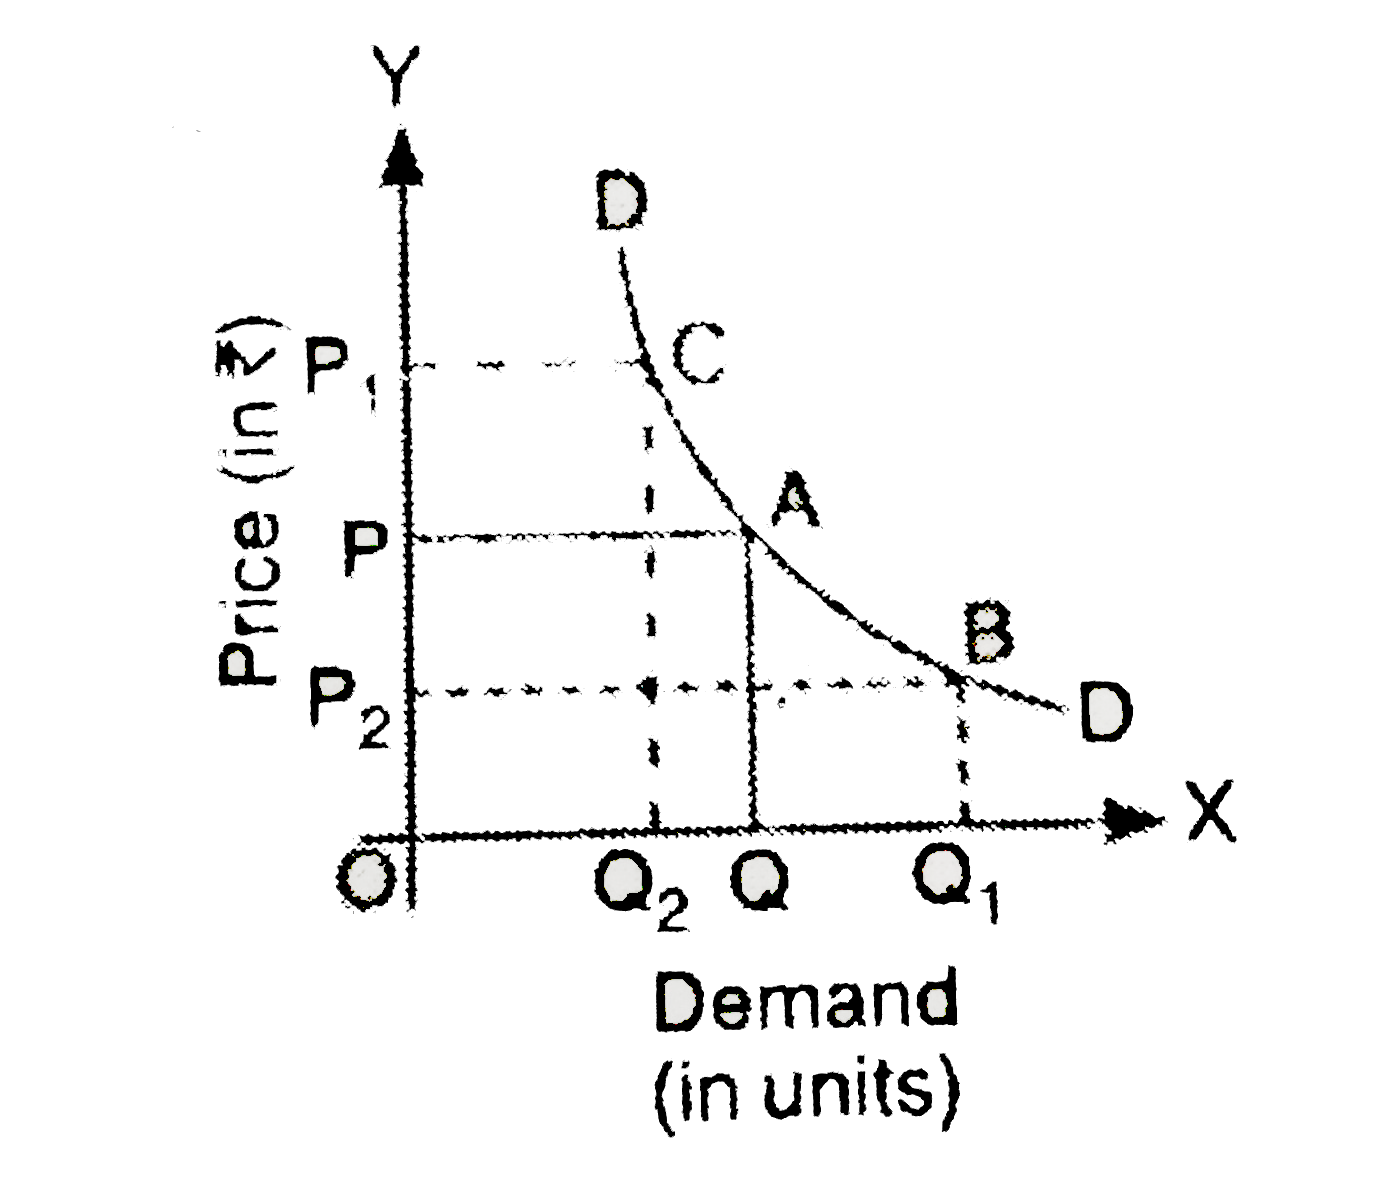
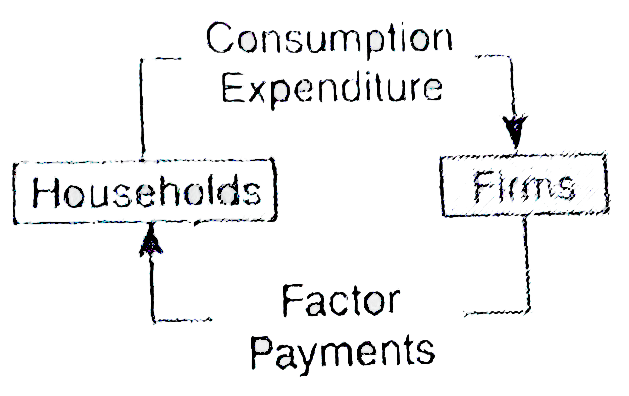
What does the following diagram represents ?
A
Change in Demand
B
Change in Quantity Demanded
C
Both (a) and (b)
D
Neither (a) or (b)
Text Solution
The correct Answer is:B
|
Topper's Solved these Questions
- DEMANDBOOK - SANDEEP GARGCHAPTER - DEMANDEXERCISE - Short Answer
22 Videos
- DEMANDBOOK - SANDEEP GARGCHAPTER - DEMANDEXERCISE - Long Answer
14 Videos
- DEMANDBOOK - SANDEEP GARGCHAPTER - DEMANDEXERCISE - Very Short
31 Videos
- COSTBOOK - SANDEEP GARGCHAPTER - COSTEXERCISE - Unsolved Practicals
42 Videos
- DEMAND AND ITS DETERMINANTSBOOK - SANDEEP GARGCHAPTER - DEMAND AND ITS DETERMINANTSEXERCISE - Model test paper 3
12 Videos
Similar Questions
Knowledge Check
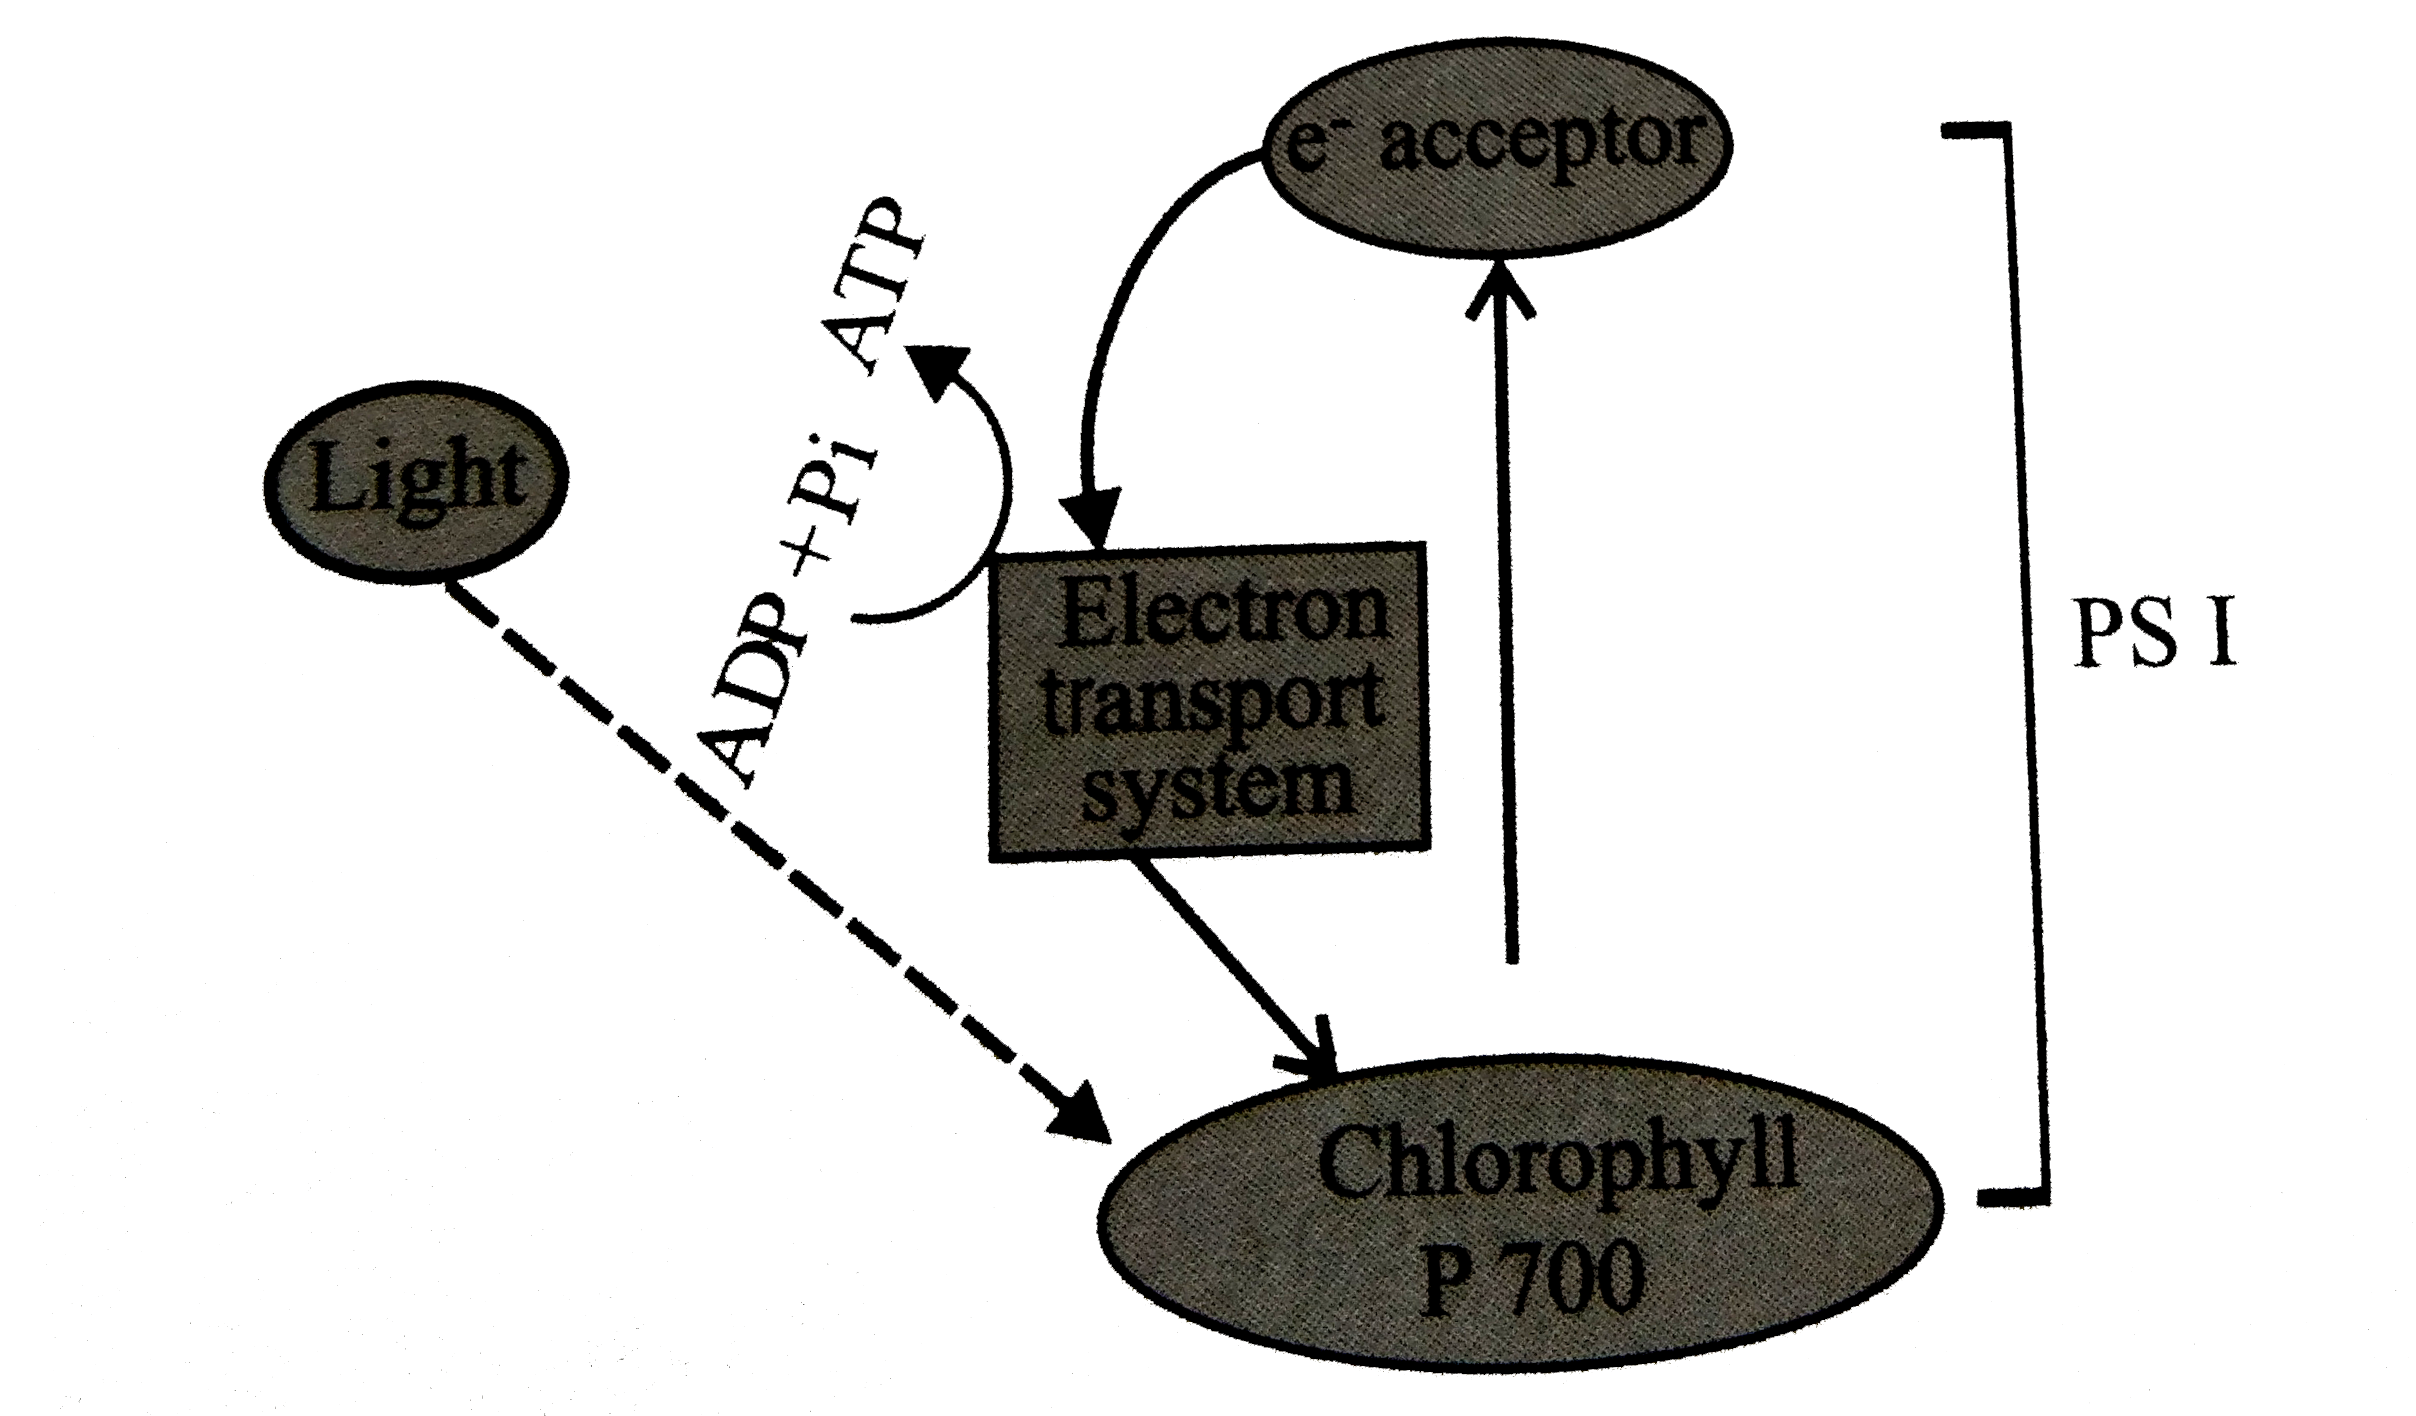
What does the following diagram show
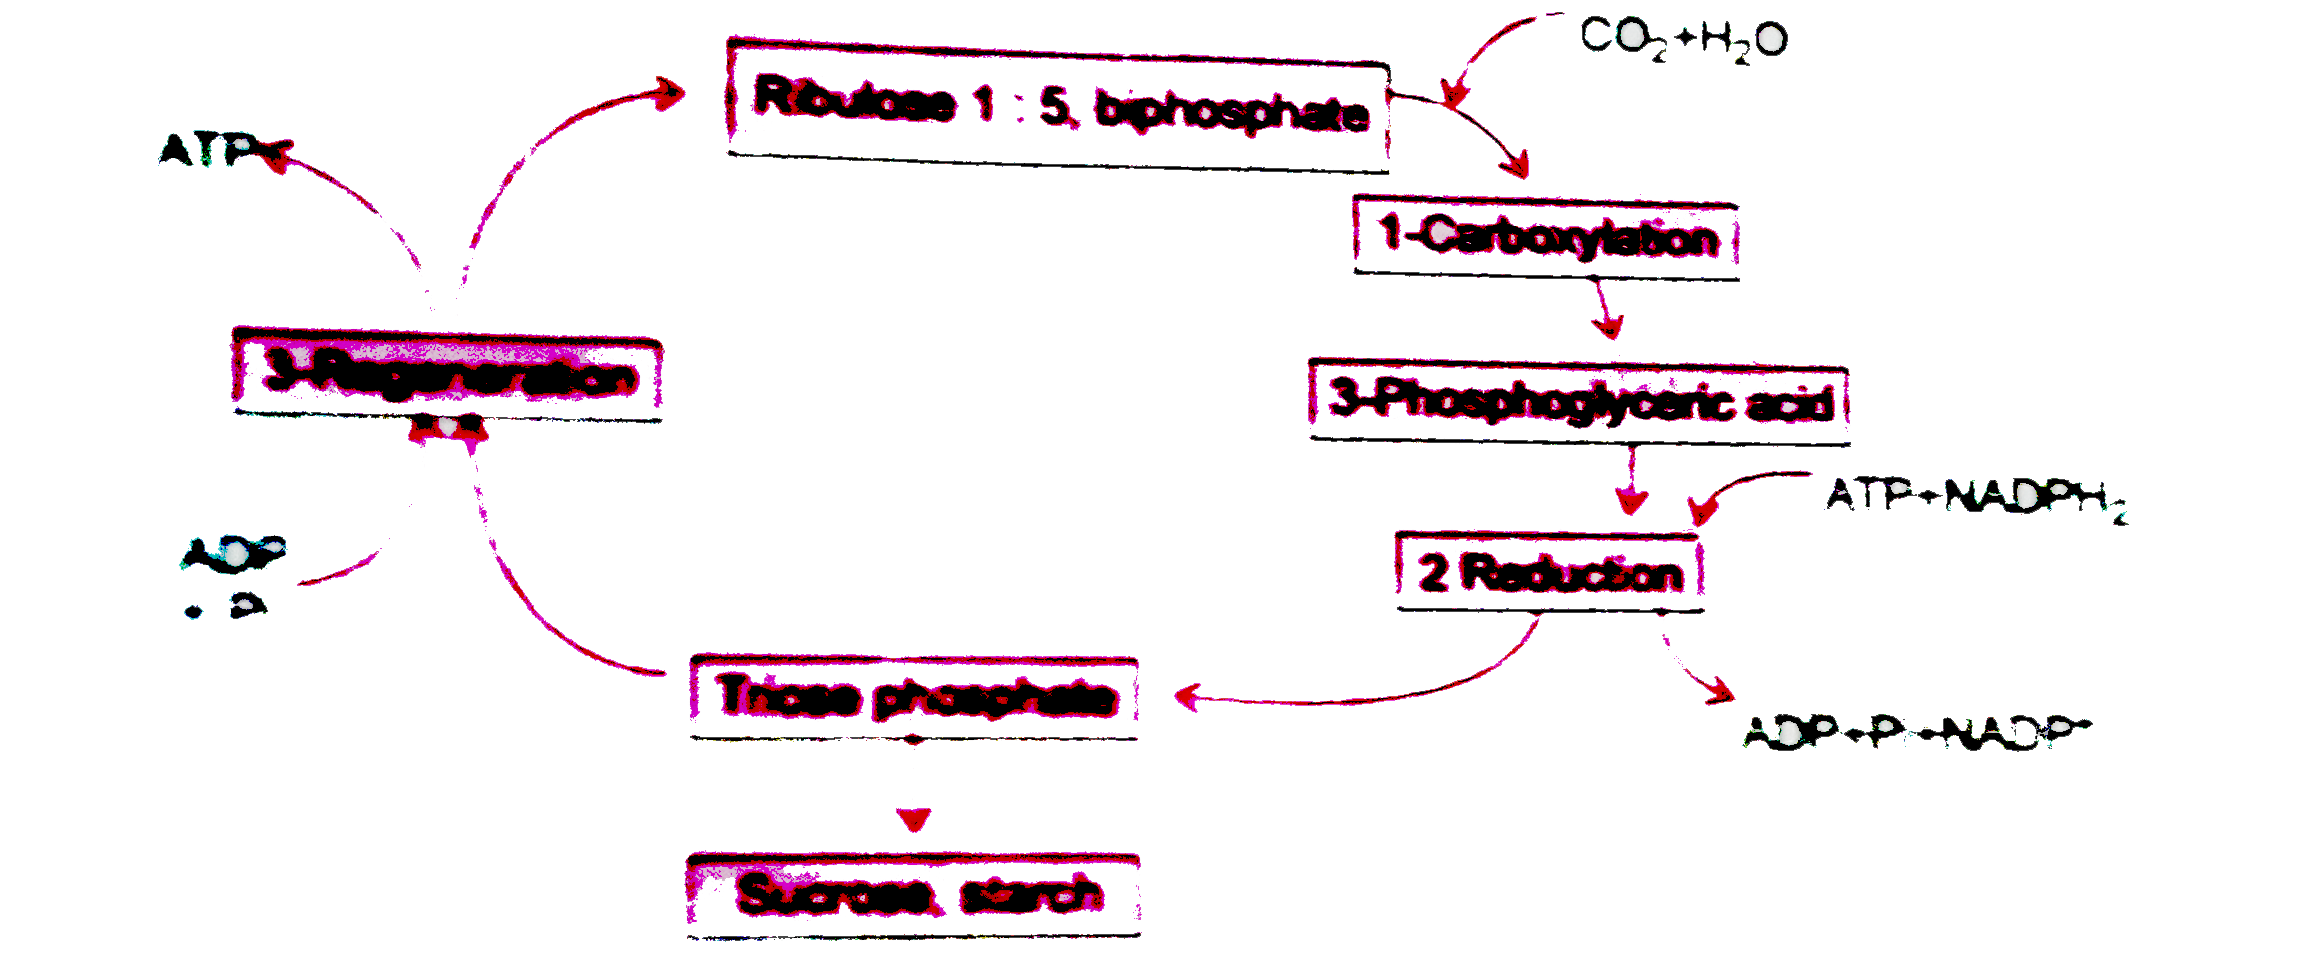 AKrebs cycleBCyclic photophosphorylationCCalvin cycleDNon-cyclic photophosphorylation.
What does the given diagram represent ?
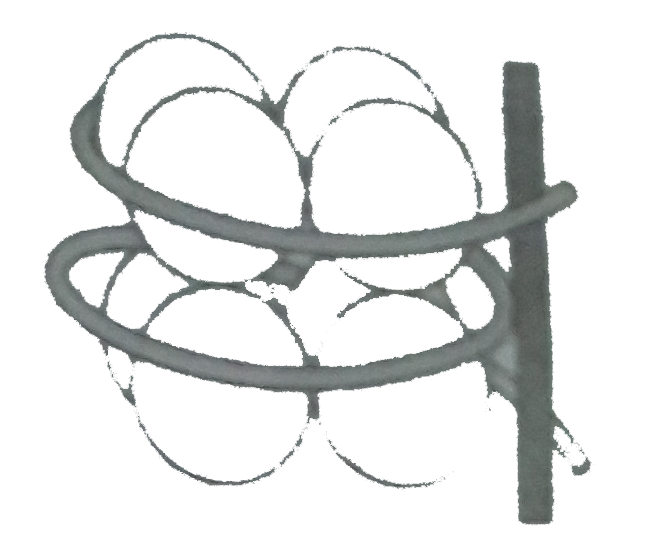 ANucleosomeBSpliceosomeCHistone complexDBoth (a) and (b)
What does the given diagram represent ?
 ANucleosomeBSpliceosomeCHistone complexDBoth (a) and (b)
Based on the below diagram, answer the following question.
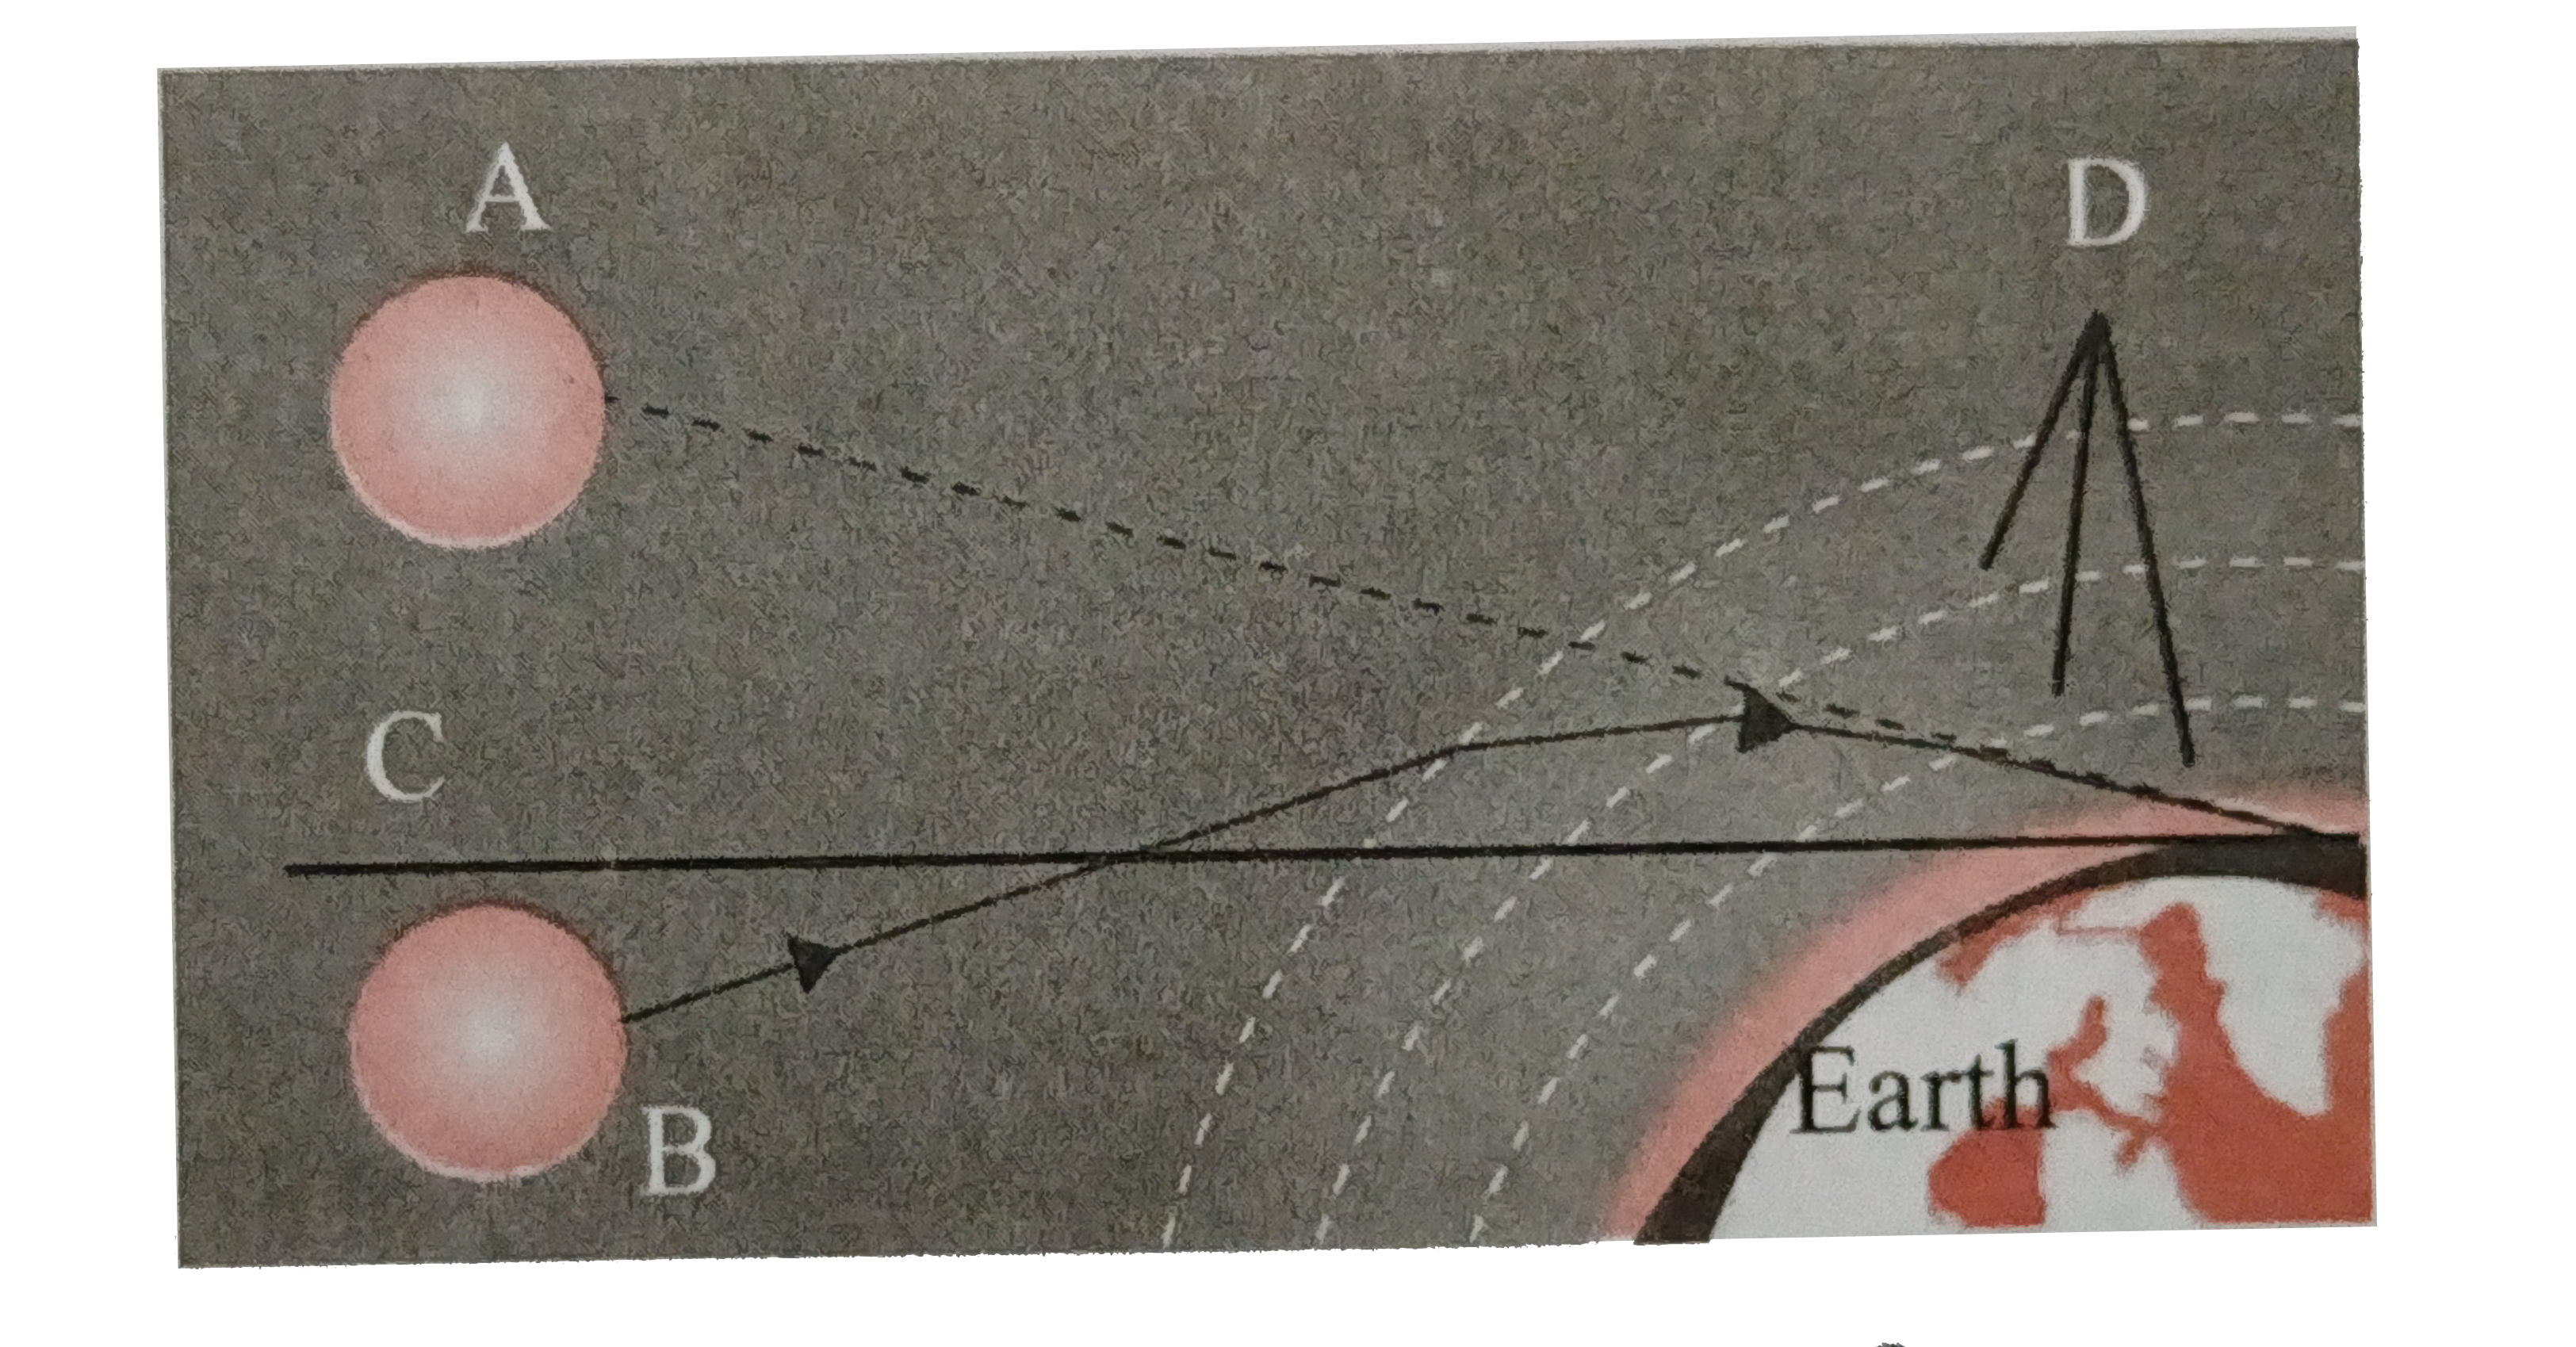
What does the above diagram represent?
View SolutionWhat does the the following represent ?
View SolutionWhat does the given diagram represent with respect to the various photosynthetic process?
View SolutionWhat does the given diagram represent with respect to the various photosynthetic process?

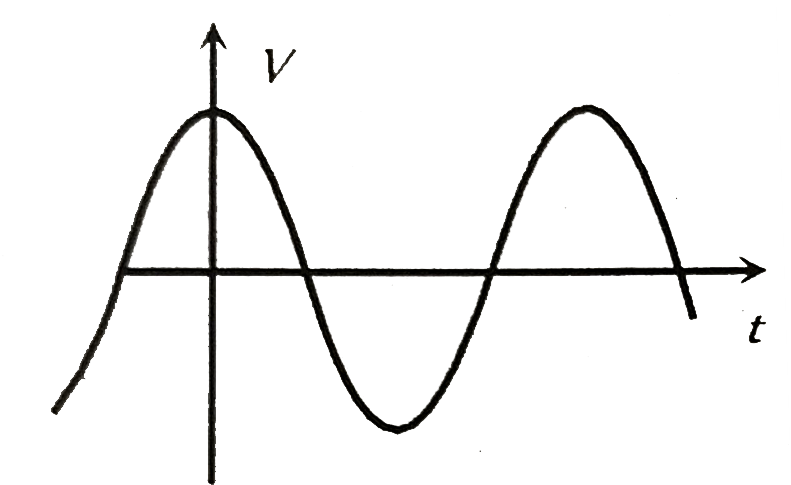
View SolutionThe voltage across a pure inductor is represented by the following diagram. Which one of the following diagrams will represent the current
View Solution
