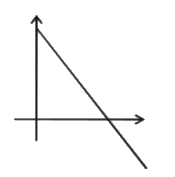
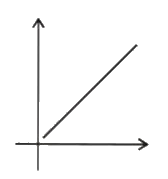
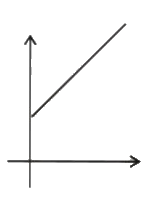
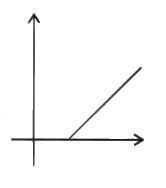
Draw graph for following equation :
v=v0−at


The correct Answer is:A
To draw the graph for the equation v=v0−at, we can follow these steps:
Step 1: Identify the Variables
In the equation v=v0−at:
- v is the final velocity.
- v0 is the initial velocity (y-intercept).
- a is the acceleration (slope).
- t is time (x-axis).
Step 2: Rearrange the Equation
The equation can be rearranged to fit the linear equation format y=mx+c:
- Here, v (final velocity) corresponds to y.
- −a (negative acceleration) corresponds to the slope m.
- v0 is the y-intercept c.
Thus, we can express it as:
v=−at+v0
Step 3: Determine the Intercept and Slope
- Y-Intercept (c): When t=0, v=v0. This means the graph will intercept the y-axis at v0.
- Slope (m): The slope is −a, which is negative if a is positive. This indicates that as time increases, the velocity decreases.
Step 4: Plot the Points
1. Point at t=0: The point is (0,v0).
2. Point at t=t1: Choose a value for t (for example, t1=v0a). Then calculate v:
v=v0−a⋅t1=v0−a⋅v0a=0
This gives the point (t1,0).
Step 5: Draw the Graph
- Draw a Cartesian plane with t on the x-axis and v on the y-axis.
- Plot the points (0,v0) and (t1,0).
- Draw a straight line connecting these two points. The line should slope downwards from left to right, indicating that velocity decreases over time.
Step 6: Label the Graph
- Label the y-axis as "Velocity (v)" and the x-axis as "Time (t)".
- Indicate the slope as negative and the intercept as v0.
Summary of the Graph
The graph of the equation v=v0−at is a straight line that starts at v0 on the y-axis and decreases linearly to zero as time increases, reflecting the negative acceleration.
---
In the equation v=v0−at:
- v is the final velocity.
- v0 is the initial velocity (y-intercept).
- a is the acceleration (slope).
- t is time (x-axis).
The equation can be rearranged to fit the linear equation format y=mx+c:
- Here, v (final velocity) corresponds to y.
- −a (negative acceleration) corresponds to the slope m.
- v0 is the y-intercept c.
v=−at+v0
- Y-Intercept (c): When t=0, v=v0. This means the graph will intercept the y-axis at v0.
- Slope (m): The slope is −a, which is negative if a is positive. This indicates that as time increases, the velocity decreases.
1. Point at t=0: The point is (0,v0).
2. Point at t=t1: Choose a value for t (for example, t1=v0a). Then calculate v:
v=v0−a⋅t1=v0−a⋅v0a=0
This gives the point (t1,0).
- Draw a Cartesian plane with t on the x-axis and v on the y-axis.
- Plot the points (0,v0) and (t1,0).
- Draw a straight line connecting these two points. The line should slope downwards from left to right, indicating that velocity decreases over time.
- Label the y-axis as "Velocity (v)" and the x-axis as "Time (t)".
- Indicate the slope as negative and the intercept as v0.
The graph of the equation v=v0−at is a straight line that starts at v0 on the y-axis and decreases linearly to zero as time increases, reflecting the negative acceleration.
Topper's Solved these Questions
- UNITS AND DIMENSIONS, BASIC MATHEMATICS BOOK - MOTIONCHAPTER - UNITS AND DIMENSIONS, BASIC MATHEMATICS EXERCISE - Exercise - 1 (Objective Problems) (SECTION - D :- ERRORS )
19 Videos
- UNITS AND DIMENSIONS, BASIC MATHEMATICS BOOK - MOTIONCHAPTER - UNITS AND DIMENSIONS, BASIC MATHEMATICS EXERCISE - Exercise - 2 (Objective Problems )
25 Videos
- UNITS AND DIMENSIONS, BASIC MATHEMATICS BOOK - MOTIONCHAPTER - UNITS AND DIMENSIONS, BASIC MATHEMATICS EXERCISE - Exercise - 1 (Objective Problems) (SECTION - B : Dimension and use of dimensions )
28 Videos
- UNIT & DIMENSIONSBOOK - MOTIONCHAPTER - UNIT & DIMENSIONSEXERCISE - Exercise - 4 (Level - II) (PREVIOUS YEAR JEE ADVANCED)
10 Videos
- VECTOR BOOK - MOTIONCHAPTER - VECTOR EXERCISE - Exercise - 3
18 Videos
Similar Questions
Knowledge Check
Draw graph for following equations :
Av=v0−atBv=4t−3Cx=4at2Dv=−gt
Draw graph of the equations.
x+y=3
View SolutionDraw the graph of following linear equation in two variables x+y=4
View SolutionDraw a graph of the equation: 2y+3=9
View SolutionDraw graph of the equation y=x+5
View SolutionDraw the graph of equation x+y=5
View SolutionDraw the graph for the equation : 2y+4x+2=0
View SolutionDraw the graph of the equation y−x=2
View Solution
