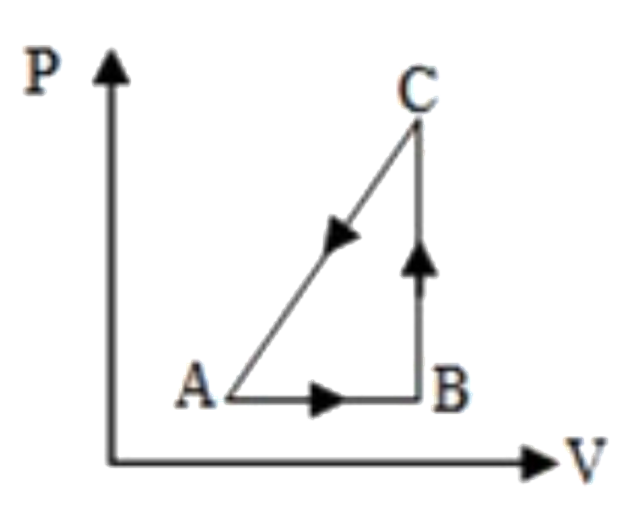
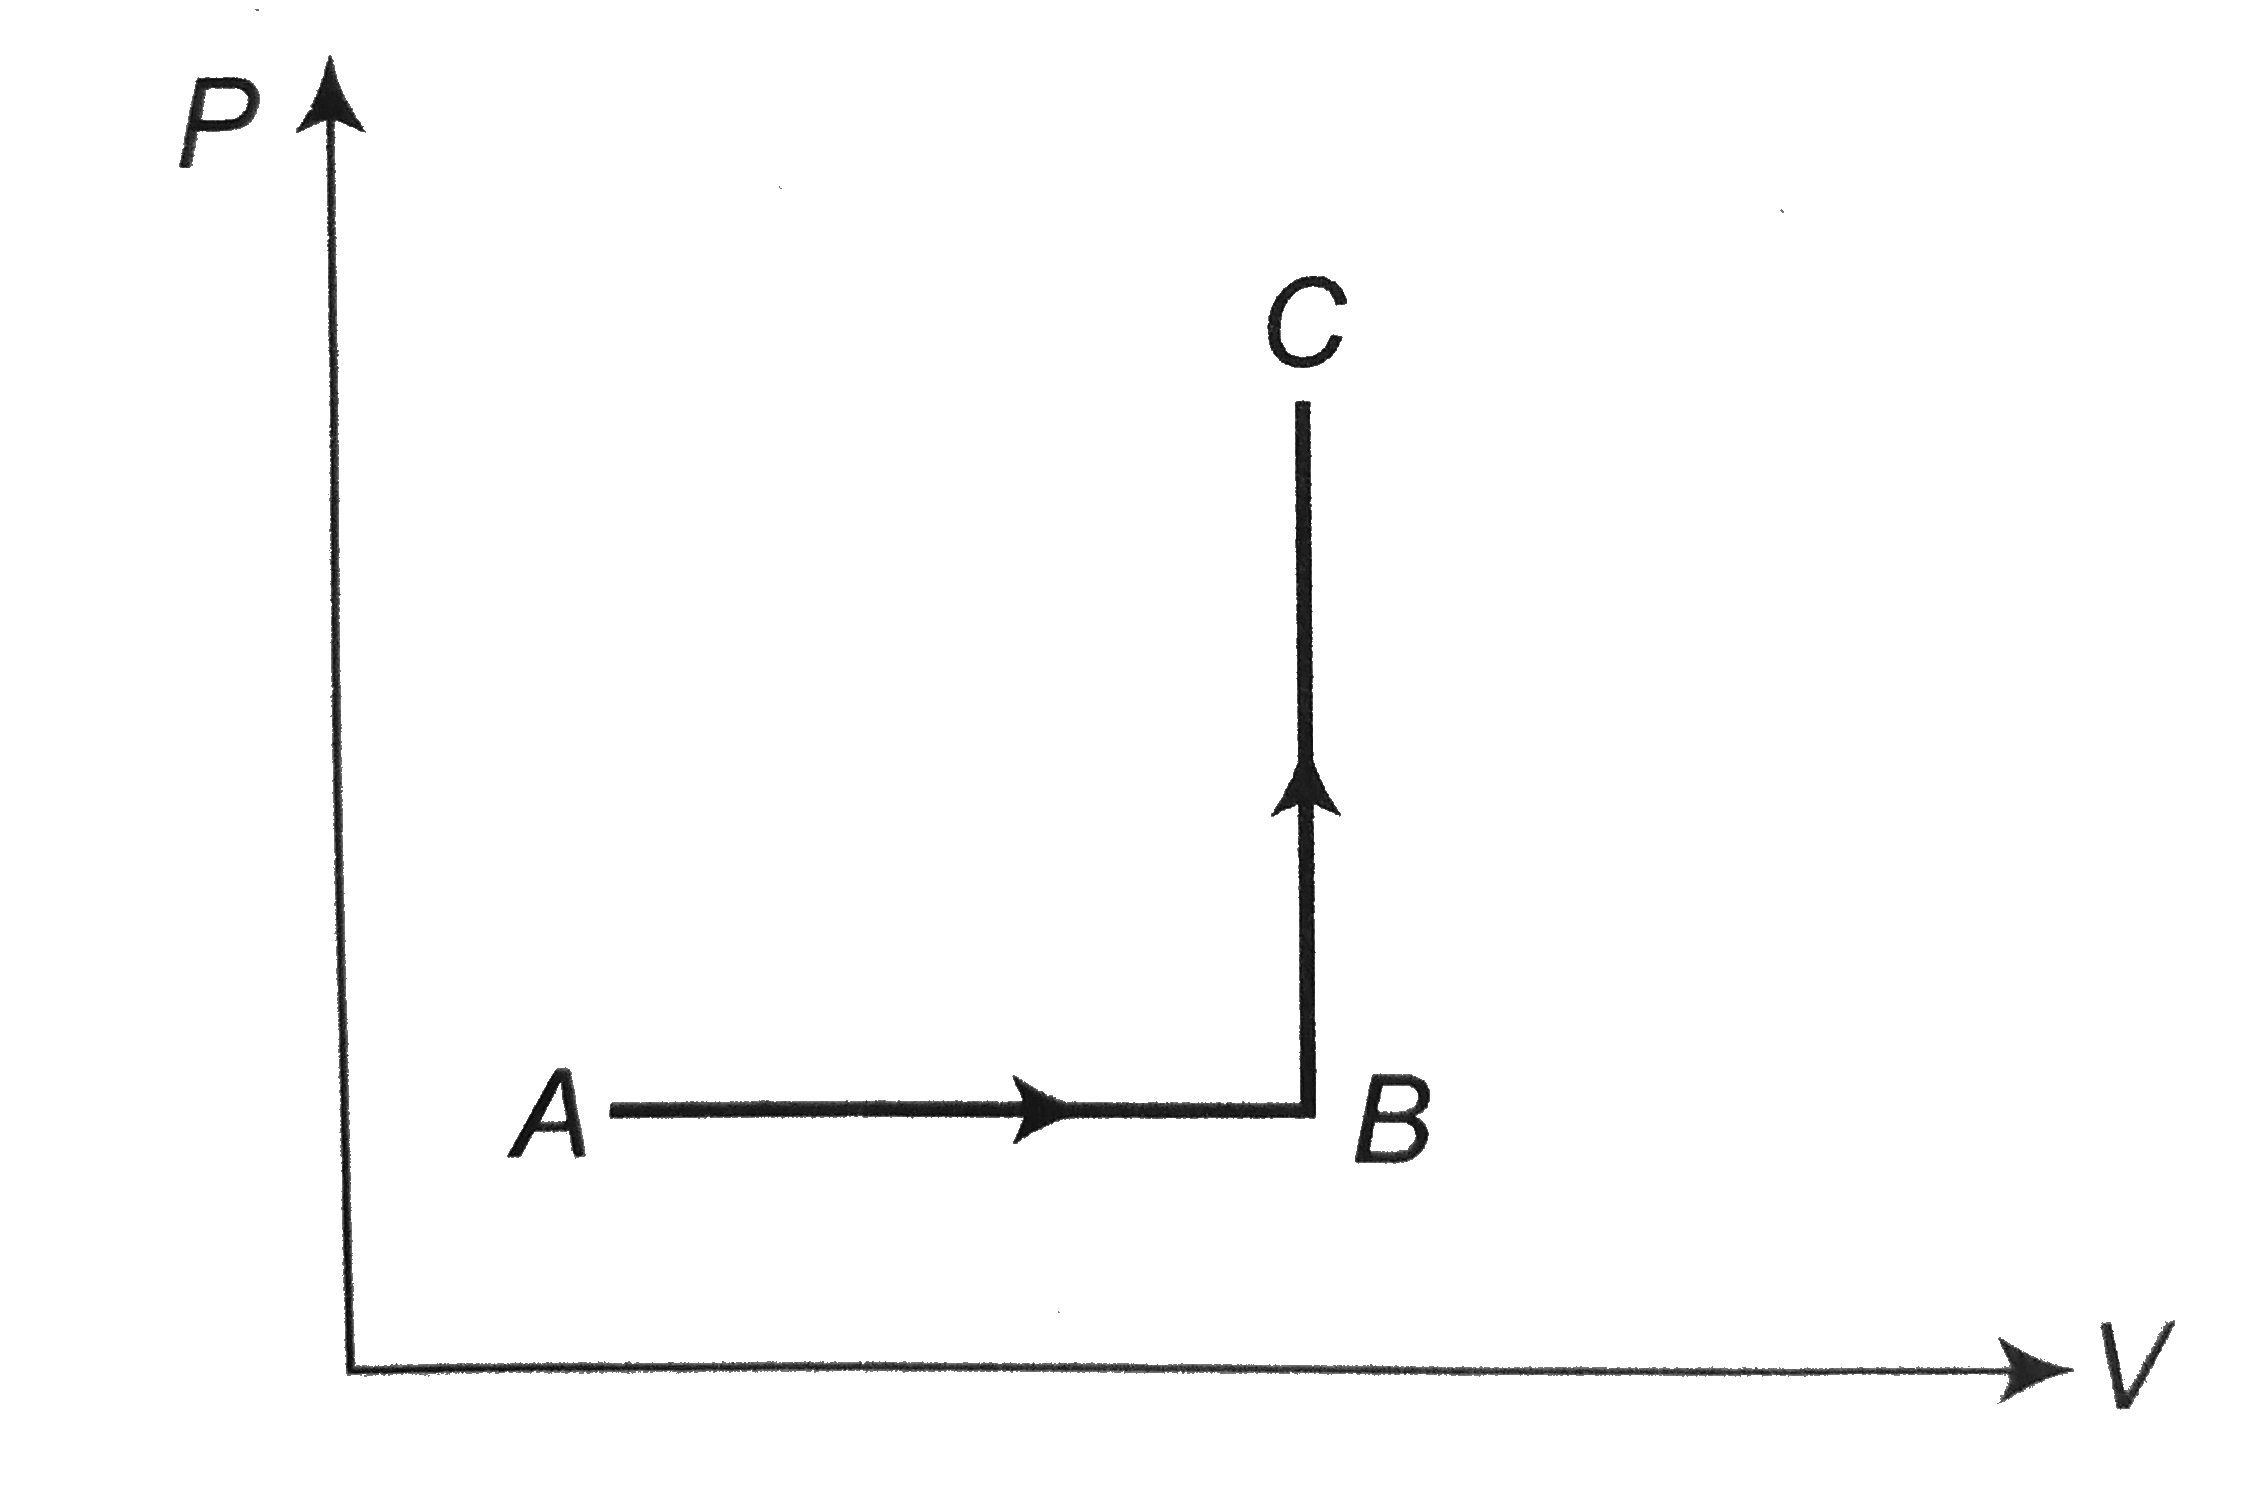
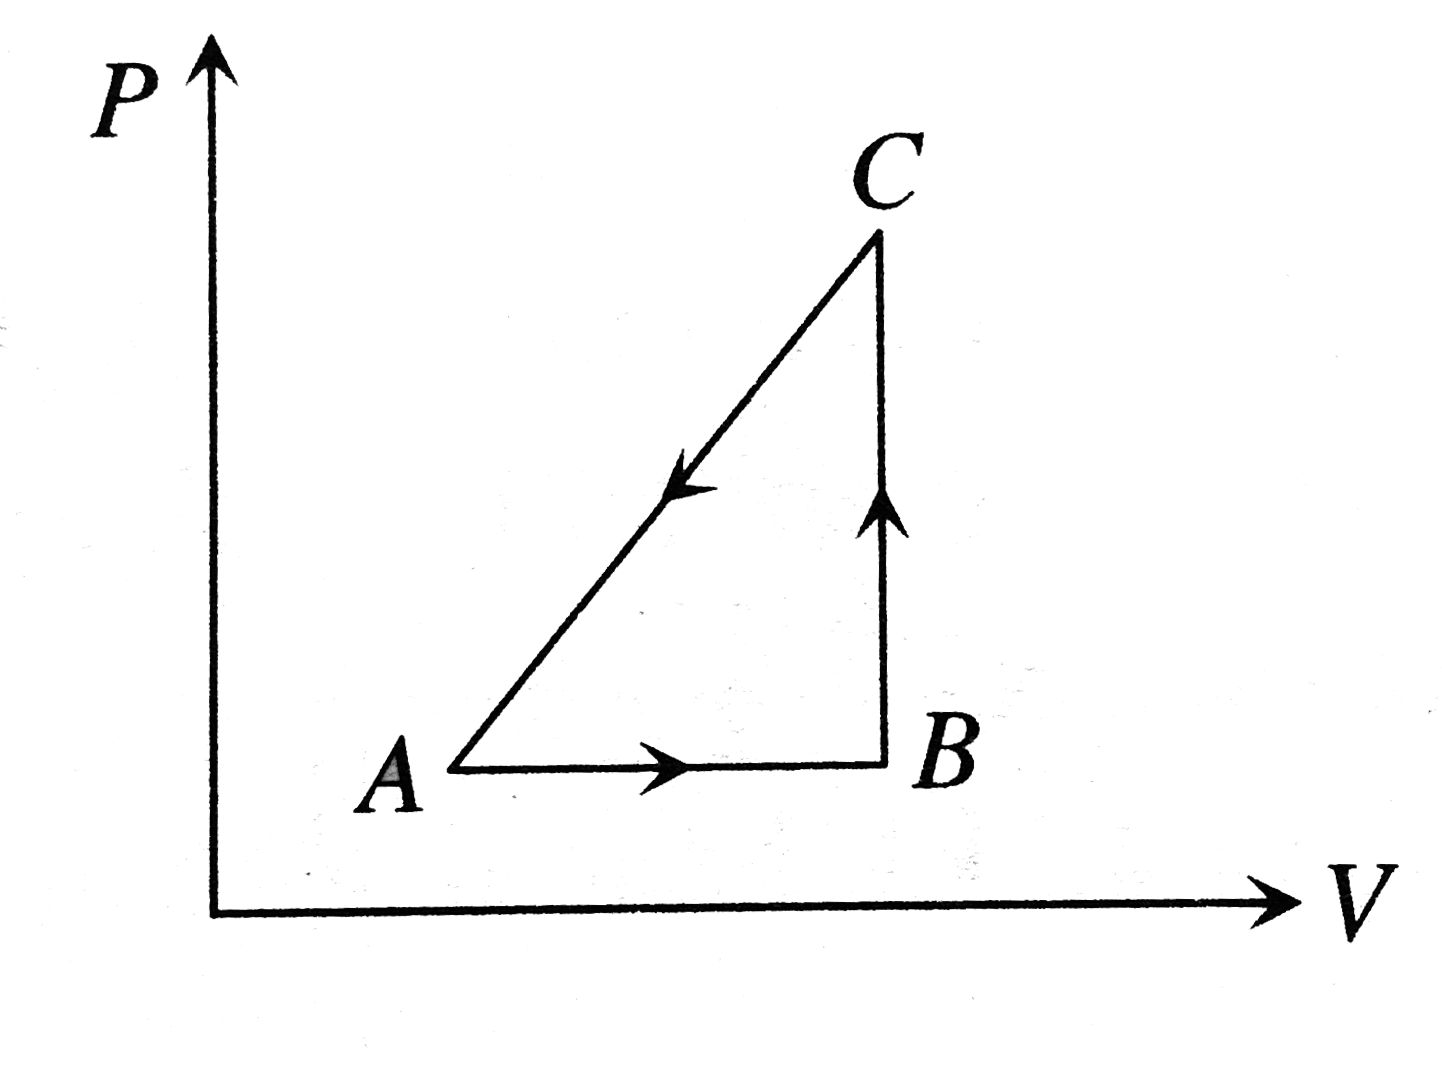
In the diagram, the graph between volume and pressure for a thermodynamical process in shown. If UA=0,UB=20J and the energy given from B to C is 30J, then at the stage of C, –
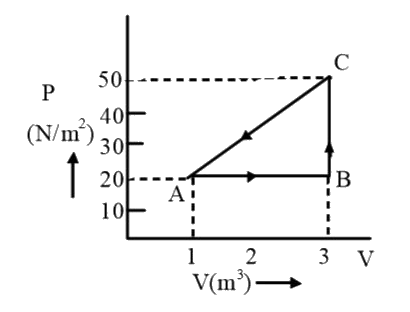
In the foregoing question, the amount of energy given to the system from A to B is :
50 j
60 j
30 j
10 j
The correct Answer is:B
Step by step video, text & image solution for In the diagram, the graph between volume and pressure for a thermodynamical process in shown. If U_(A) = 0, U_(B) = 20J and the energy given from B to C is 30J, then at the stage of C, – In the foregoing question, the amount of energy given to the system from A to B is : by Physics experts to help you in doubts & scoring excellent marks in Class 12 exams.
Topper's Solved these Questions
- BOOK - MOTIONCHAPTER - ThermodynamicsEXERCISE - EXERCISE - 240videos
Thermodynamics
- BOOK - MOTIONCHAPTER - ThermodynamicsEXERCISE - EXERCISE - 3 SECTION - A49videos
Thermodynamics
- BOOK - MOTIONCHAPTER - ThermodynamicsEXERCISE - Solved Example10videos
Thermodynamics
- BOOK - MOTIONCHAPTER - SURFACE TENSION & VISCOSITY EXERCISE - Exercise - 4 | Level-II Previous Year | JEE Advanced12videos
SURFACE TENSION & VISCOSITY
- BOOK - MOTIONCHAPTER - UNIT & DIMENSIONSEXERCISE - Exercise - 4 (Level - II) (PREVIOUS YEAR JEE ADVANCED)10videos
UNIT & DIMENSIONS
Similar Questions
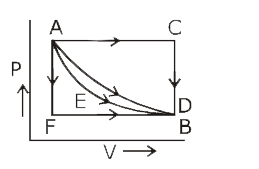
An ideal system can be brought from stage A to B through four paths as shown in the figure. The heat energy given to the system is minimum in :
 View Solution
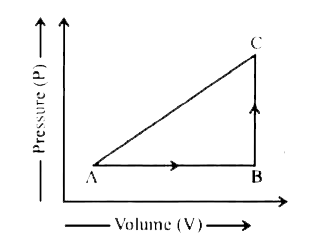
The P - V diagram of a system undergoing thermodynamic changes is as shown in the figure. The work done by the system in going from A→B→C is 30 J. If 68 J of heat is given to the system, then the change in the internal energy of the system between A and C is
 View Solution
Knowledge Check
- Question 1 - Select One
In the diagram, the graph between volume and pressure for a thermodynamical process in shown. If UA=0,UB=20J and the energy given from B to C is 30J, then at the stage of C, the internal energy of the system is –
 A50 jB60 jC30 jD10 j
 - Question 2 - Select One
An ideal system can be brought from stage A to B through Four paths as shown in the figure. The energy given to the system is minimum is:
 Apath ACBBpath ADBCpath AEBDpath AFB
 - Question 3 - Select One
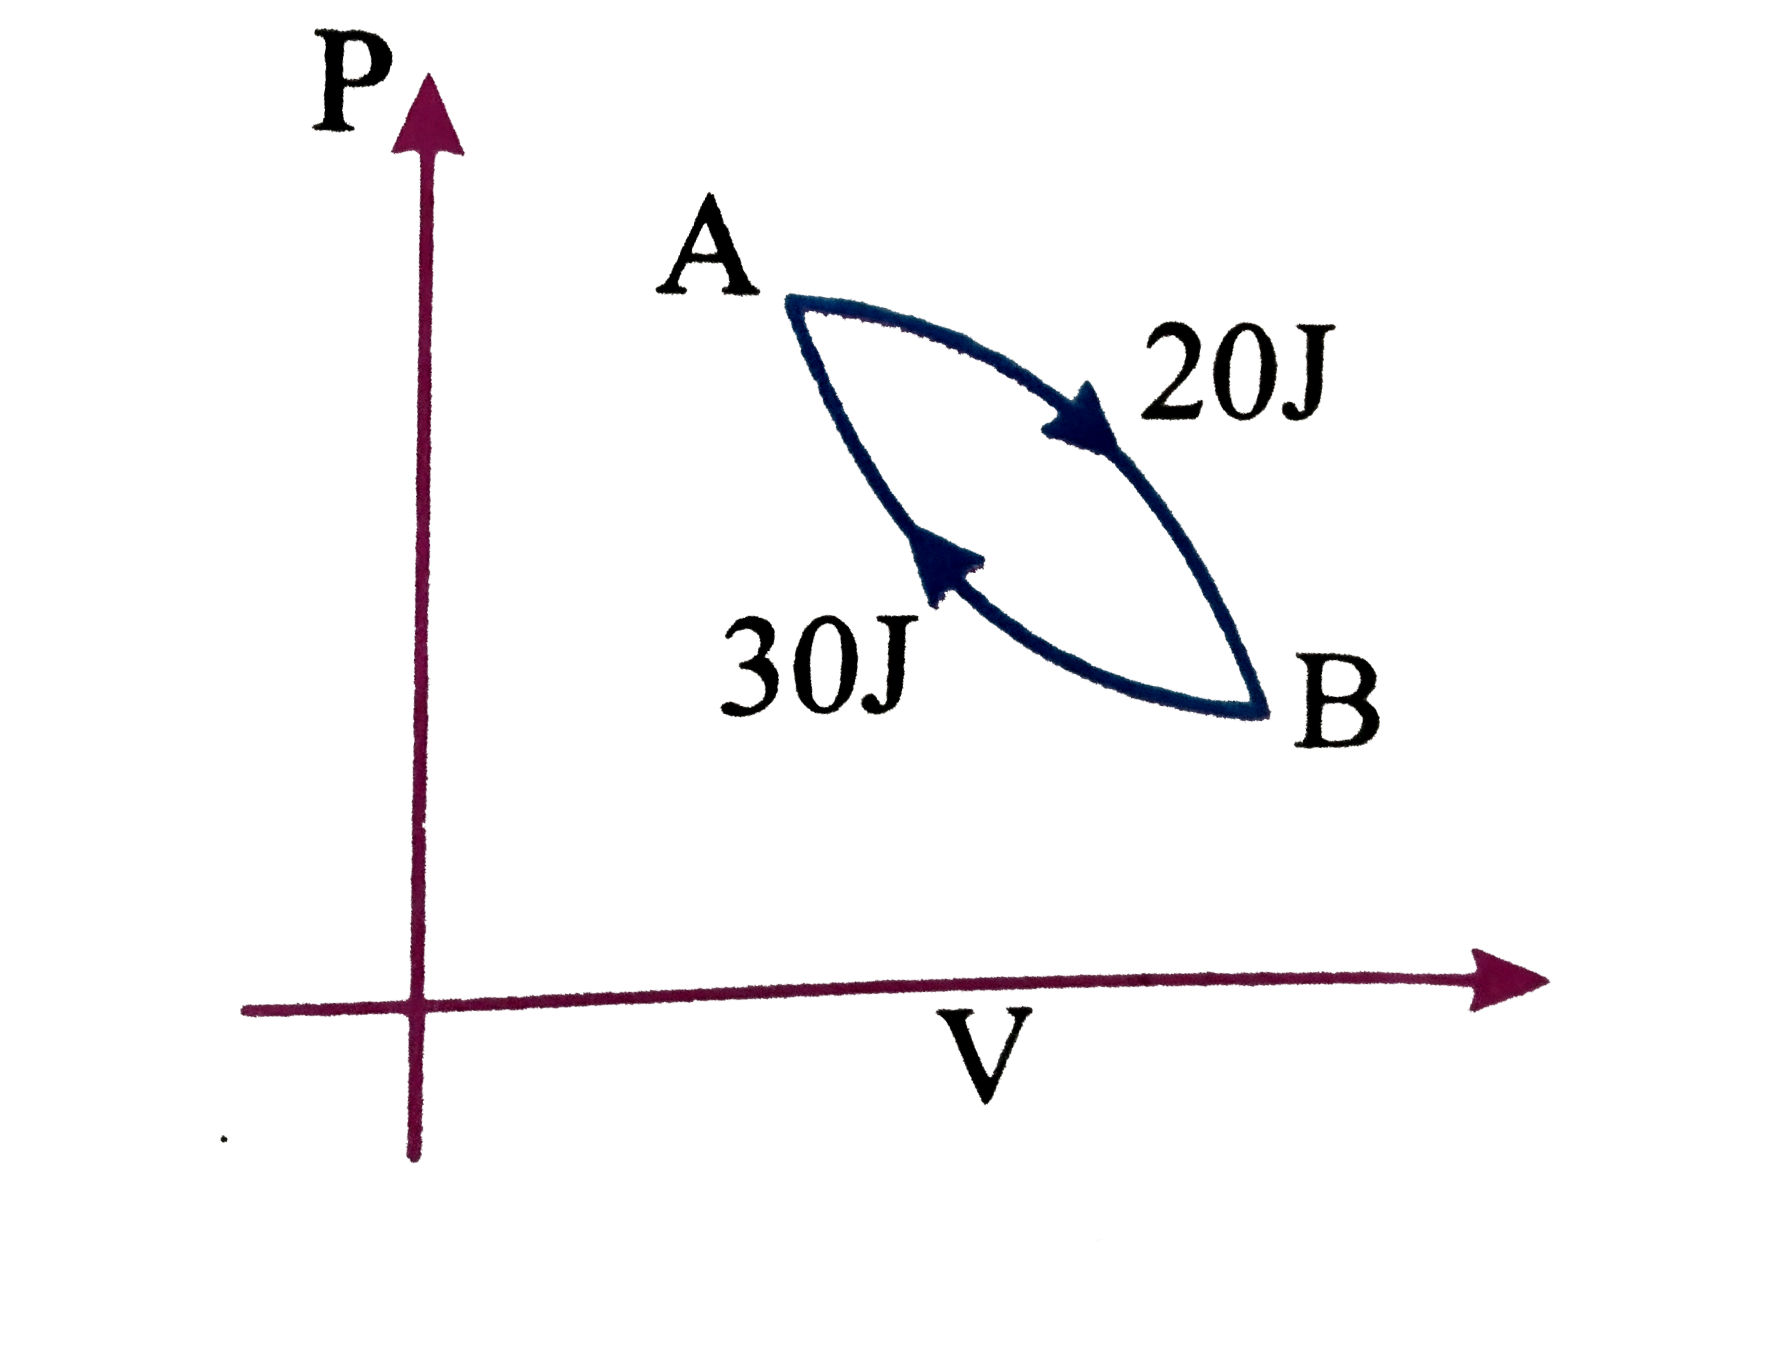
In a cyclic process shown in the figure an ideal gas is adial gas is adiabatically taken from BtoA, the work done on the gas during the process BtoA is 30,J when the gas is taken from A to B the heat absorbed by the gas is 20J Then change in internat energy of the gas in the process A to B is :
 A20JB−30JC50JD−10J
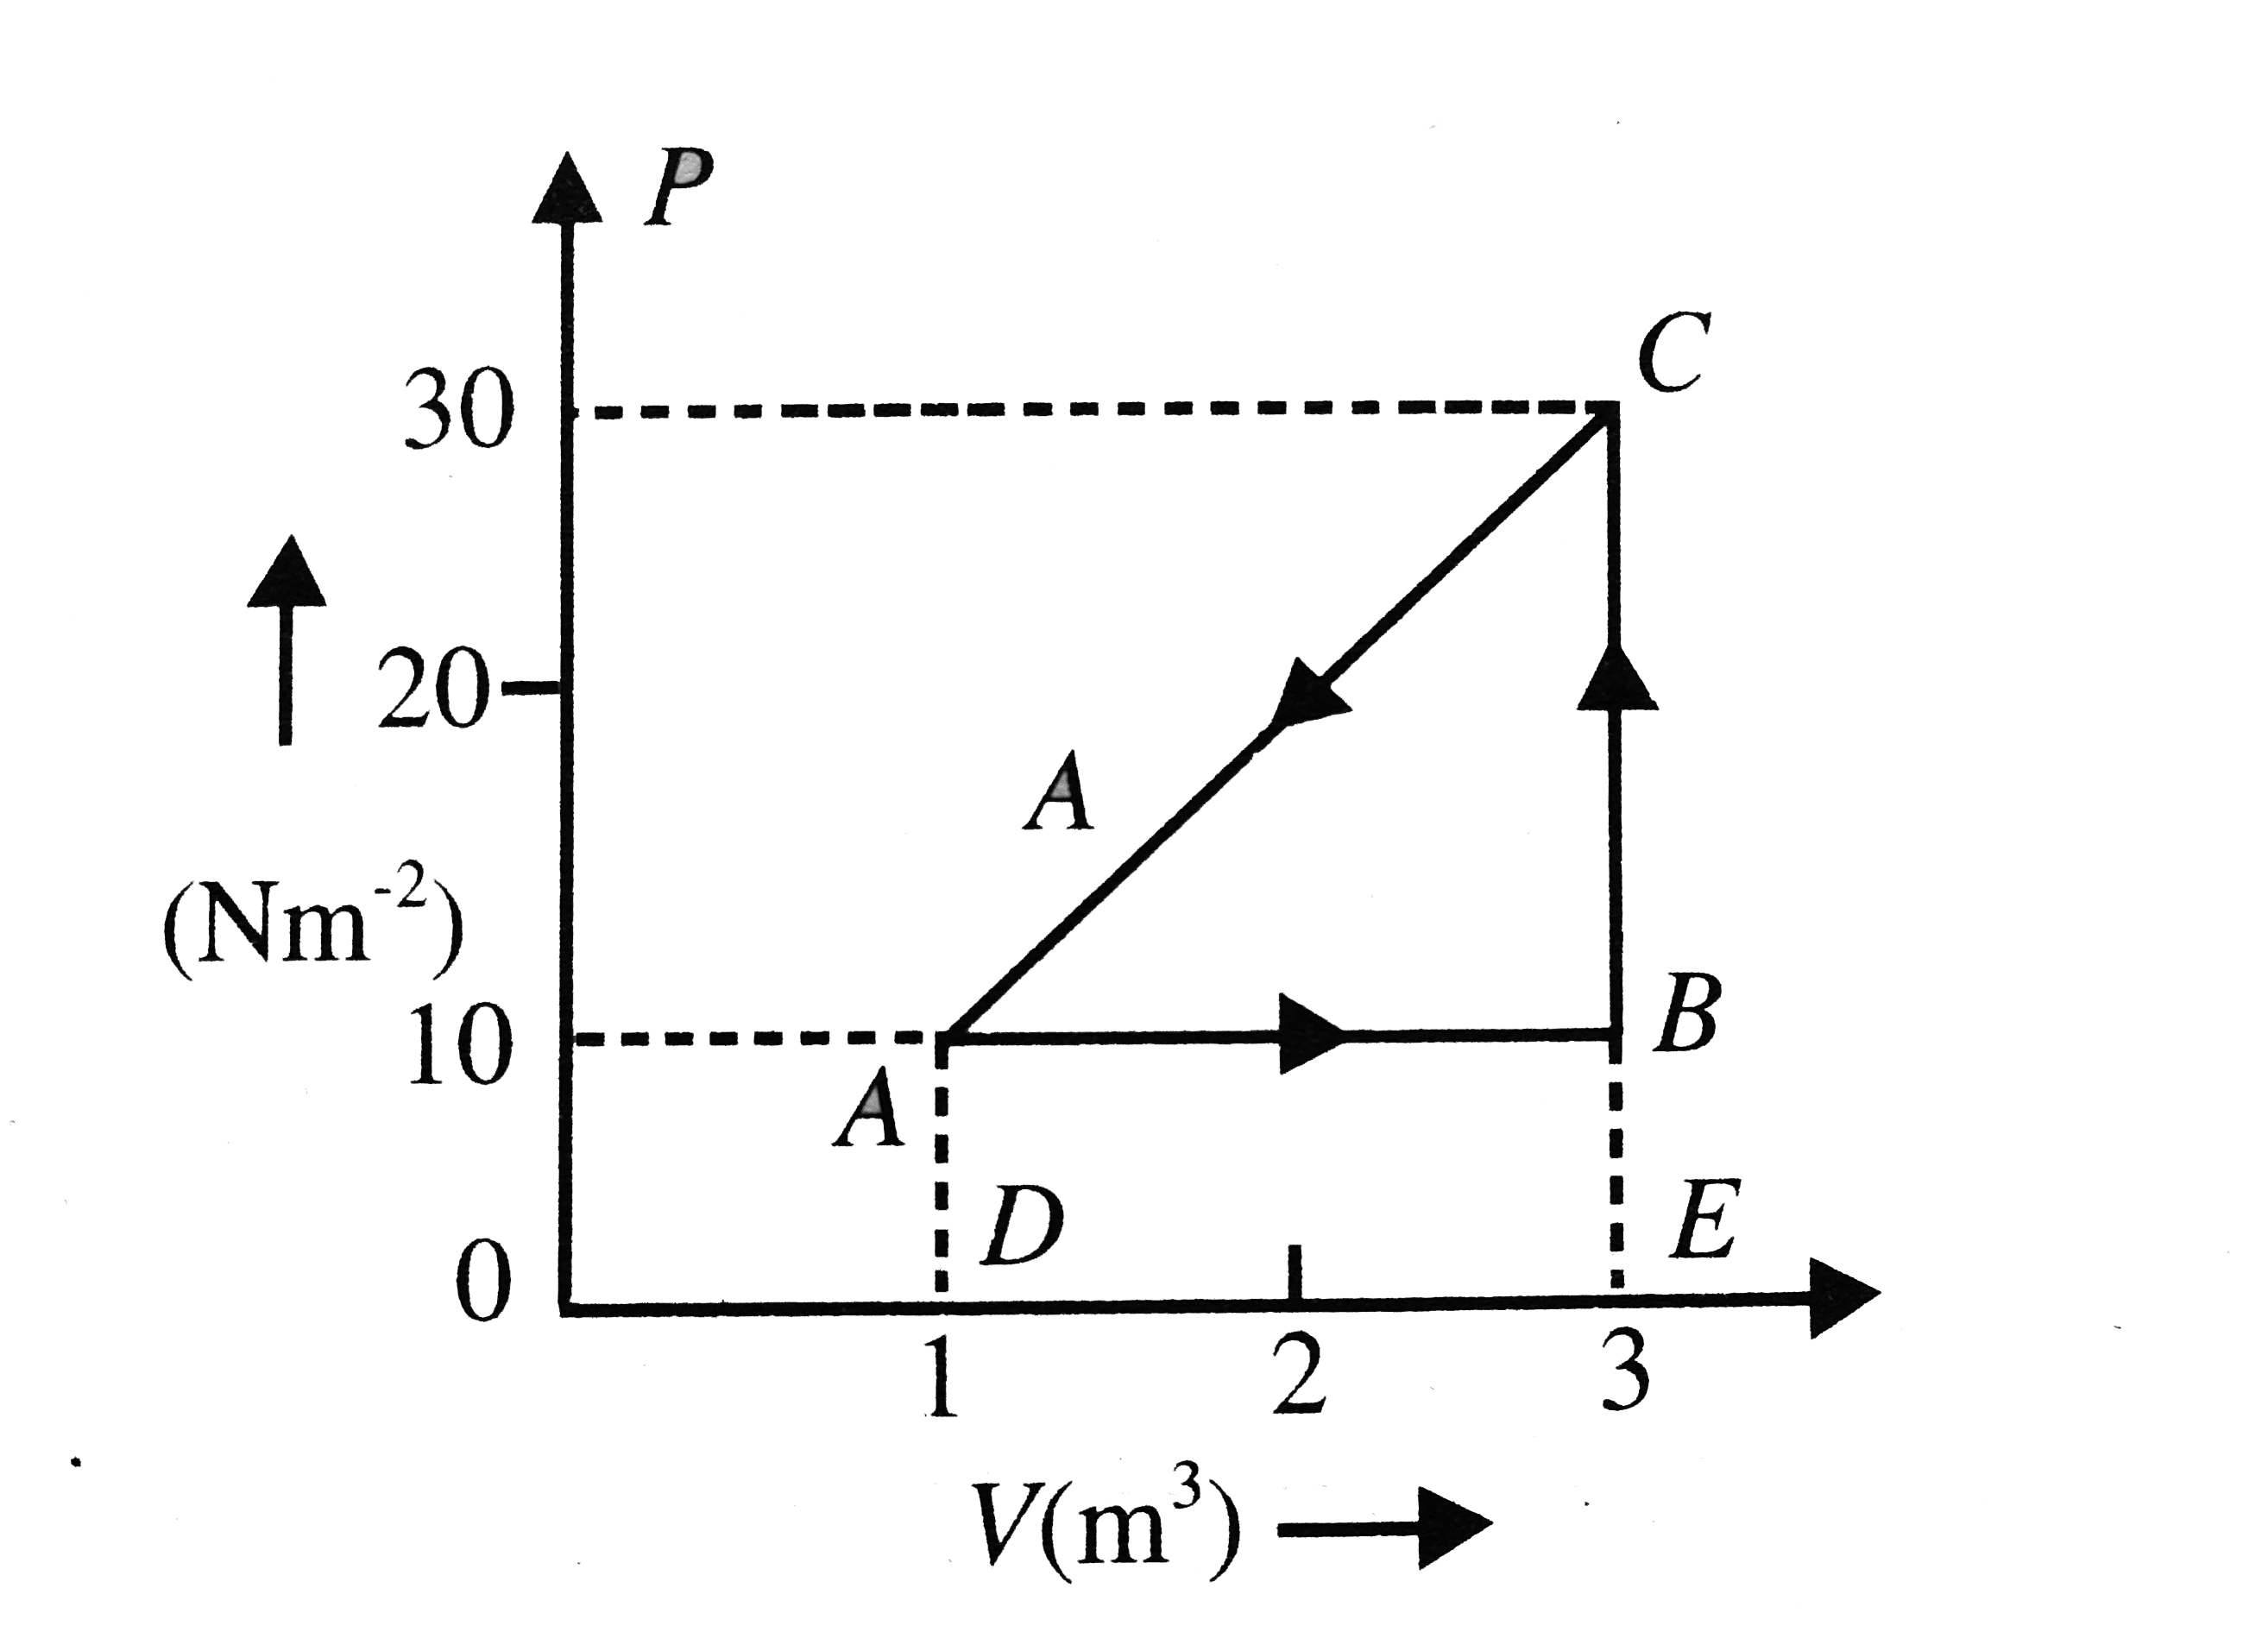
The P - V diagram of a system undergoing thermodynamic transformation is shown in figure . The work done on the system in going from A→B→C is 50 J and 20 cal heat is given to the system . The change in internal energy between A and C is -
 View Solution
An ideal gas is taken round a cyclci thermodynamic process ABCA as shown if Fig. If the internal energy of the gas at point A is assumed zero while at B it is 50 J. The heat absorbed by the gas in the process BC is 90 J.
(a) What is the internal energy og the gas at point C ?
(b) How much heat energy is absorbed by the gas in the process AB?
(c ) Find the heat energy rejected or absorbed by the gas in the process CA.
(d) What is the net work done by the gas in the complete cycle ABCA ?
 View Solution
In the adjoinign P-V diagram, 100 J of heat is given in taking a system from A to C along the path ADC and 50 J of work is done by system in this path.
a. If the work done by the suystem is 15 J along the path ABC, then how much heat is to be given in taking the system from A to C along ABC?
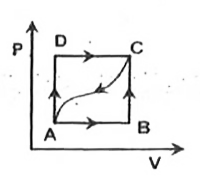
b. How much heat will be absorbed or given out if the work done on the system along the curved path from CA to A is 15 J?
c. If UB−UA=40J, then how much heat will be absorbed in each process AB and BC?View SolutionThe P−V diagram of a system undergoing thermodynamic transformation is shown in figure. The work done by the system in going from A→B→Cis30J and 40J heat is given to the system. The change in internal energy between AandC is
 View Solution
The P−V diagram of a system undergoing thermodynnaic transformation is shown in Fig. The work done on the system in going from A→B→C is 50J and 20cal heat is given to the system. The change in internal erergy between A and C is
 View Solution

