Current through the coil varies according to graph then induced emf v/s time graph is
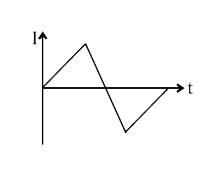
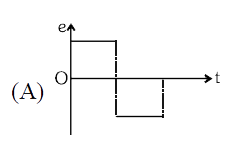
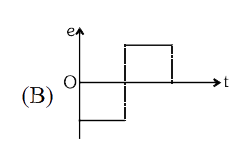
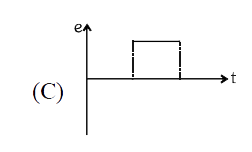
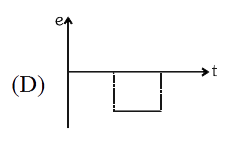
The correct Answer is:B
Step by step video, text & image solution for Current through the coil varies according to graph then induced emf v/s time graph is by Physics experts to help you in doubts & scoring excellent marks in Class 12 exams.
Topper's Solved these Questions
- BOOK - MOTIONCHAPTER - ELECTRO MAGNETIC INDUCTIONEXERCISE - EXERCISE-172videos
ELECTRO MAGNETIC INDUCTION
- BOOK - MOTIONCHAPTER - ELECTRO MAGNETIC INDUCTIONEXERCISE - EXERCISE-2 (Objective problems (Analytical questions))70videos
ELECTRO MAGNETIC INDUCTION
- BOOK - MOTIONCHAPTER - ELECTRO MAGNETIC INDUCTIONEXERCISE - QUESTIONS FOR PRACTICE (Type- IV: Questions based on induced Parameters :-)10videos
ELECTRO MAGNETIC INDUCTION
- BOOK - MOTIONCHAPTER - Electrical Instrument EXERCISE - EXERCISE -316videos
Electrical Instrument
- BOOK - MOTIONCHAPTER - ELECTRO MAGNETIC WAVES EXERCISE - EXERCISE - 3 (SECTION - B)8videos
ELECTRO MAGNETIC WAVES
Similar Questions
The magnetic flux through a coil varies with time t as follows:
ϕt=(8t3−6t2+t−5)Wb
What is the induced current through the coil at t = 4 s, given that the resistance of the coil is 10 Ω and the magnetic flux through the coil is perpendicular to its plane?View SolutionThe current i in an induction coil varies with time t according to the graph
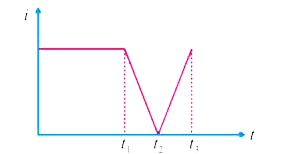
Draw the graph of induced e.m.f. with time.View Solution
Knowledge Check
- Question 1 - Select One
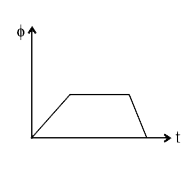
Magnetic flux linked through the coil changes with respect to time accourding to following graph, then induced emf v/s time graph for coil is :-
 A
A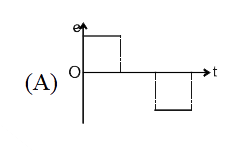 B
B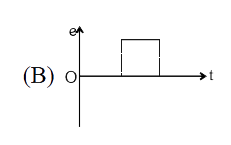 C
C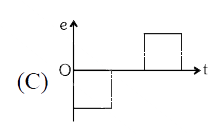 D
D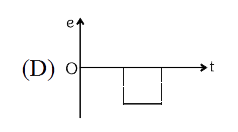
- Question 2 - Select One
A and B are two coils placed closely as shown. The current in coil A varies as shown in the graph.
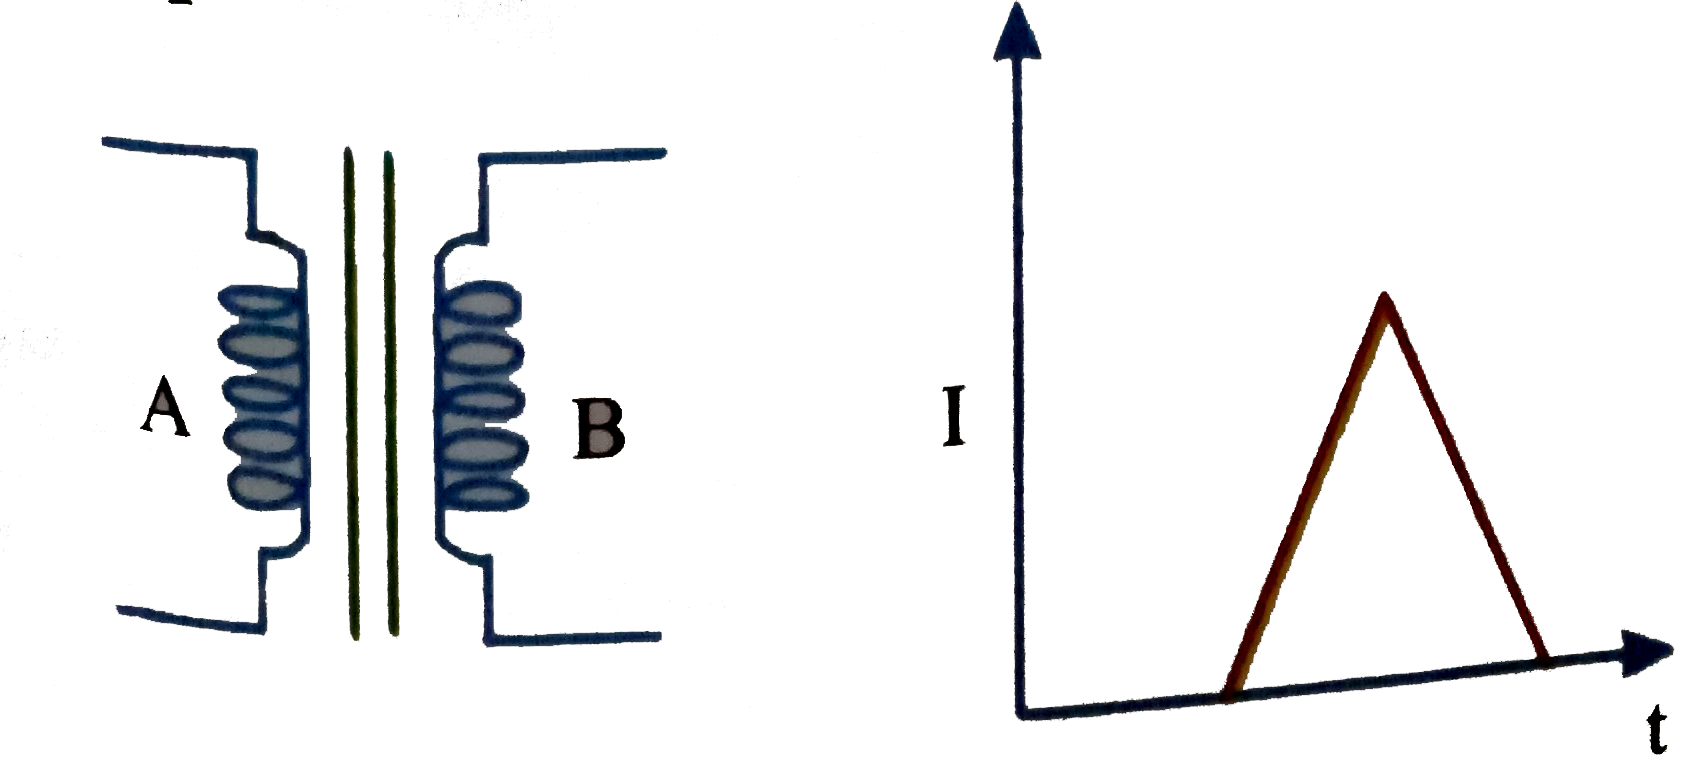
Then which of the following graphs gives the best respresent of variation of induction emf in coil B?A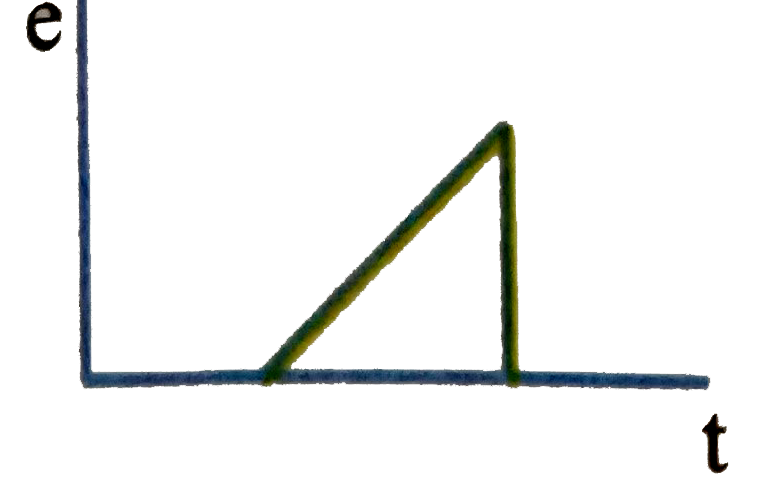 B
B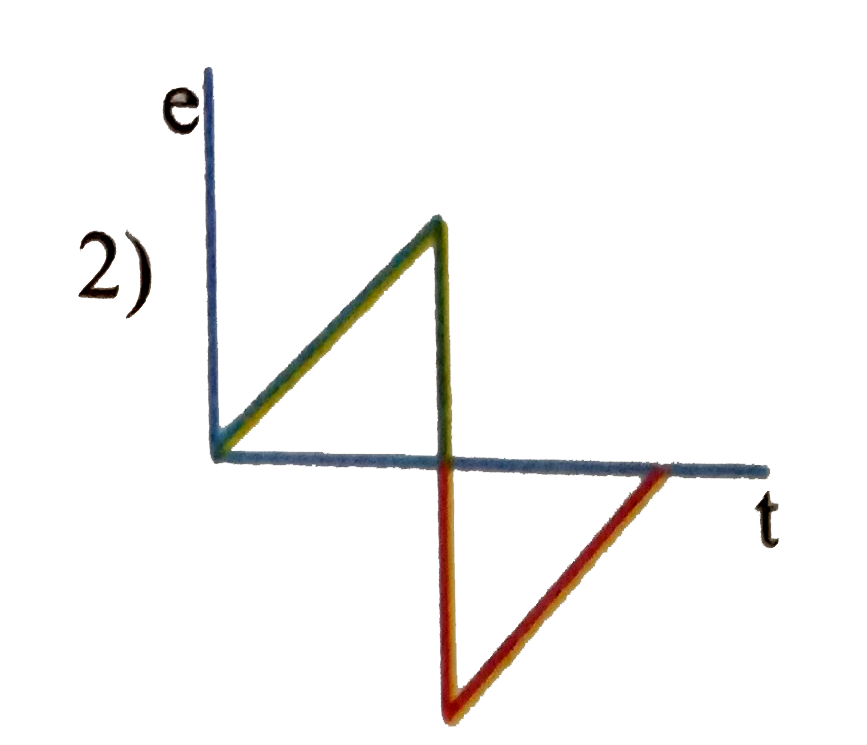 C
C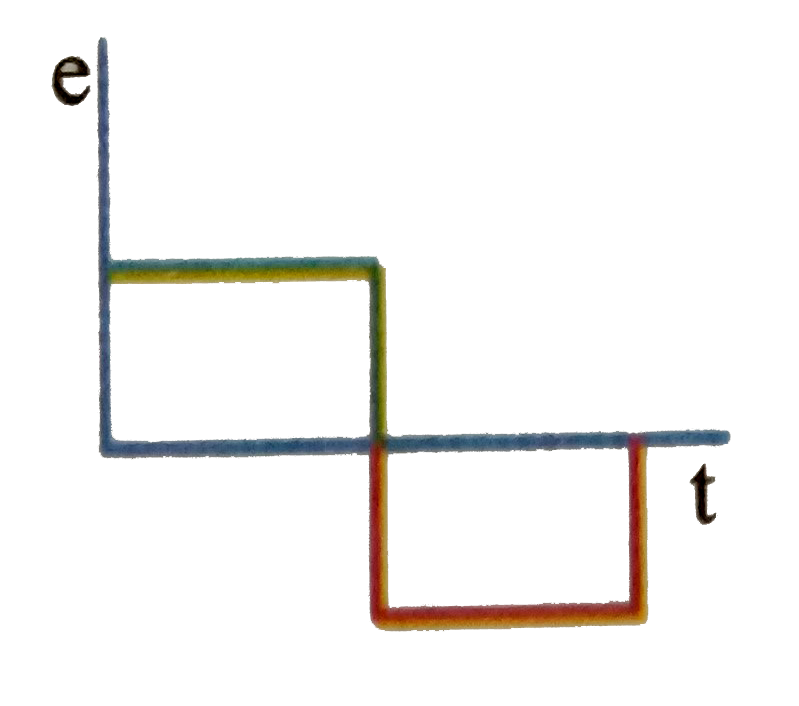 D
D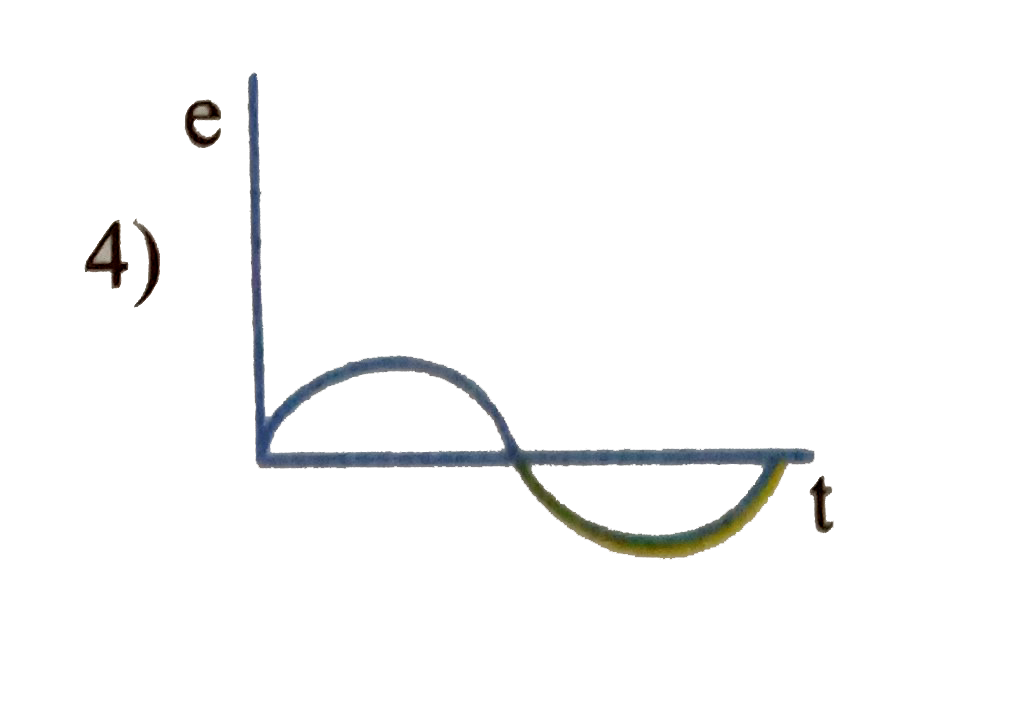
- Question 3 - Select One
Current varies with time as shown in the graph
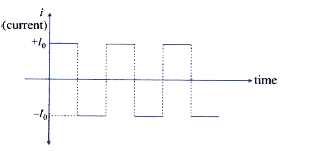
Current isAAC with changing magnitudeBAC with constant magnitudeCDC with changing magnitudeDDC with constant magnitude
The current through a 4.6 H inductor is shown in the following graph. The induced emf during the time interval t = 5 milli - sec to 6 milli - sec will be
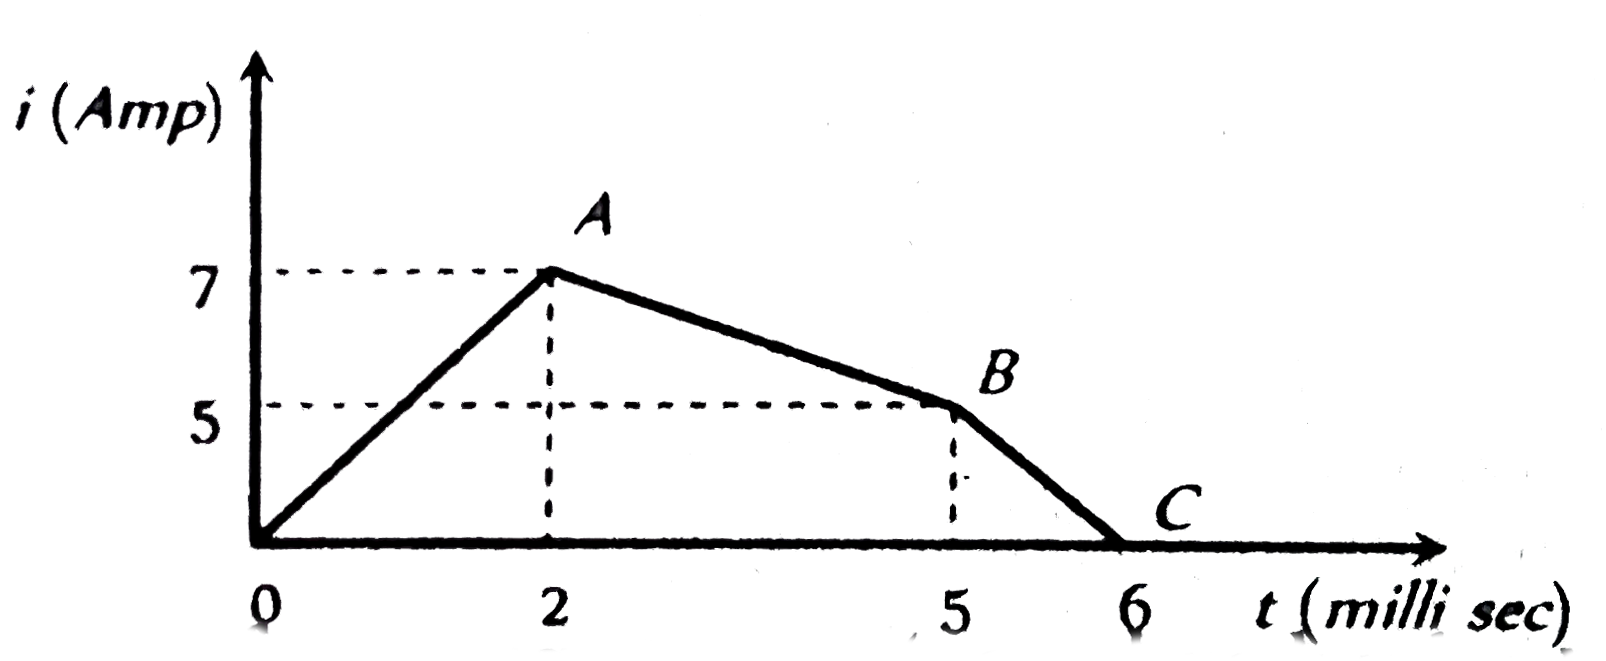 View Solution
The current i in an induction coil varies with time according to the graph shown in figure. Which of the following graph shows induced emf in the coil with time:
View SolutionThe current I in an inductance coil varies with time according to the graph given in the figure.
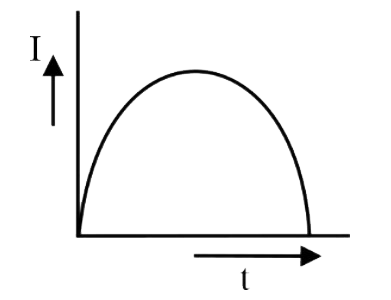
Which one of the following graphs gives the variation of voltage with time across the inductor?View SolutionThe current through the coil in figure (i) varies as shown in figure (ii). Which graph best shows the ammeter A reading as a function of time?
 View Solution
The current is an induction coil varies with time t, according to the graph shown in figure. Which of the following graphs shows the induced emf (e) in the coil with time.
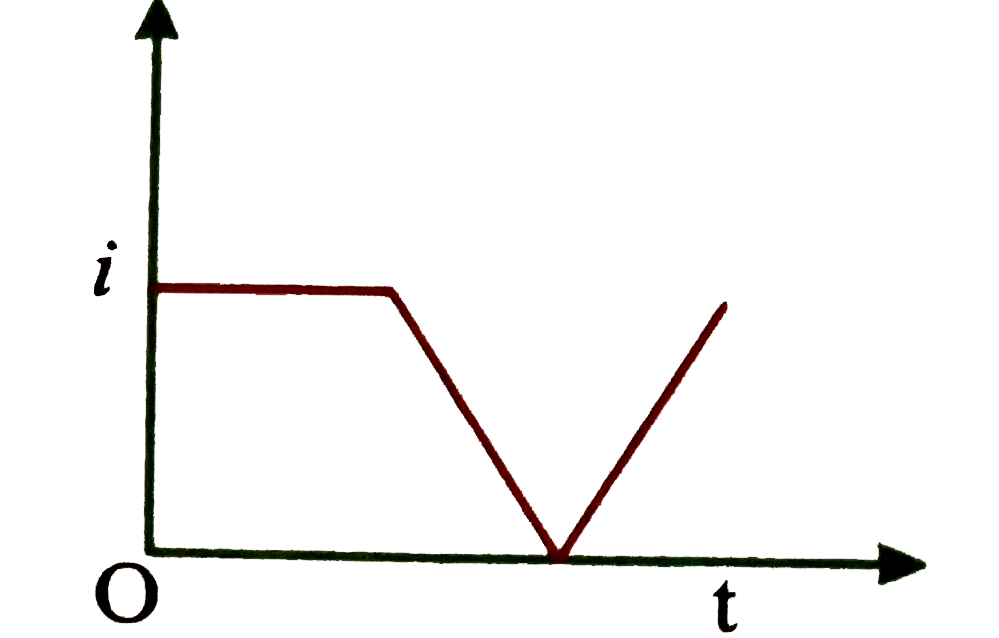 View Solution

