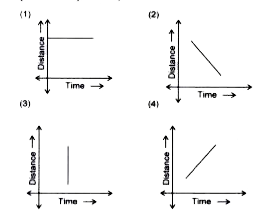
Out of the following graph(s), which is / are not possible ?
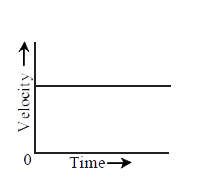
To determine which of the given graphs are not possible in the context of one-dimensional motion, we will analyze each graph systematically.
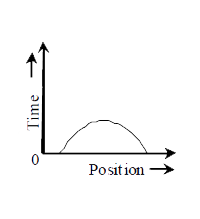
1. Understanding Graph A:
- Graph A shows an object at two different positions at the same time.
- In physics, it is impossible for an object to occupy two different positions simultaneously.
- Conclusion: Graph A is not possible.
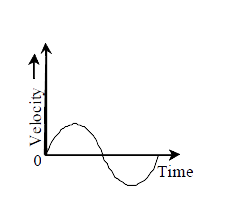
2. Understanding Graph B:
- Graph B represents a velocity-time graph.
- The slope of the velocity-time graph gives the acceleration.
- If the graph has a portion where the velocity is positive and another where it is negative, the area under the curve will give the displacement.
- The graph can have zero displacement if the positive and negative areas cancel each other out.
- Conclusion: Graph B is possible.
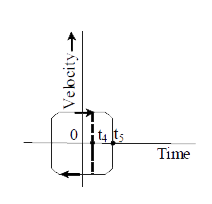
3. Understanding Graph C:
- Graph C shows two different velocities at the same time.
- Similar to Graph A, it is not possible for an object to have two different velocities simultaneously.
- The slope of the velocity-time graph cannot be vertical, as this would imply infinite acceleration, which is also not physically feasible.
- Conclusion: Graph C is not possible.
4. Understanding Graph D:
- Graph D is not specified in detail, but if it follows the rules of motion and does not show any contradictions (like occupying two positions or having two velocities at the same time), it is likely possible.
- Conclusion: Graph D is possible.
Final Conclusions:
- Graphs that are not possible: A and C.
- Graphs that are possible: B and D.
- Graph A shows an object at two different positions at the same time.
- In physics, it is impossible for an object to occupy two different positions simultaneously.
- Conclusion: Graph A is not possible.
- Graph B represents a velocity-time graph.
- The slope of the velocity-time graph gives the acceleration.
- If the graph has a portion where the velocity is positive and another where it is negative, the area under the curve will give the displacement.
- The graph can have zero displacement if the positive and negative areas cancel each other out.
- Conclusion: Graph B is possible.
- Graph C shows two different velocities at the same time.
- Similar to Graph A, it is not possible for an object to have two different velocities simultaneously.
- The slope of the velocity-time graph cannot be vertical, as this would imply infinite acceleration, which is also not physically feasible.
- Conclusion: Graph C is not possible.
- Graph D is not specified in detail, but if it follows the rules of motion and does not show any contradictions (like occupying two positions or having two velocities at the same time), it is likely possible.
- Conclusion: Graph D is possible.
- Graphs that are not possible: A and C.
- Graphs that are possible: B and D.
Topper's Solved these Questions
- BOOK - MOTIONCHAPTER - ONE DIMENSION MOTIONEXERCISE - EXERCSE -1 (Section - A : Distance, Displacement, Velocity and Acceleration, Equation of Motion )26videos
ONE DIMENSION MOTION
- BOOK - MOTIONCHAPTER - ONE DIMENSION MOTIONEXERCISE - EXERCSE -1 (Section - B : Motion under Gravity)11videos
ONE DIMENSION MOTION
- BOOK - MOTIONCHAPTER - NLM & FRICTIONEXERCISE - EXERCISE-4 ( LEVEL-II)15videos
NLM & FRICTION
- BOOK - MOTIONCHAPTER - OPTICSEXERCISE - Exercise45videos
OPTICS
Similar Questions
Knowledge Check
- Question 1 - Select One
Which of the following graph (s) is / are not possible
A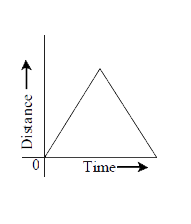 B
B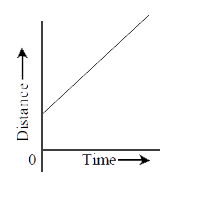 C
C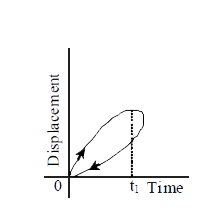 D
D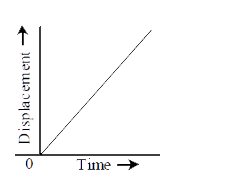
- Question 2 - Select One
Out of the following graphs, which grpahs shows the correct relation (graphical representation) for LC parallel resonant circuit ?
A B
B C
C D
D
- Question 3 - Select One
Out of the following graphs, which graphs shows the correct relation (graphical repesentation) for LC parallel resonant circuit ?
A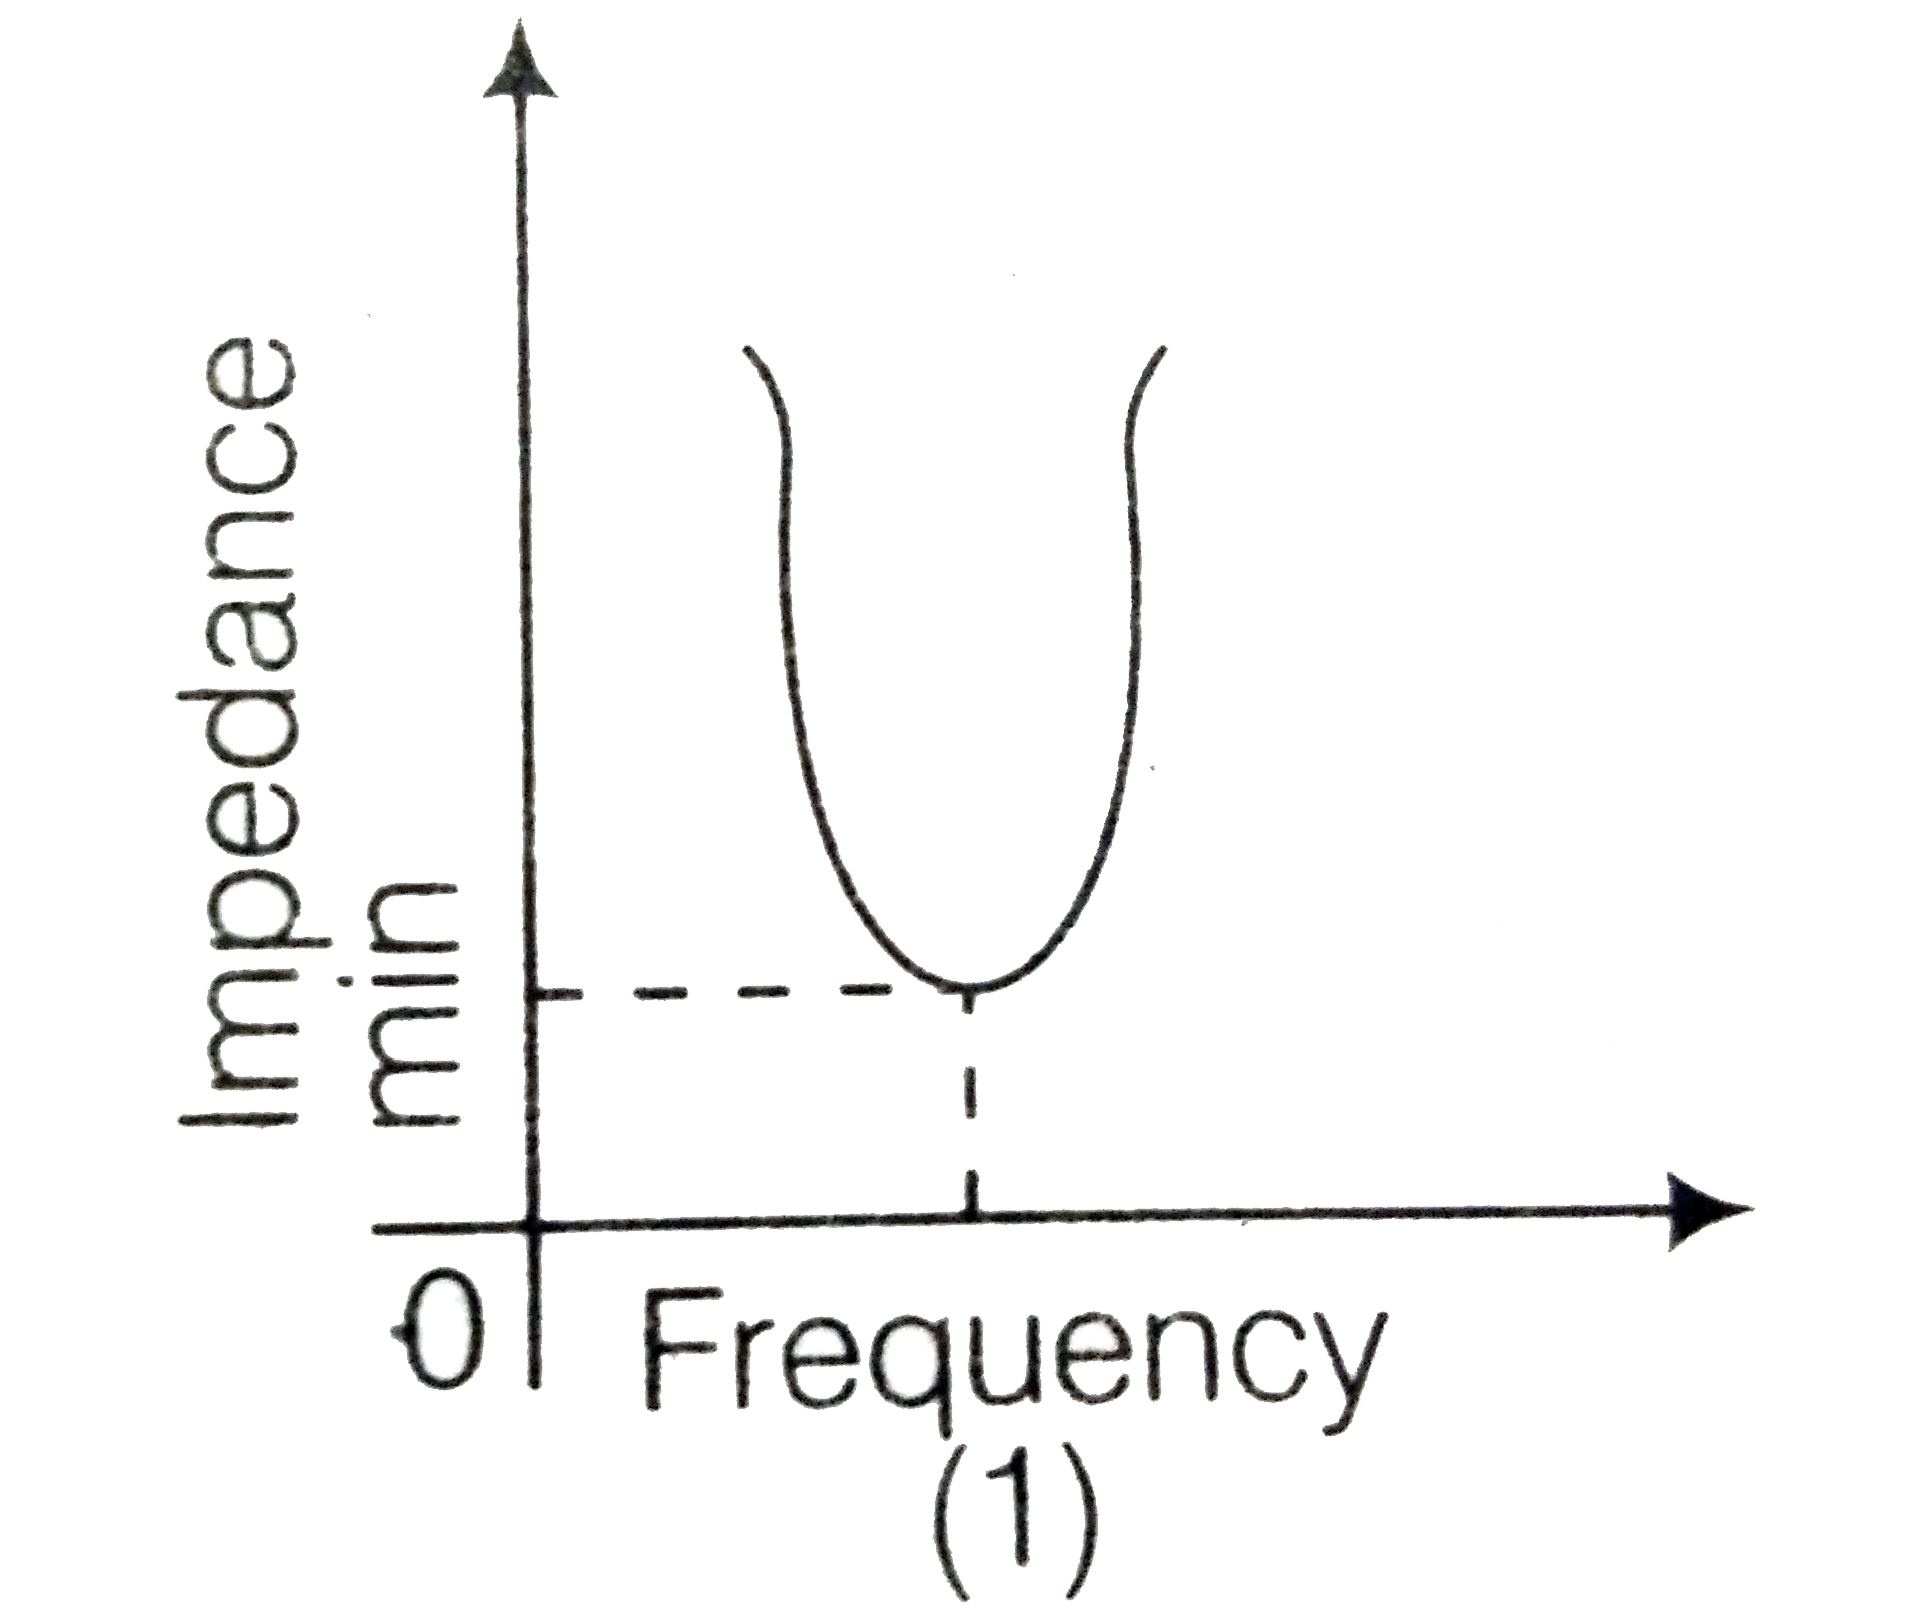 B
B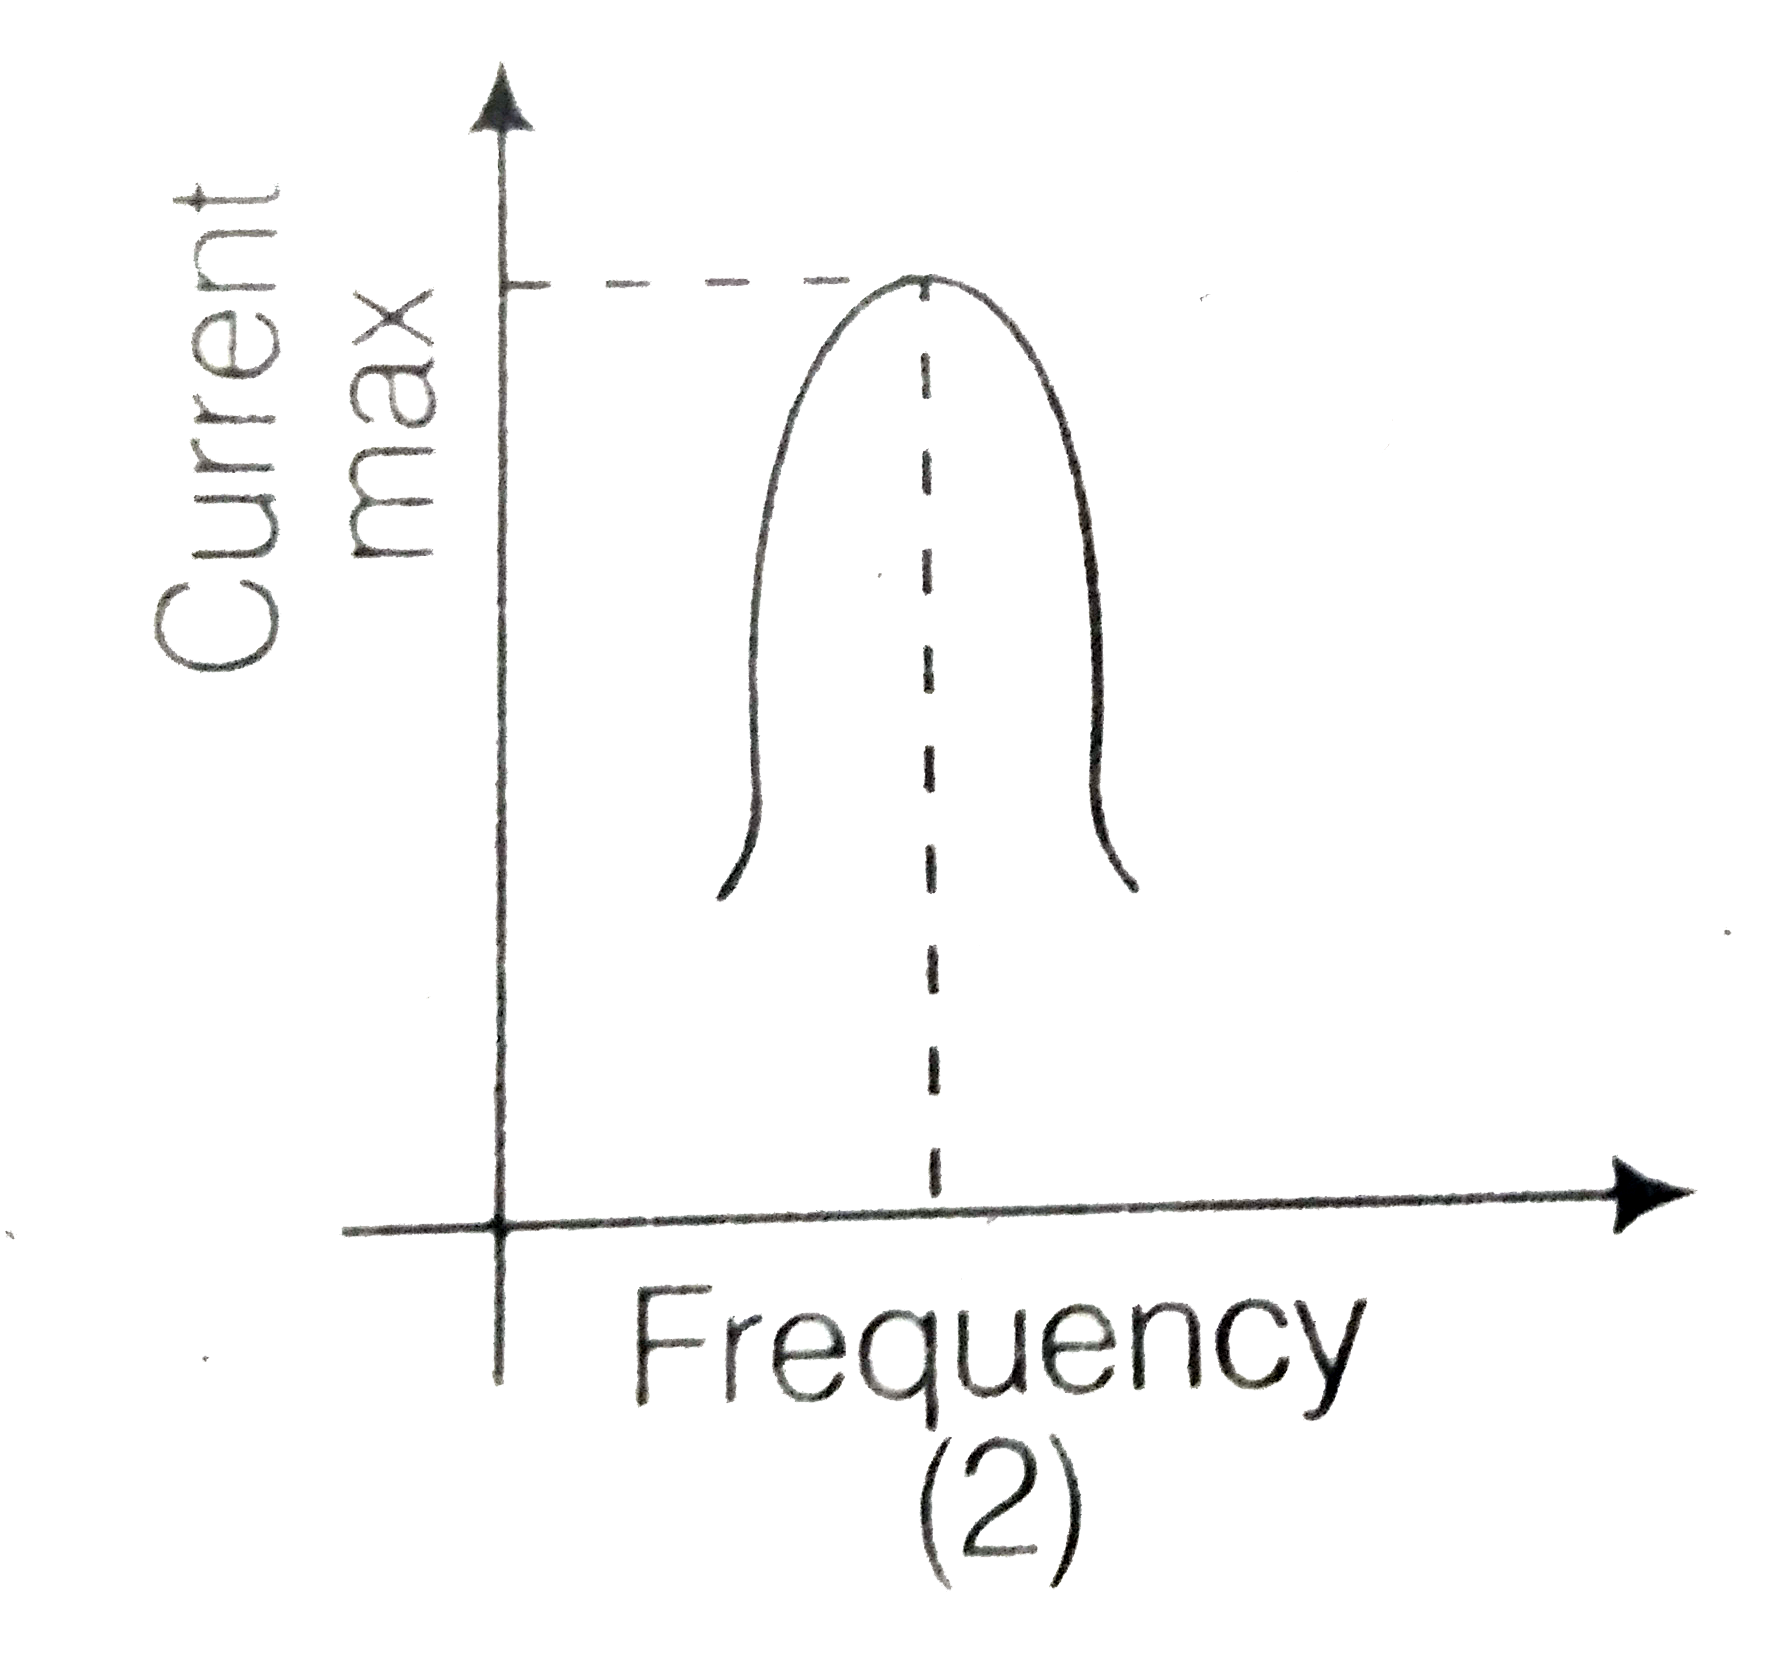 C
C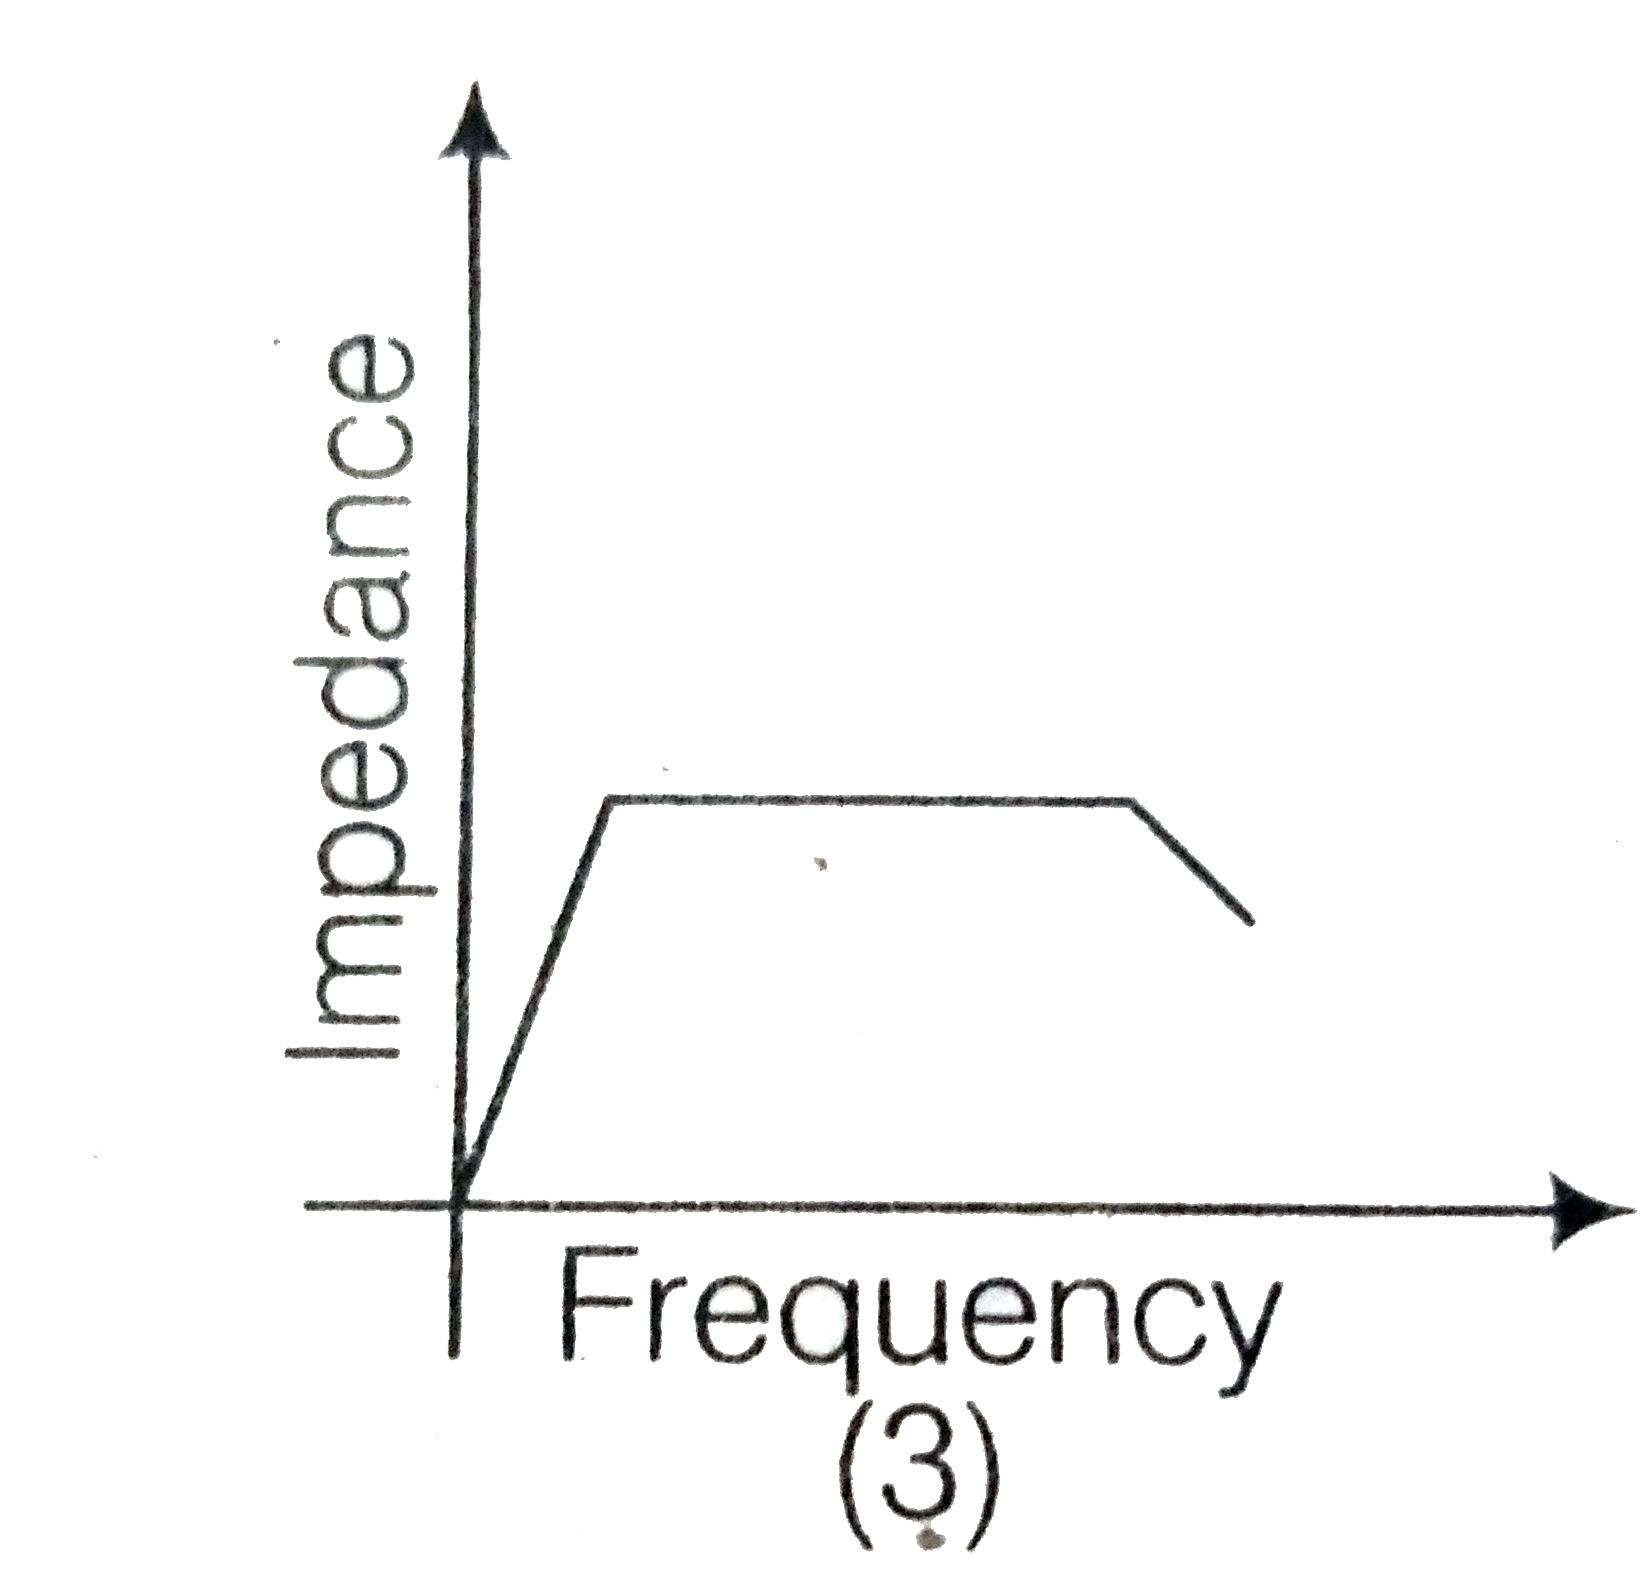 D
D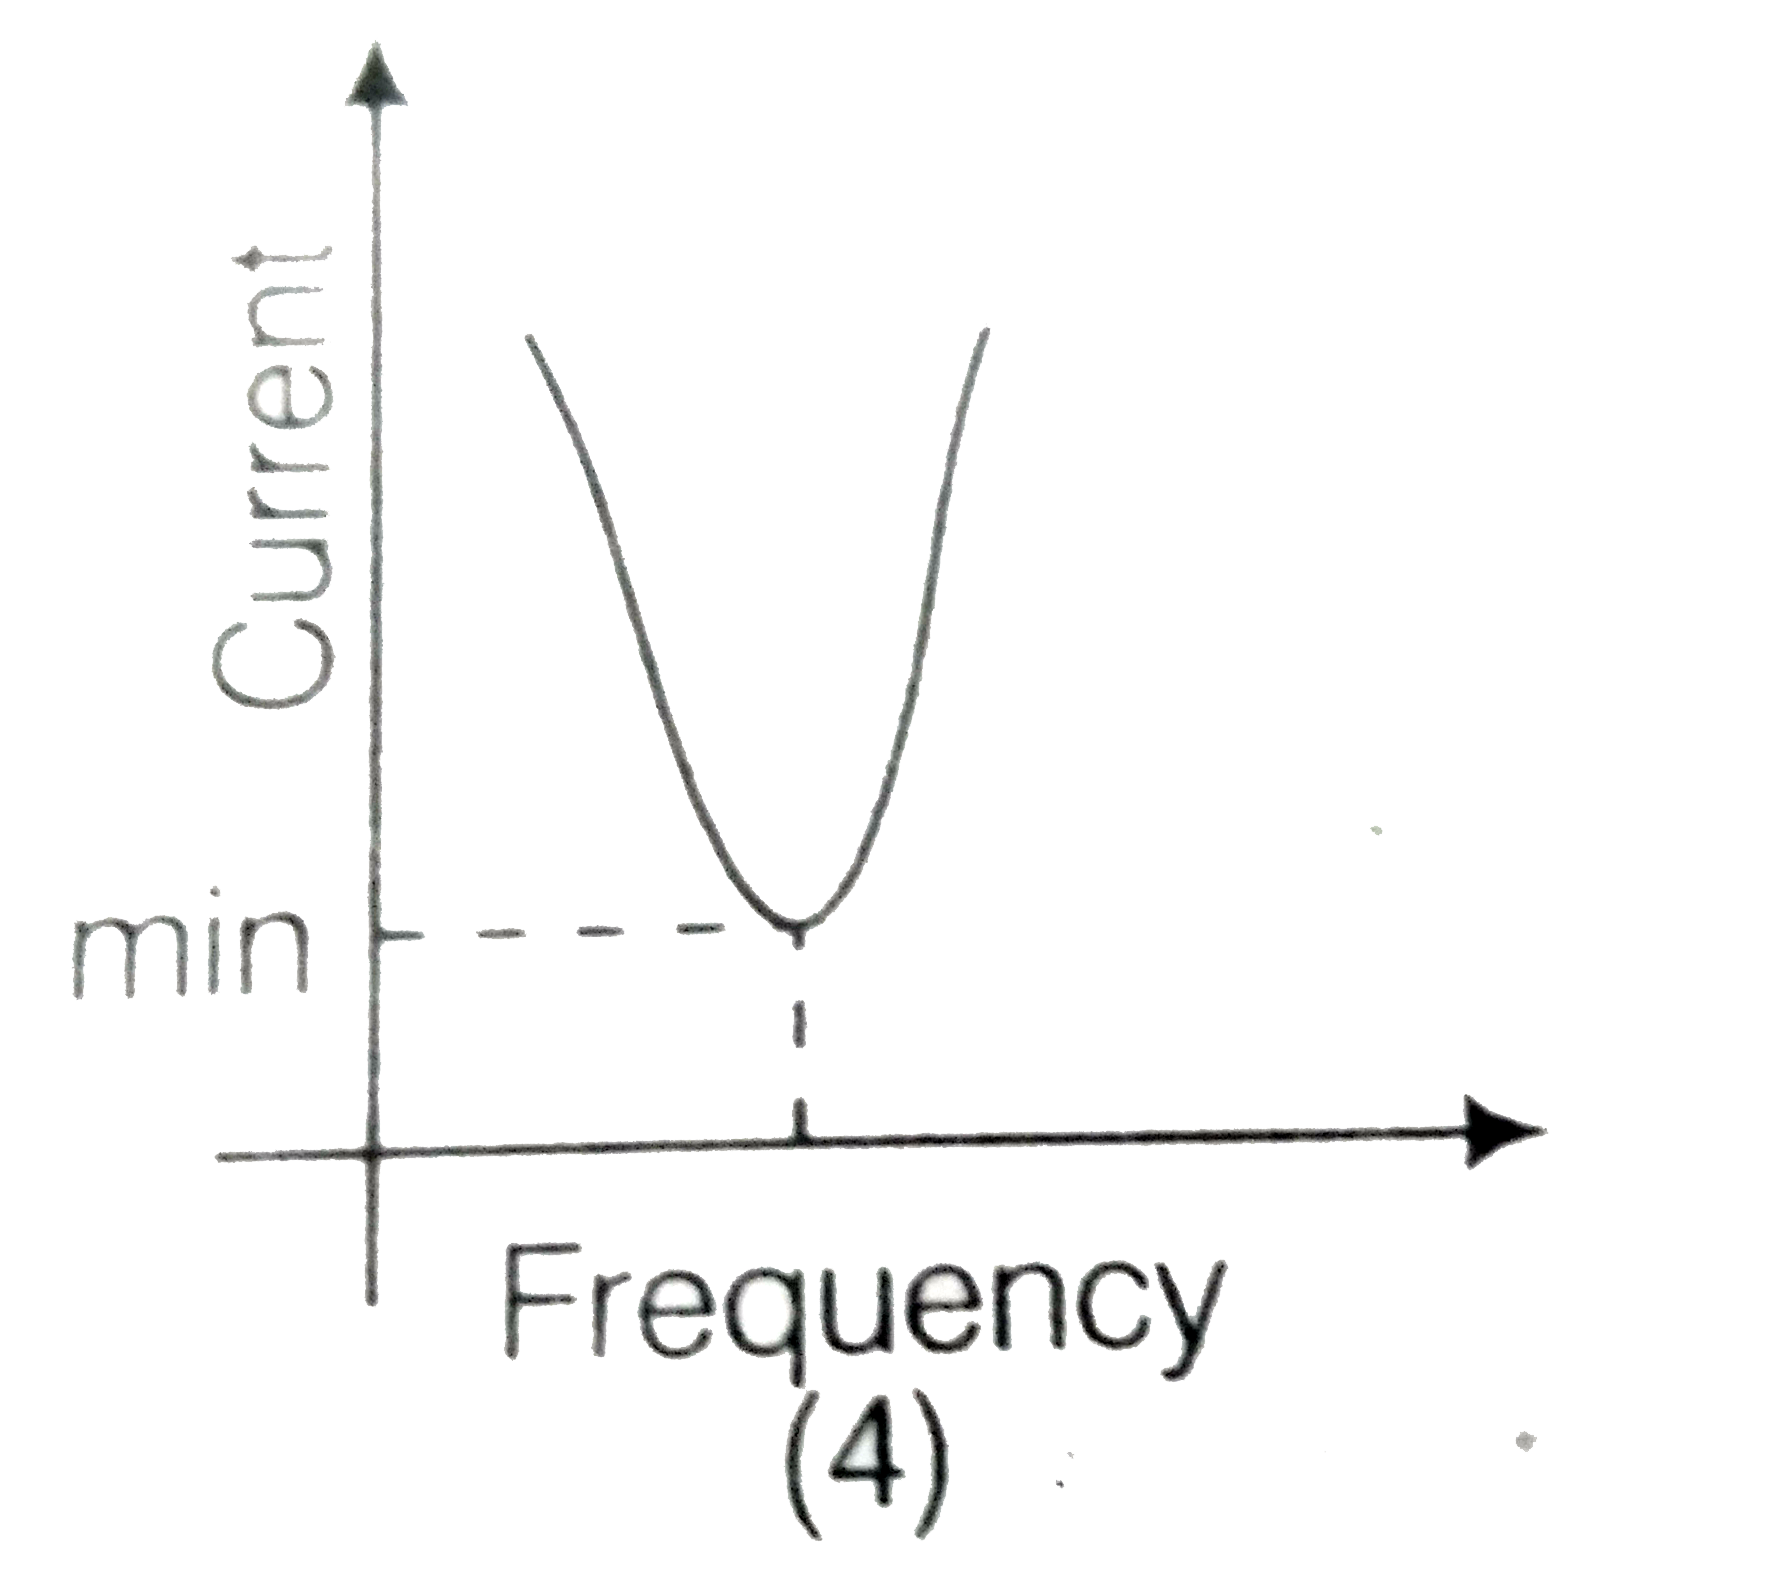
Out of the following graphs, which grpahs shows the correct relation (graphical representation) for LC parallel resonant circuit ?
View SolutionWhich of the following speed-time graphs is not possible:
View SolutionWhich of the following distance-time graphs is not possible?
View SolutionWhich of the following velocity-time graph is not possible?
View SolutionWhich of the following time-displacement graphs is not possible in nature?
View Solution


