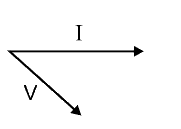
Which of the following figure showing the phase relationship is correct phase diagram for an R–C circuit-
A
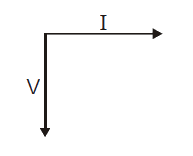
B
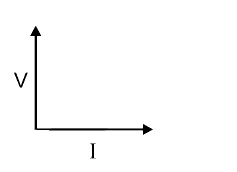
C
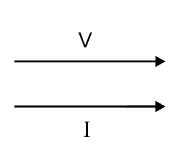
D
Video Solution
Text Solution
The correct Answer is:D
|
Answer
Step by step video, text & image solution for Which of the following figure showing the phase relationship is correct phase diagram for an R–C circuit- by Physics experts to help you in doubts & scoring excellent marks in Class 12 exams.
Updated on:21/07/2023Similar Questions
Knowledge Check
Which of the following pair does not show correct relationship ?
AB.O.=12(Nb−Na)BB.O.∝1Bond lengthCB.O.∝1Bond dissociation energyDNb>Na,B.O.=+veWhich of the following formulae does not show the correct relationship ?
AB.O.=12(Nb−Na)BB.O.∝1Bond lengthCB.O.∝1Bond dissociation energyDNb>Na,B.O.=+veWhich of the following figures correctly shows the phase relation between the input signal and the output signal of triode amplifier
A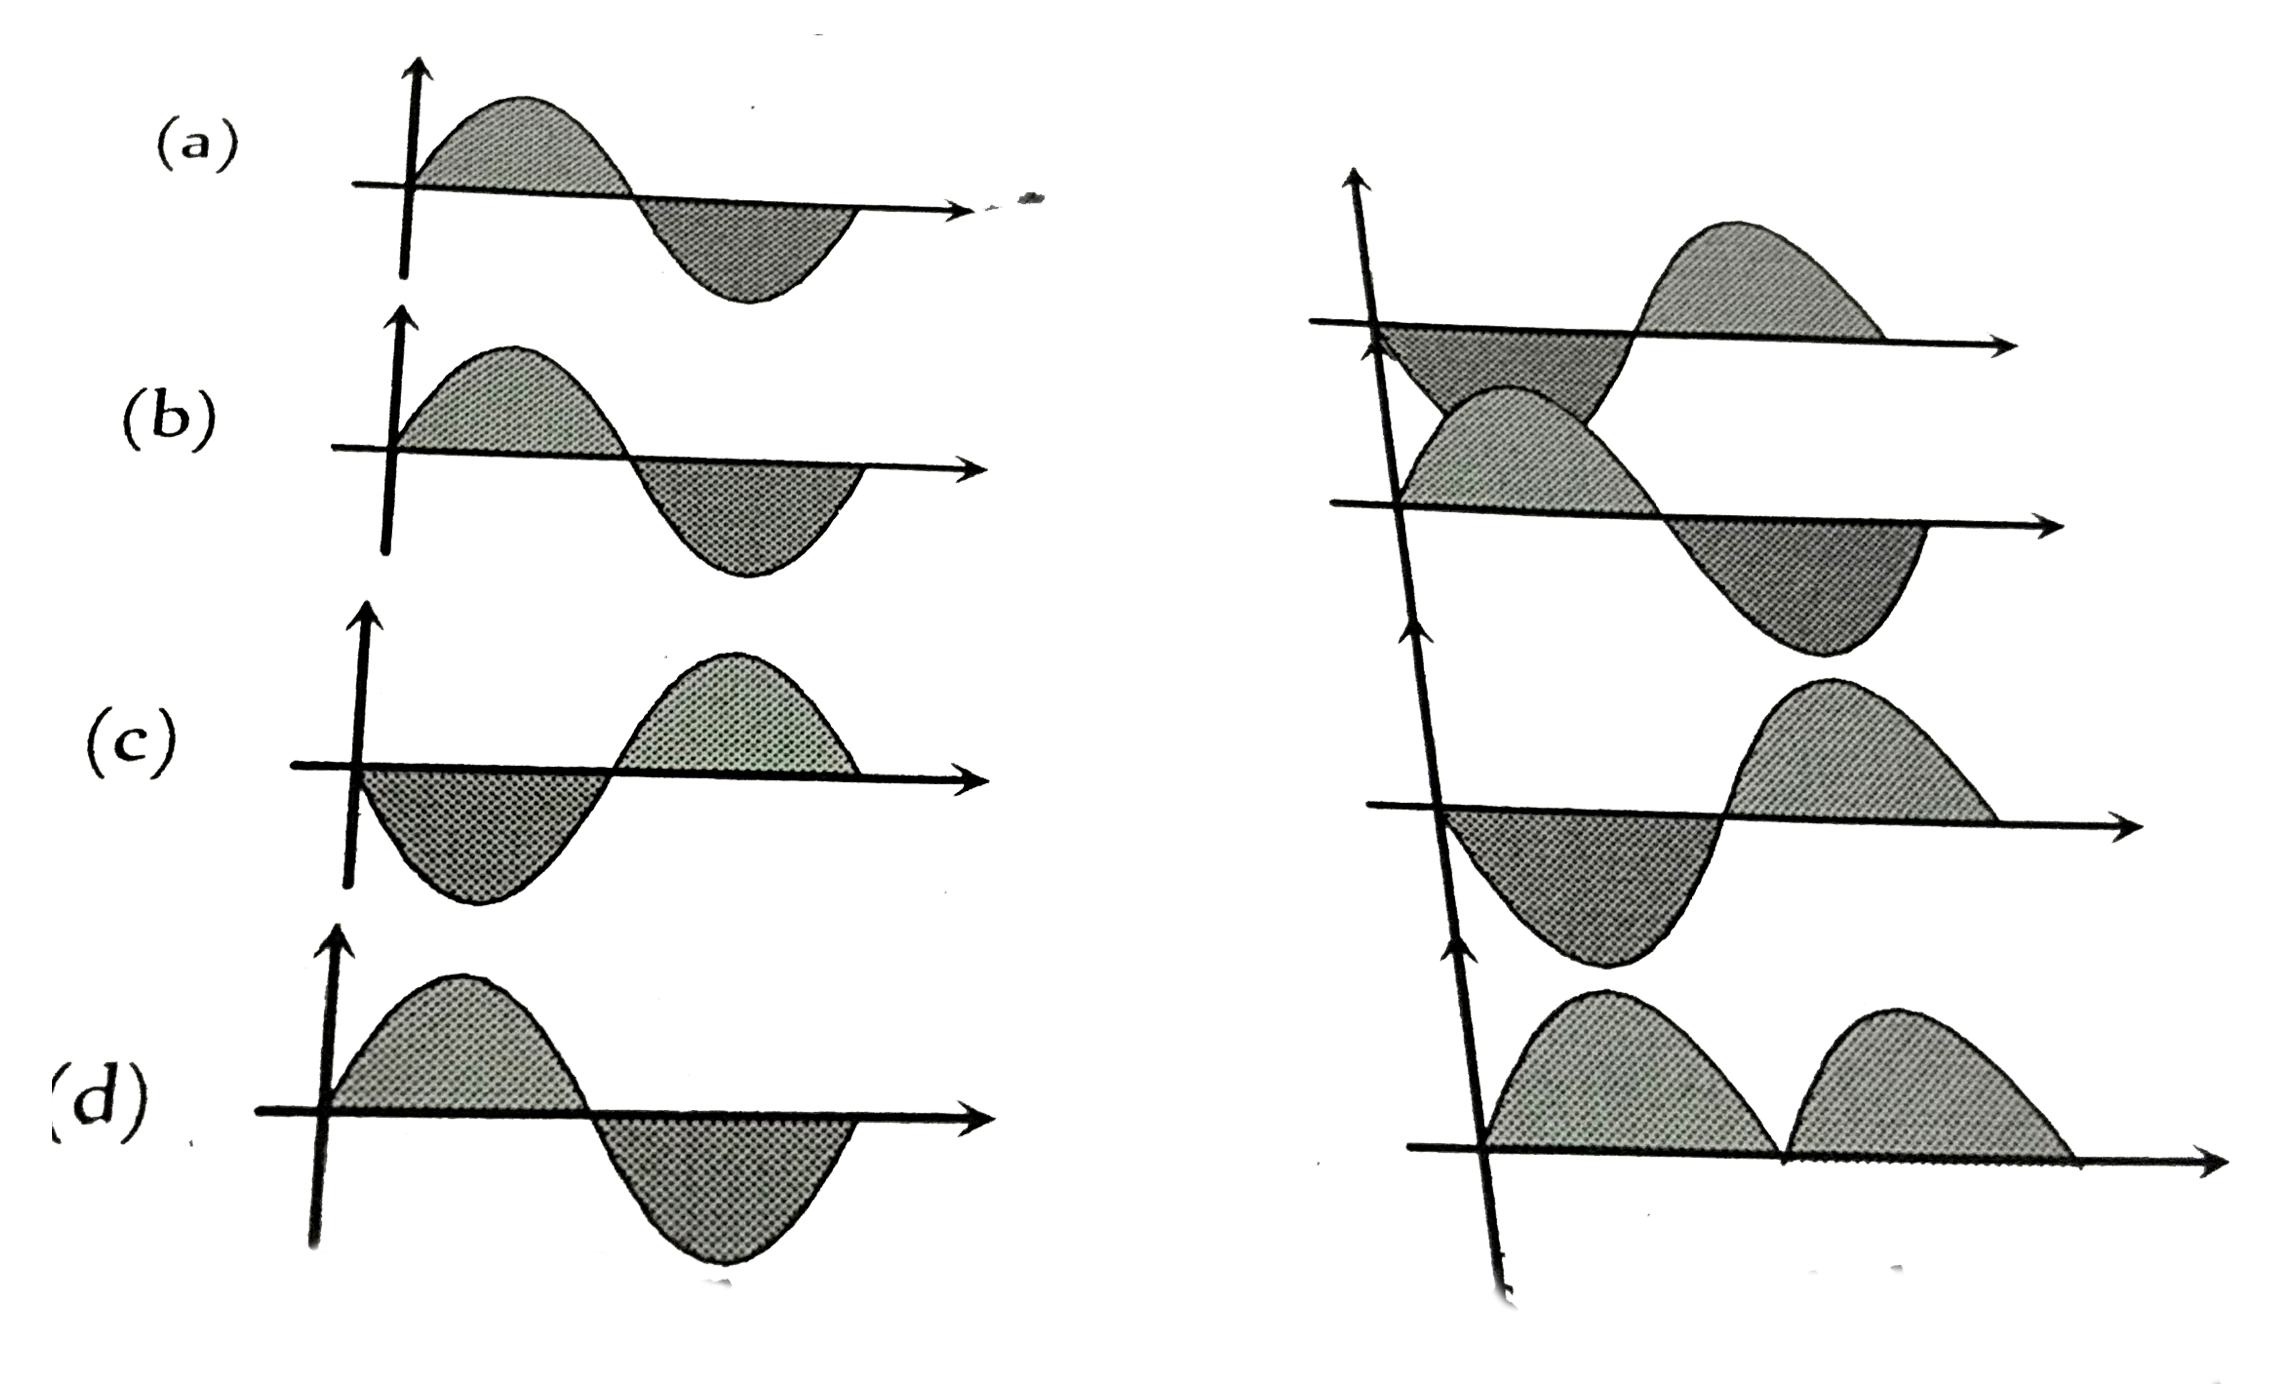 B
B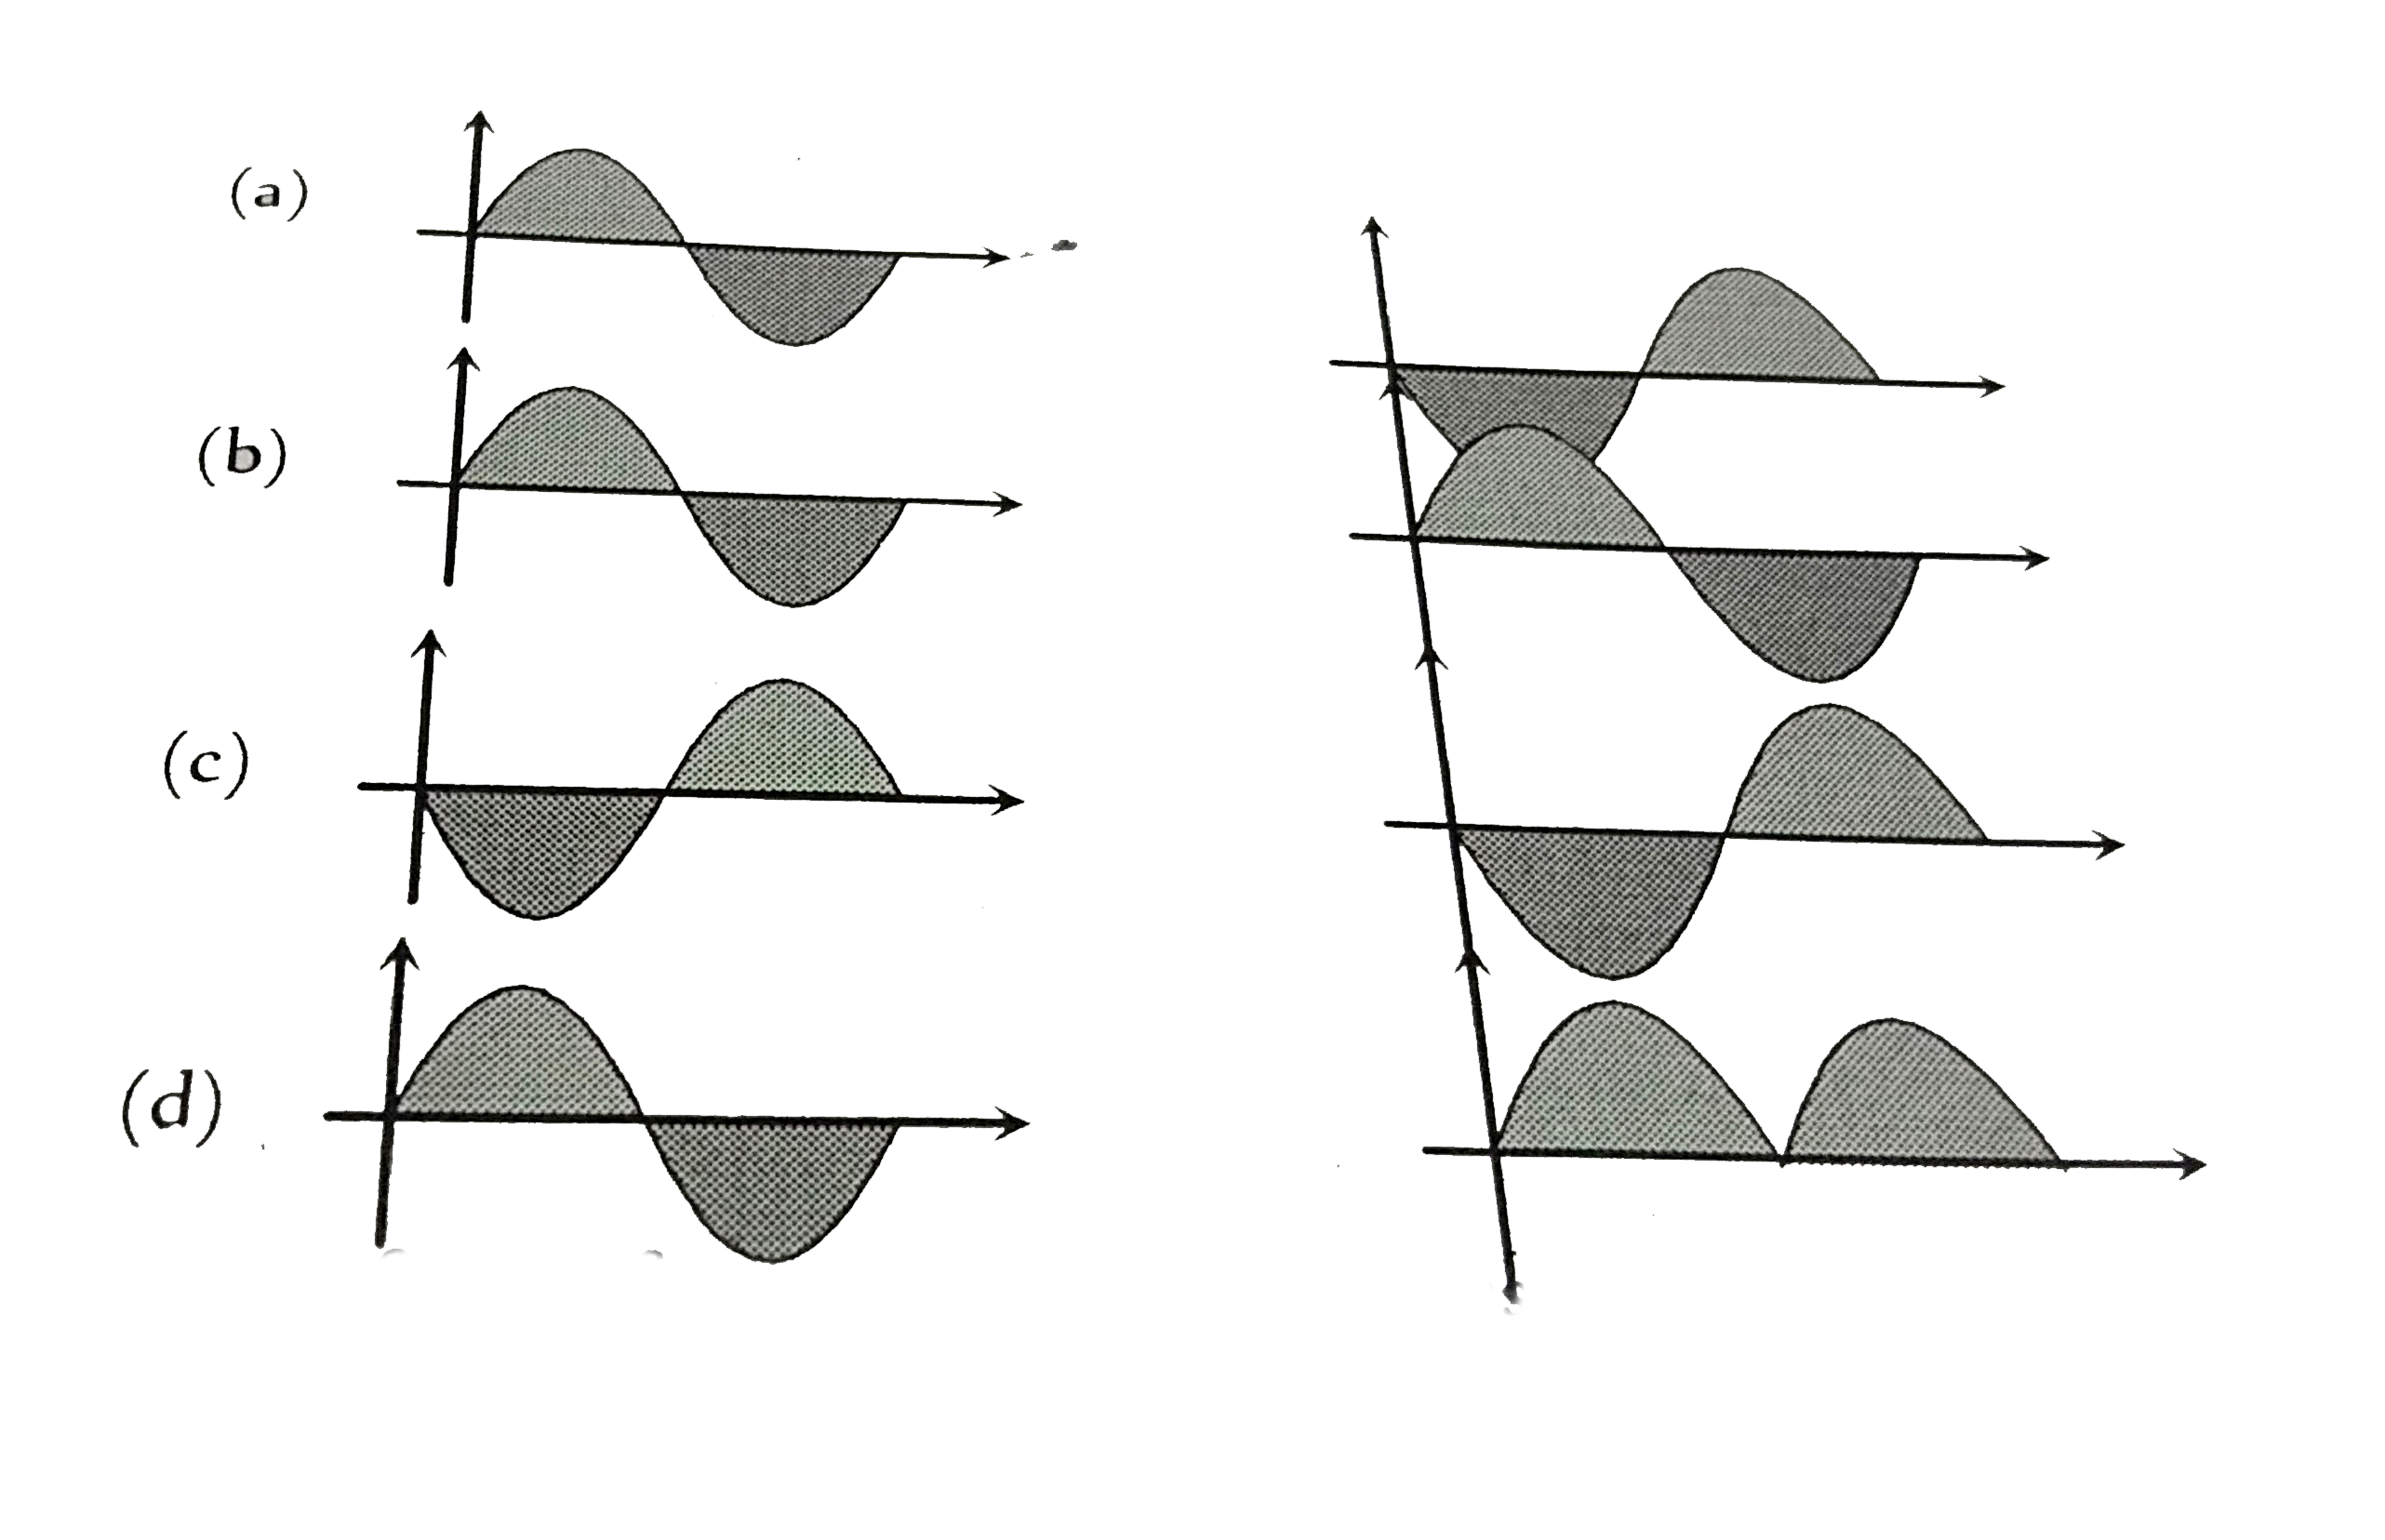 C
C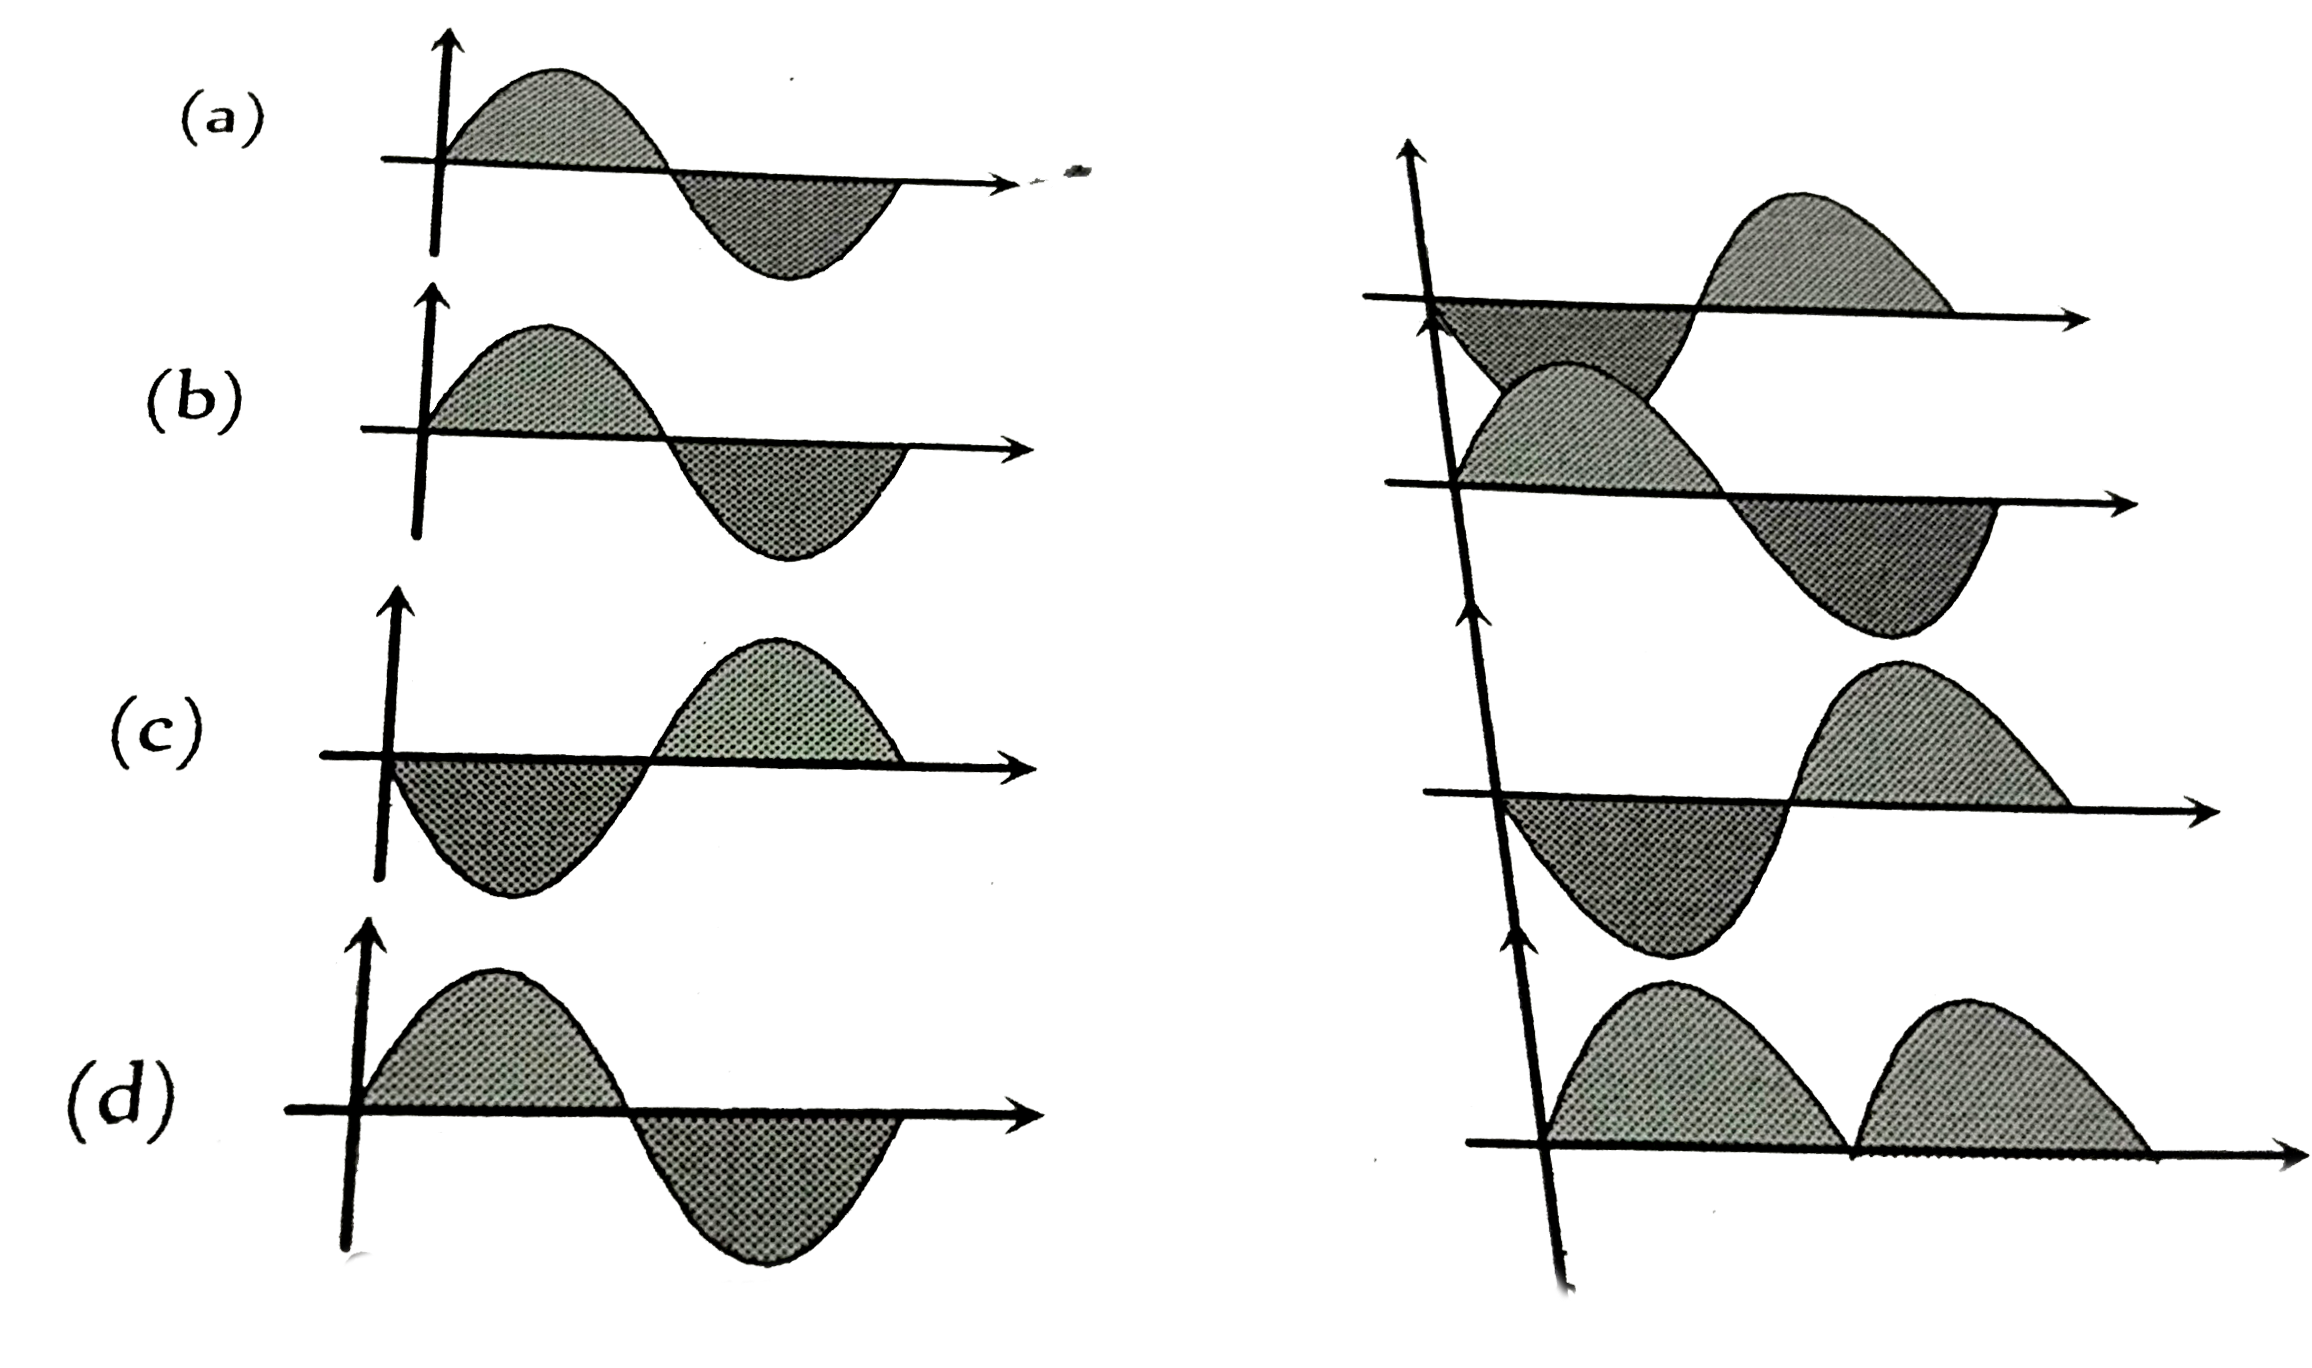 D
D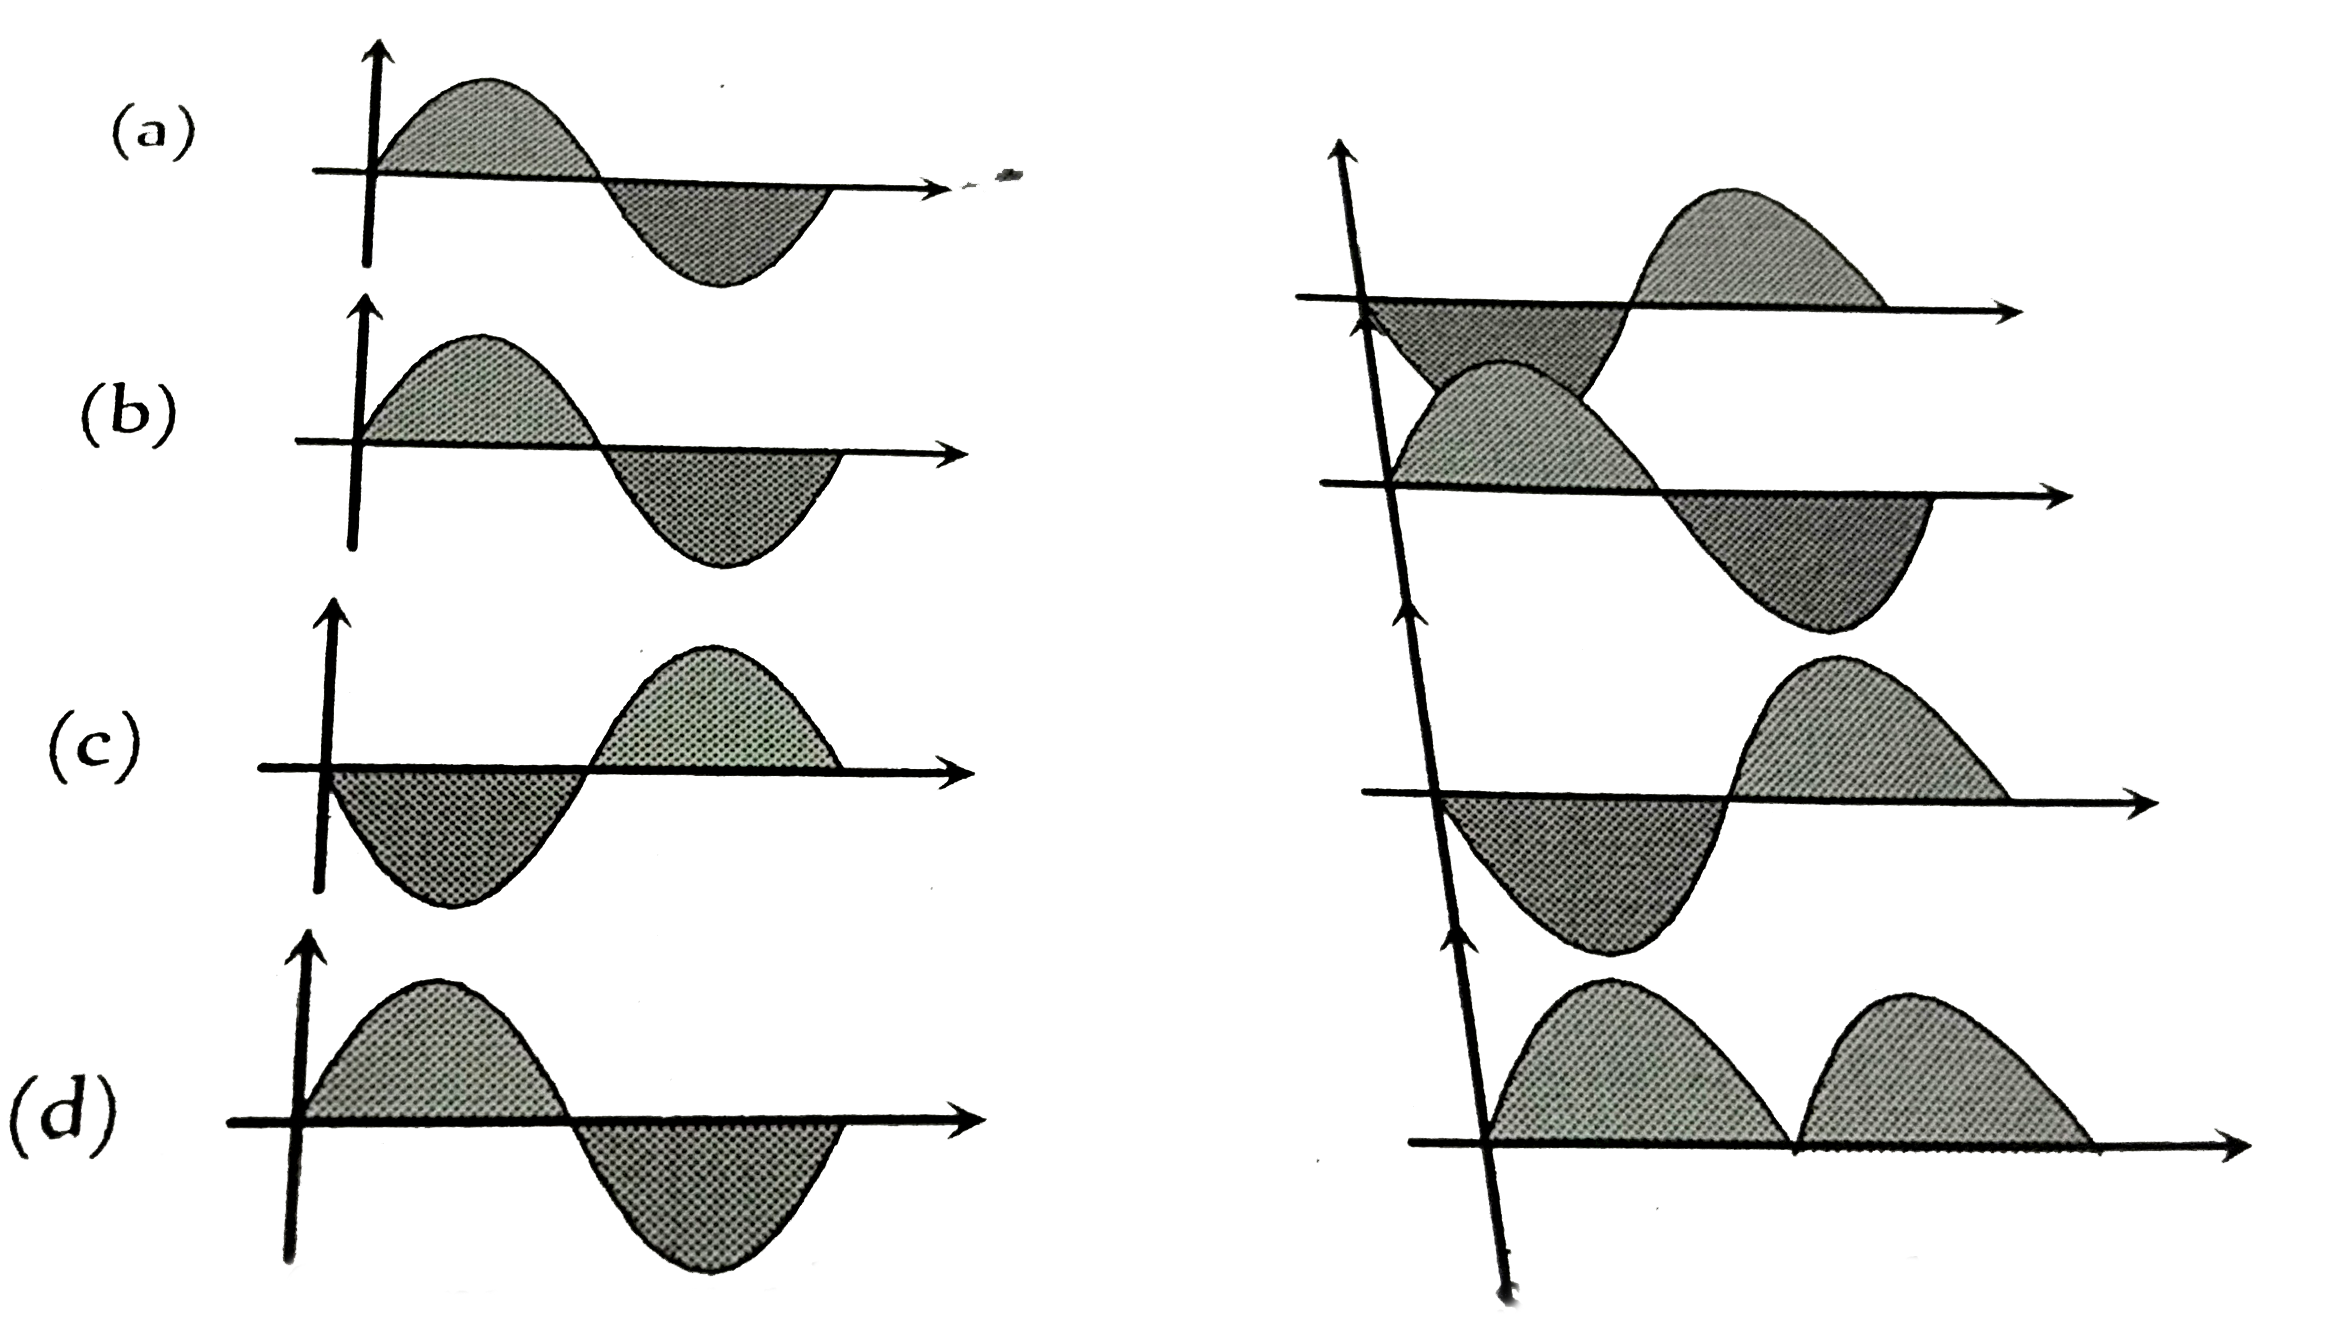
Which of the following show linkage group in coupling phase :-
View SolutionWhich of the following is correct about phases of the cell cycle ?
View SolutionWhich of the following graphs is the correct phase diagram of a substance whose melting point increases with pressure ?
View SolutionWhich of the following shows the correct order of decreasing basicity in gas phase?
View SolutionFollowing is wrong about a phase diagram .
View Solution


