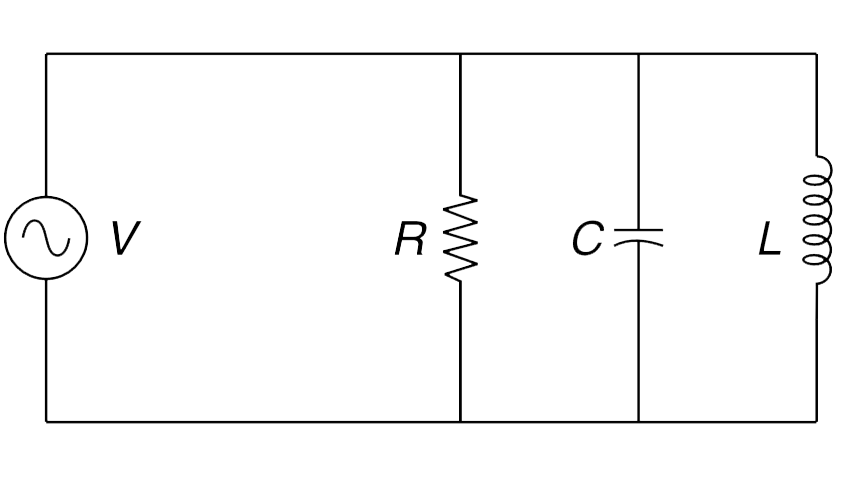
Figure shows the variation of voltage with time for an ac I=I0sinωt flowing through a circuit -
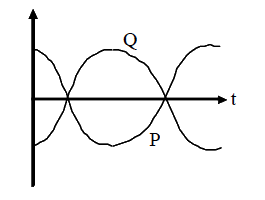
Curve P is for R–L and Q for R–C circuit
Curve P is for R–C and Q for R–L circuit
Both are for R–C circuit
Both are for R–L circuit
The correct Answer is:A
Step by step video, text & image solution for Figure shows the variation of voltage with time for an ac I=I_(0) sin omegat flowing through a circuit - by Physics experts to help you in doubts & scoring excellent marks in Class 12 exams.
Similar Questions
Knowledge Check
- Question 1 - Select One or More
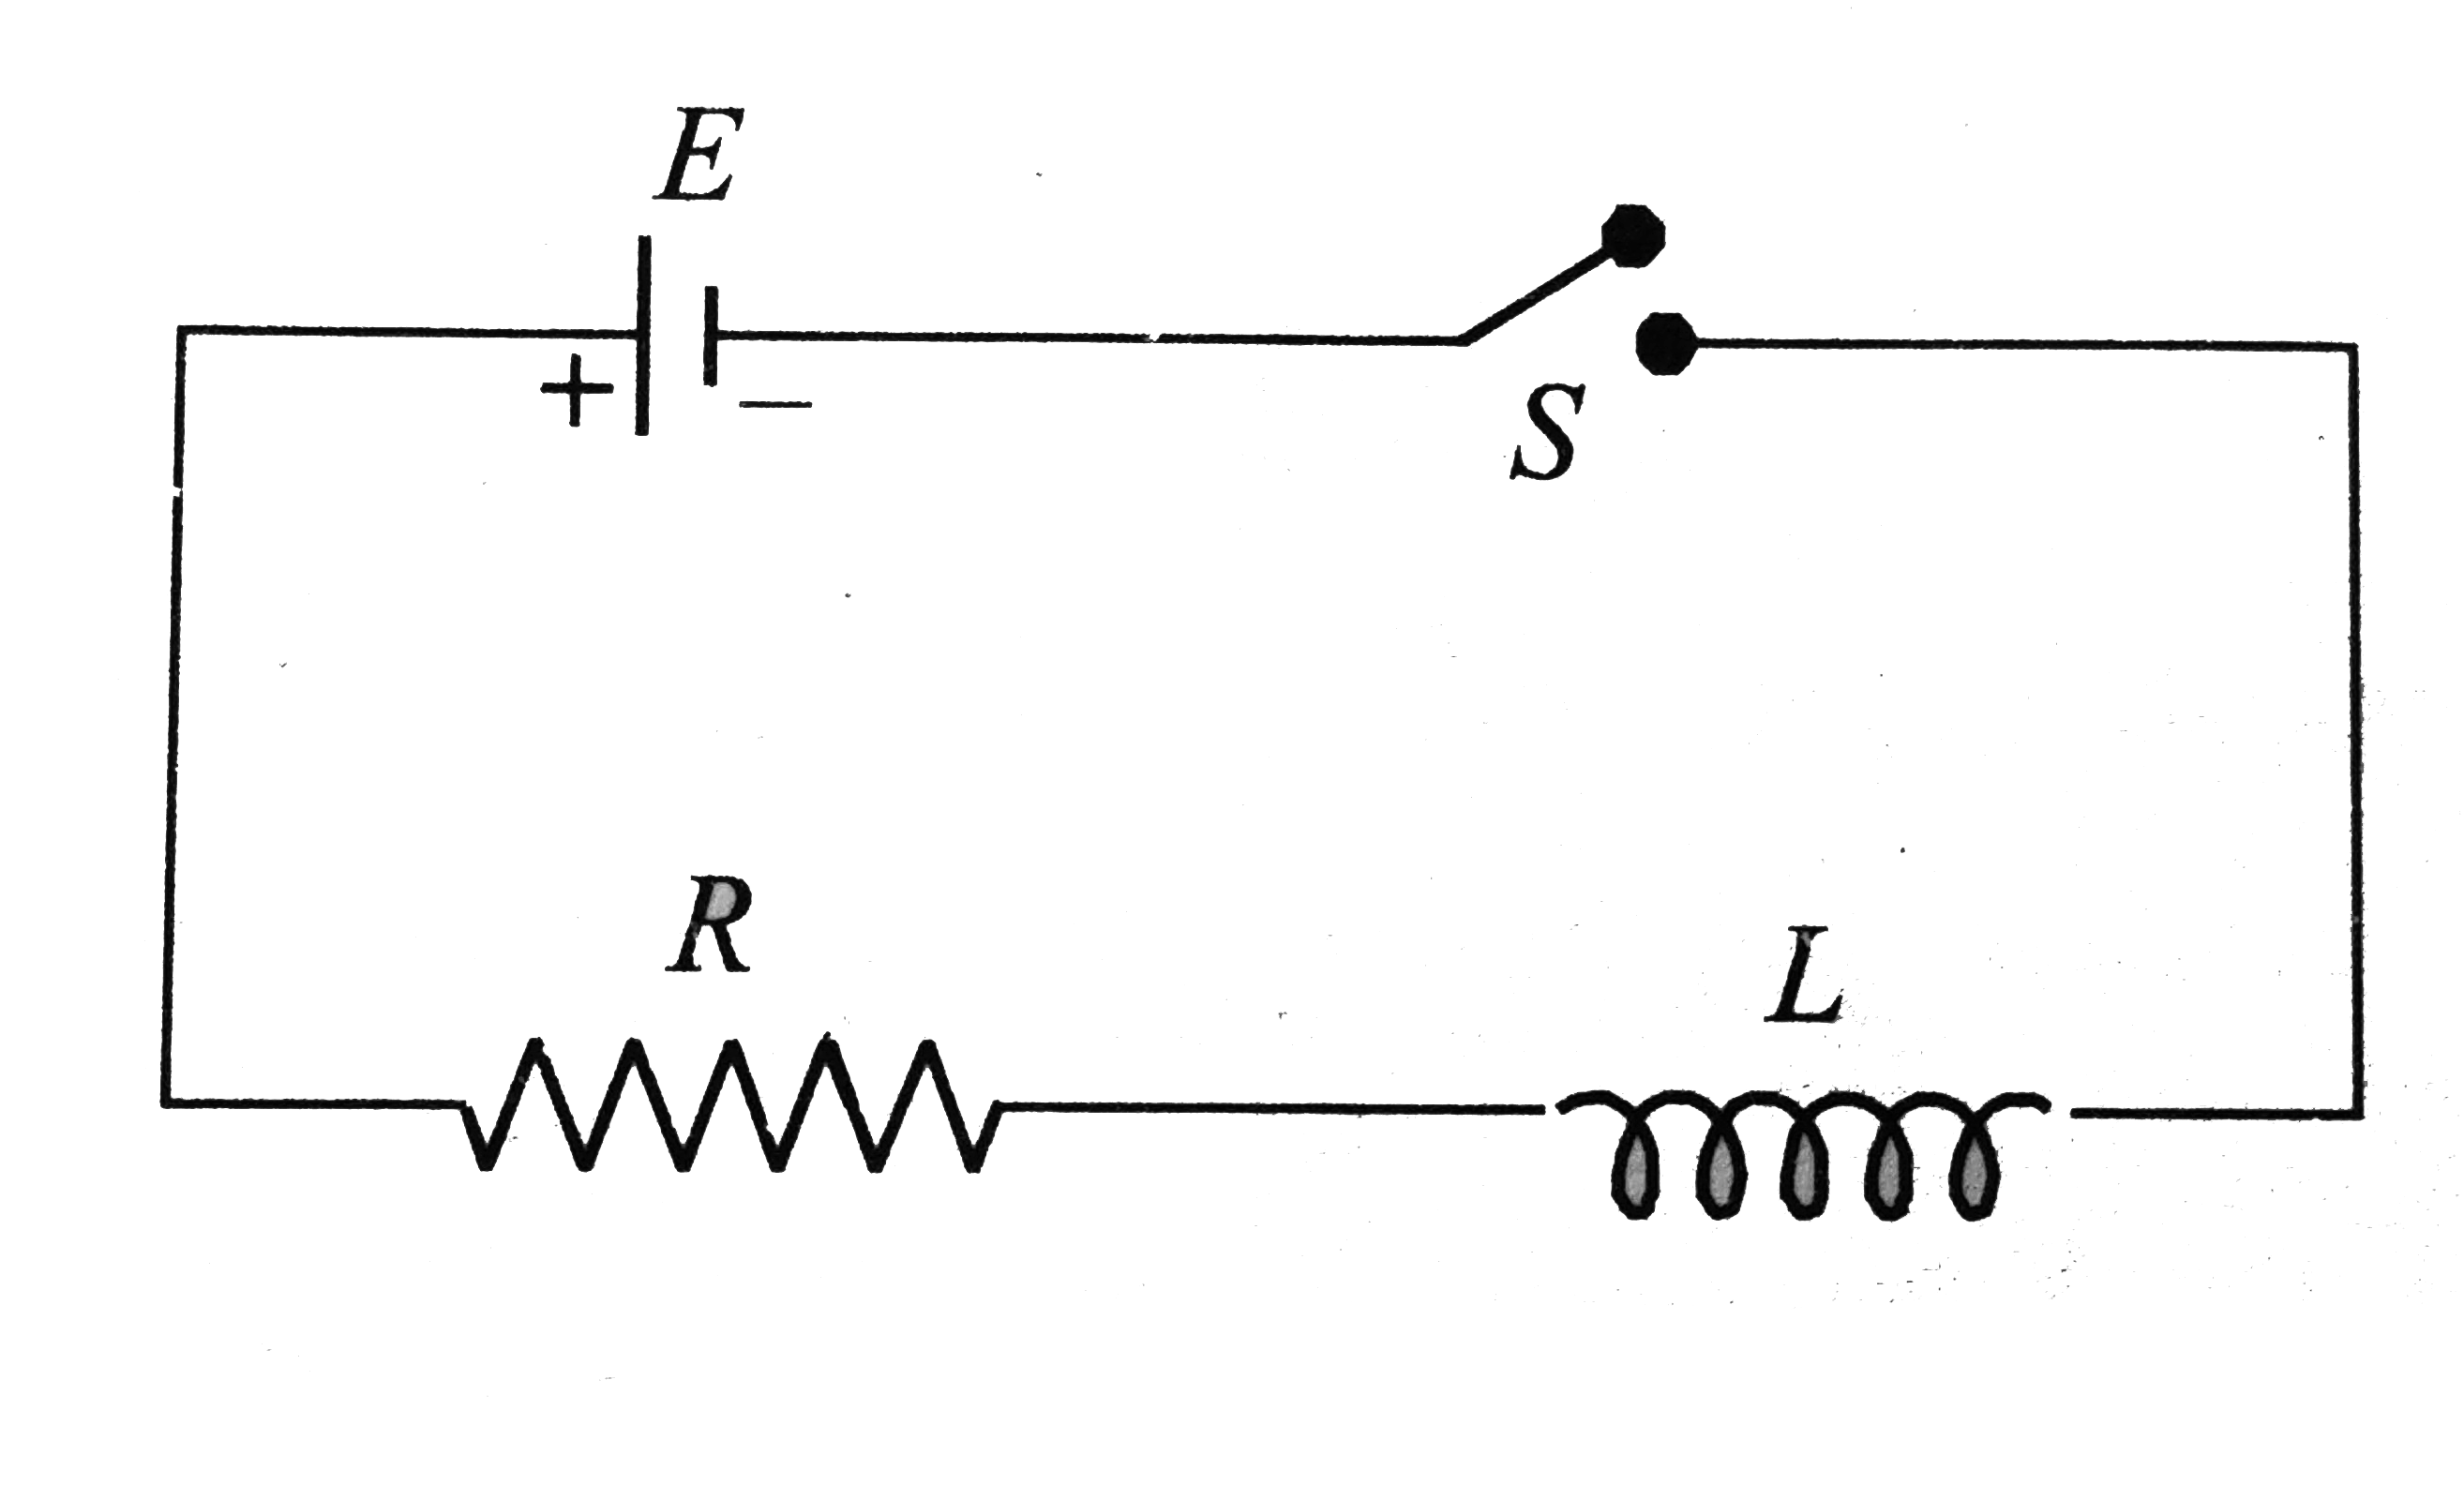
Switch S of the circuit shows in Fig is closed at t=0. If e denotes the induced emf in L and I is the current flowing through the circuit the circuit at time t, which of the following graphs is//are correct?
 A
A B
B C
C D
D
- Question 2 - Select One
Switch S of the circuit shows in Fig. is closed at t=0. If e denotes the induced emf in L and i the current flowing through the circuit at time t, then which of the following graphs correctly represents the variation of e with i?
 A
A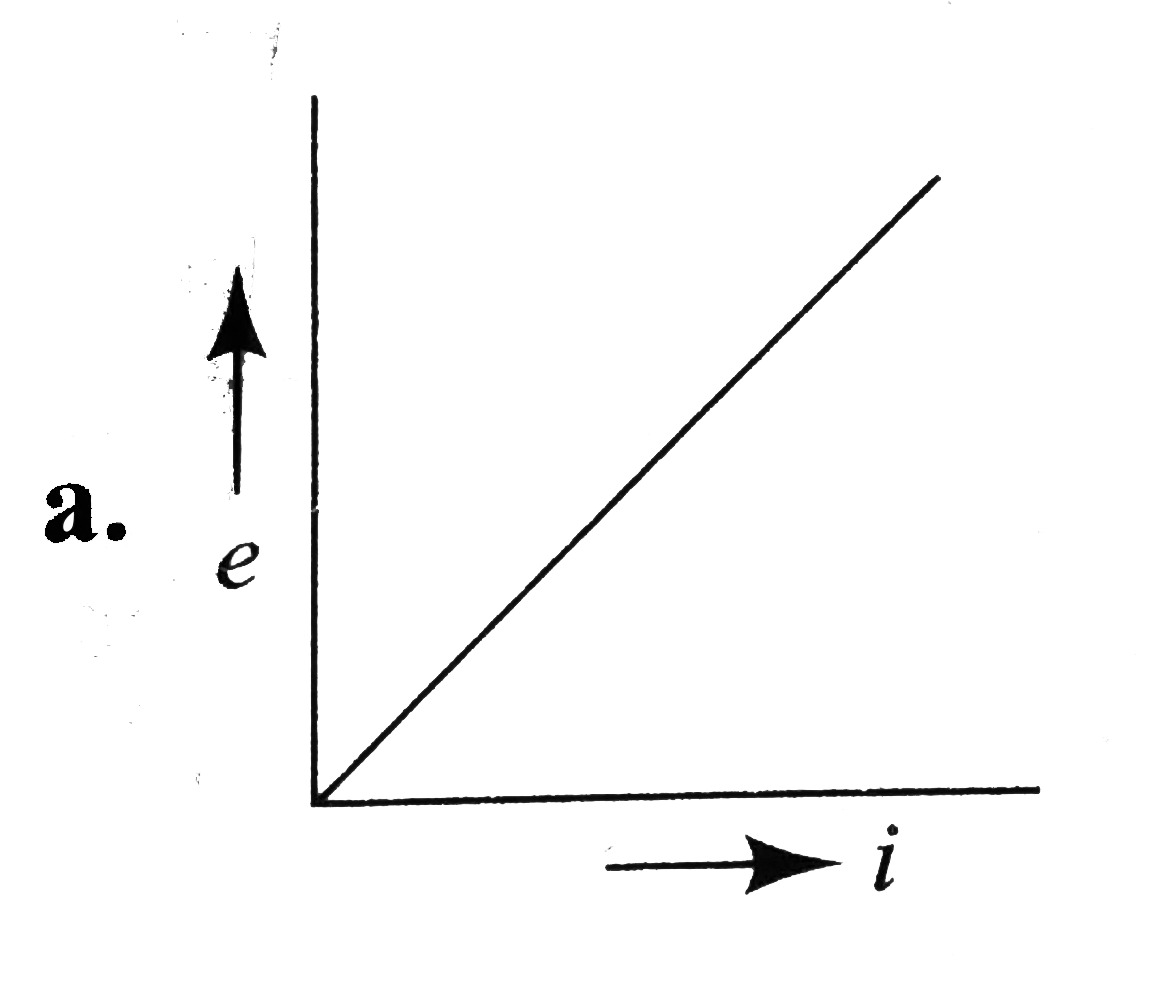 B
B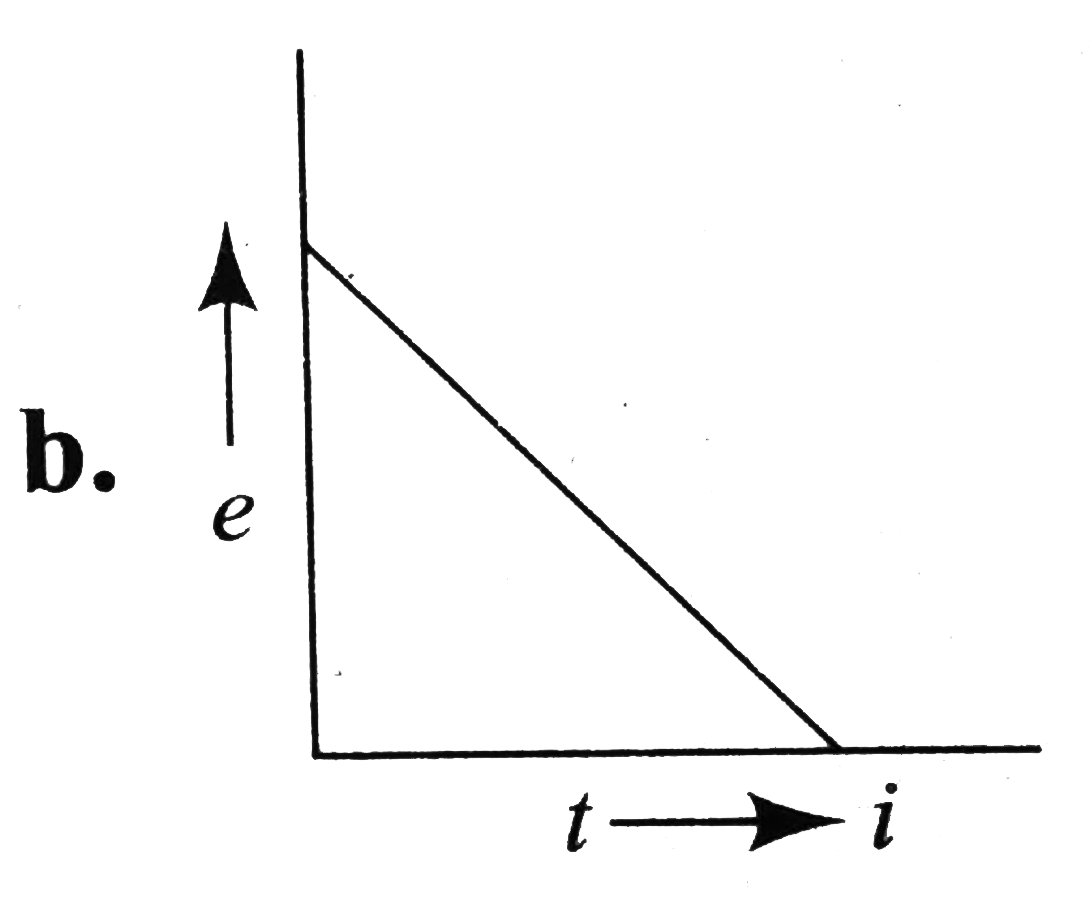 C
C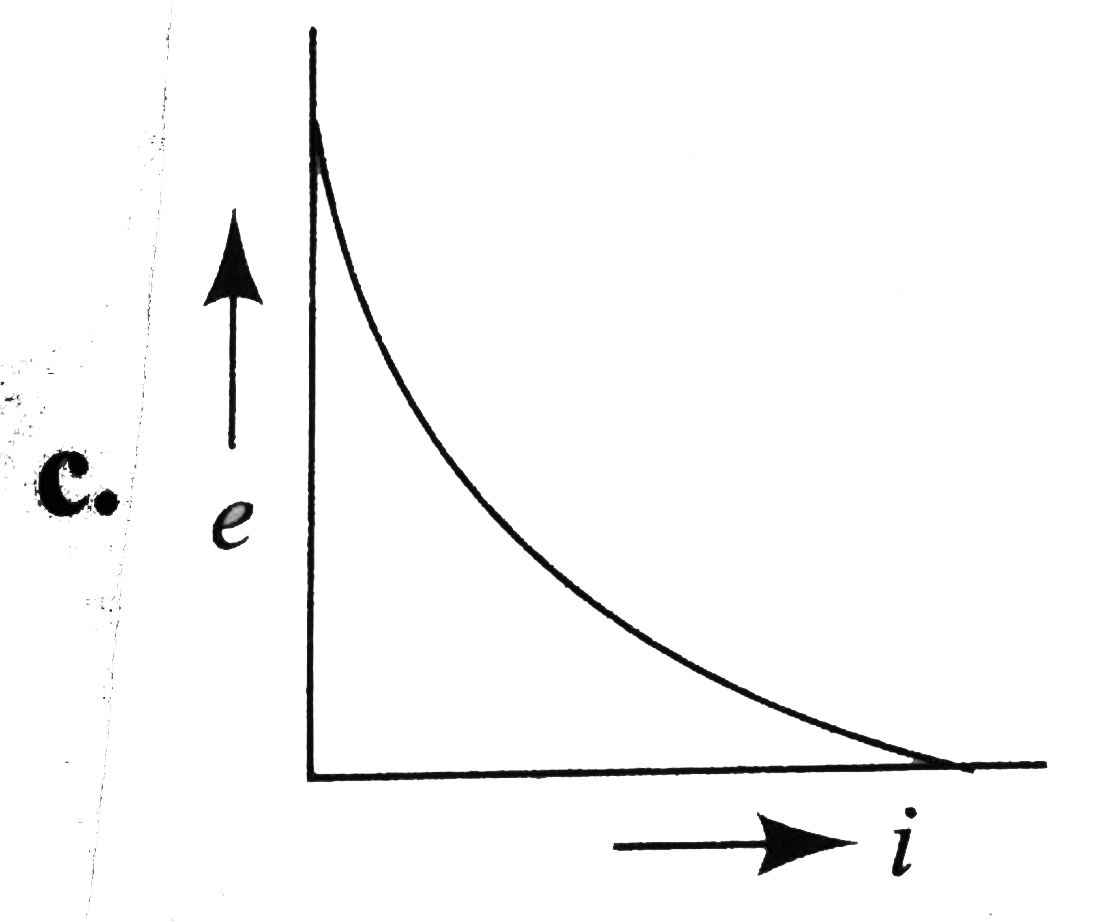 D
D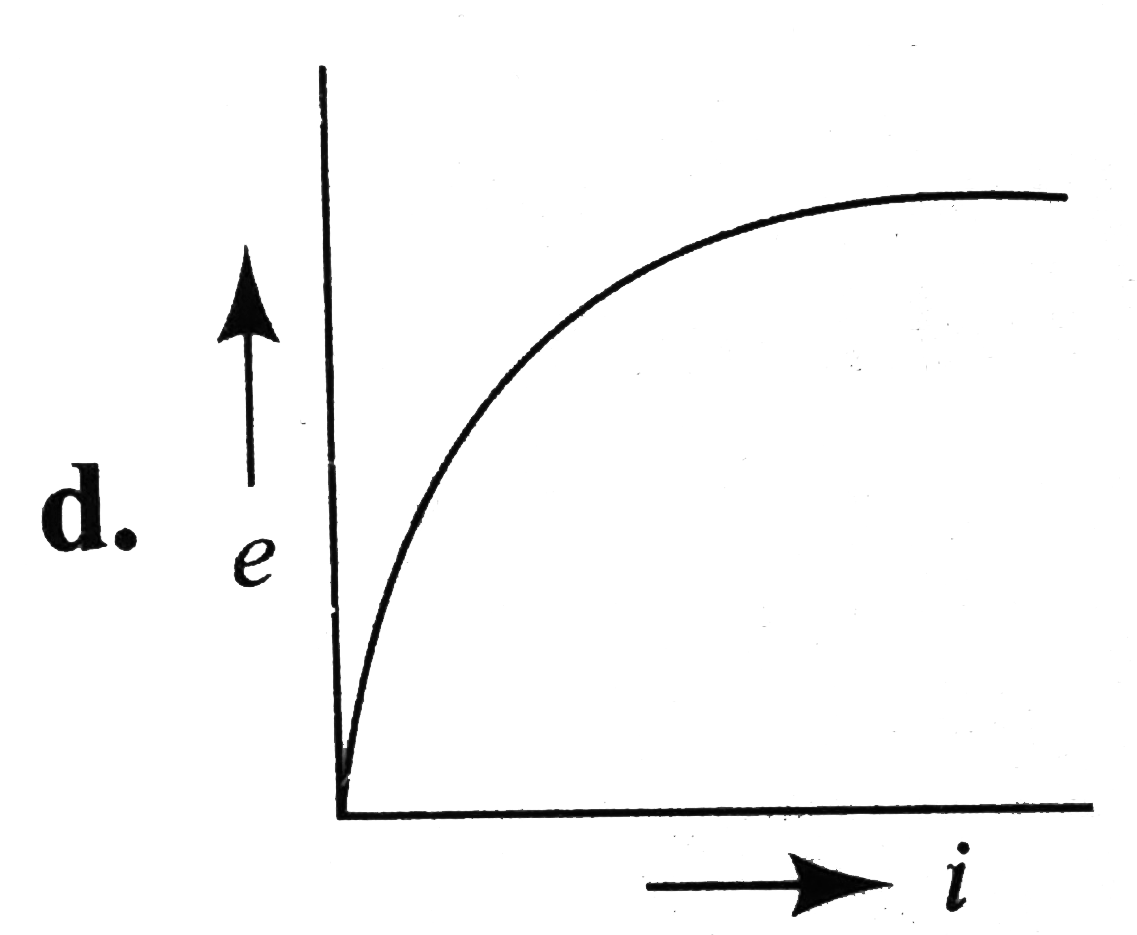
- Question 3 - Select One
AC source represented as V = V0sinωt is applied to a circuit and current I = I0sin(ωt+π/2) is found to flow through the circuit . What will be average power consumed in the circuit ?
AV0I0BV0I02CV0I0√2D0
A circuit with capacitance C and inductance L generates free damped oscillations with current varying with time as I=Ime−βtsinωt. Find the voltage across the capacitor as a function of time, and in particular, at the moment t=0.
View SolutionA device X is connected across an ac source of voltage V=V0sinωt. The current throught X is given as I=I0sin(ωt+π2)
(a) Identify the device X and write the expression for its reactance.
(b) Draw graph showing variation of voltage and current with time over one cycle of ac, for X.
How does the reactance of the device X vary with frequency of the ac? Show this variation graphically.
(d) Draw the phasor diagram for the device X.View SolutionA device X is connected across an a.c. source of voltage V=Vmsinωt. The current through X is given asI=I∘sin(ωt+π2)
(a) Identify the device X and write the expression for its reactance.
(b) Draw graphs showing variation of voltage and current with time over one cycle of a.c. for X.
(C) How does the reactance of the device X vary with frequency of the a.c. ? Show this variation graphically.
(d) Draw the phasor diagram for the device X.View SolutionThe average value of alternating current I=I0sinωt in time interval [0,πω] is
View SolutionWhich one of the following graphs in figure shows the variation of photoelectric current (I) with voltage (V) between the electrodes in a photoelectric cell?
View Solution


