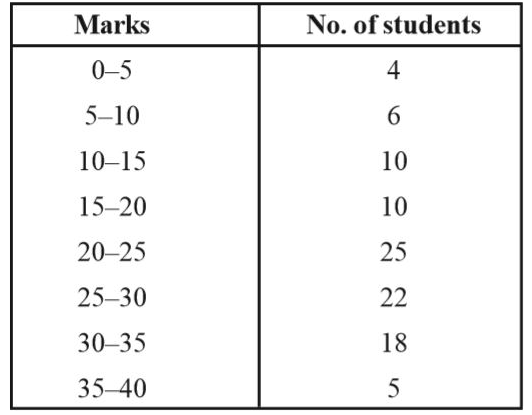
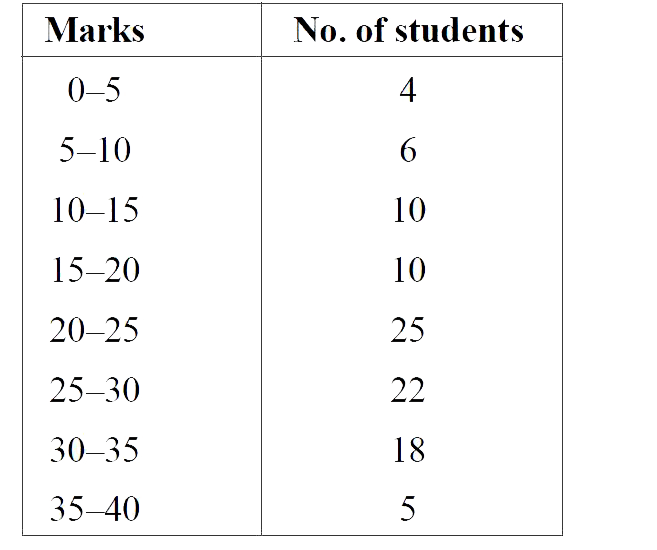
The distribution given below show the marks of 100 students of a class:
then find Ogive medium of data

The correct Answer is:Ogive medium 24 (approximates ) from graph
Topper's Solved these Questions
- PRACTICE PAPER IIBOOK - CBSE COMPLEMENTARY MATERIALCHAPTER - PRACTICE PAPER IIEXERCISE - SECTION B
7 Videos
- POLYNOMIALSBOOK - CBSE COMPLEMENTARY MATERIALCHAPTER - POLYNOMIALSEXERCISE - Practice test
10 Videos
- PRACTICE PAPER- I (WITH SOLUTIONS) CLASS: X Mathematics (Standard)BOOK - CBSE COMPLEMENTARY MATERIALCHAPTER - PRACTICE PAPER- I (WITH SOLUTIONS) CLASS: X Mathematics (Standard)EXERCISE - SECTION -D
6 Videos
Similar Questions
The distribution given below show the marks of 100 students of a class.

Draw a less than type and a more than type ogive from the given data. Hence obtain the median marks from the graph.
View SolutionThe distribution given below, shows the marks obtained by 25 students in an aptitude test. Find the median and mode of the distribution.
View Solution
Knowledge Check
The table given below shows the marks obtained by 80 students of a class in a test with maximum marks 100 .

A student of the class is selected at random .
Find the probability that he gets
(i) less than 15% marks ,
(ii) 60 or more marks and
(iii) less than 45 marks .A340, 14, 920B740, 34, 320C940, 34, 1120D1740, 14, 1720
The table given below shows the marks obtained by 50 students of a class in a test with maximum 2. marks 100.

A student of the class is selected at random. Find the probability that the selected student gets
less than 15% marks
View SolutionThe table given below shows the marks obtained by 50 students of a class in a test with maximum marks 100.

A student of the class is selected at random. Find the probability that the selected student gets
60% or more marks
View SolutionThe table given below shows the marks obtained by 50 students of a class in a test with maximum marks 100.

A student of the class is selected at random. Find the probability that the selected student gets
marks equal to or greater than 45% but less than 60%.
View SolutionGiven below is a cumulative frequency distribution showing the mars secured by 50 students of a class

From the frequency distribution table for the data.
View SolutionGiven below is a cumulative frequency distribution showing the mars secured by 50 students of a class

From the frequency distribution table for the data.
View SolutionThe following table shows frequency distribution of marks of 100 students of 10th class which they obtianed in a practice examination. Find the median of the marks.

View SolutionThe following table shows the marks obtained by 100 students of a class in a school during a particular academic session. Find the modal marks.

View Solution
