A TV survey gives the following data for TV watching : 60% watch program A , 50% watch program B, 47% watch program C,28% watch program A & B, 23% watch program A & C, 18%watch program B & C, 8% watch programs A,B & C. Draw a Venn diagram to illustrate this information & find(i) What percentage watch programs A & B but not C (ii) What percentage watch exactly two programs.
Step by step video & image solution for A TV survey gives the following data for TV watching : 60% watch program A , 50% watch program B, 47% watch program C,28% watch program A & B, 23% watch program A & C, 18%watch program B & C, 8% watch programs A,B & C. Draw a Venn diagram to illustrate this information & find(i) What percentage watch programs A & B but not C (ii) What percentage watch exactly two programs. by Maths experts to help you in doubts & scoring excellent marks in Class 12 exams.
Updated on:21/07/2023Similar Questions
A T.V survey gives the following data for T.V watching 59% of the people of watch program A, 67% of the people watch program B and x% of the people watch both the program, then
View Solutionएक टीवी सर्वेक्षण, टीवी दर्शकों के निम्नलिखित आँकड़े दर्शाता है 60% दर्शक कार्यक्रम A देखते हैं, 50% दर्शक कार्यक्रम B देखते हैं तथा 50% दर्शक कार्यक्रम C देखते हैं। 30% कार्यक्रम A तथा C देखते हैं। 10% तीनों कार्यक्रम देखते हैं। जो केवल दो कार्यक्रम देखते हैं ऐसे लोगों का प्रतिशत होगा
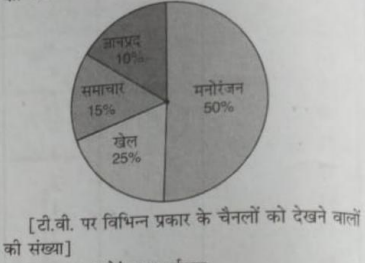
View SolutionThe pie chart below is showing information for viewers watching different types of channels on TV. Which type of programs are watched by the most people?
View Solutionin a survey of 500 TV views , it was found that 285 watch cricket , 195 watch football and 115 watch tannis . also , 45 watch both cricket and football, 70 watch both cricket and tennis and 50 watch football and tennis . if 50 do not watch any game on tv . then the no. of views watch all three games is ?
View SolutionA sells a watch to B and makes a loss of 12%. B dismakes a profit of 1212% by selling the watch to C. If A sells the watch to B at the cost of which C pruchased it, then the percentage of profit or loss is
View Solutionएक टीवी सर्वेक्षण, टीवी दर्शकों के निम्नलिखित आँकड़े दर्शाता है 60% दर्शक कार्यक्रम A देखते हैं, 50% दर्शक कार्यक्रम B देखते हैं तथा 50% दर्शक कार्यक्रम C देखते हैं। 30% कार्यक्रम A तथा C देखते हैं। 10% तीनों कार्यक्रम देखते हैं। जो केवल दो कार्यक्रम देखते हैं ऐसे लोगों का प्रतिशत होगा
View SolutionA sells a wath to B and makes a loss of 12%. B dismakes a profit of 1212% by selling the watch to C. If A sells the watch to B at the cost of which C pruchased it, then the percentage of profit is
View Solutionदिए हुए पाई चार्ट ( आकृति ) के आधार पर निम्नलिखित प्रश्नों के उत्तर दीजिए : किस प्रकार के कार्यक्रम सबसे अधिक देखे जाते हैं ?

View Solution
