Which of the following sketches is an isobars (Given : nRP>1 )
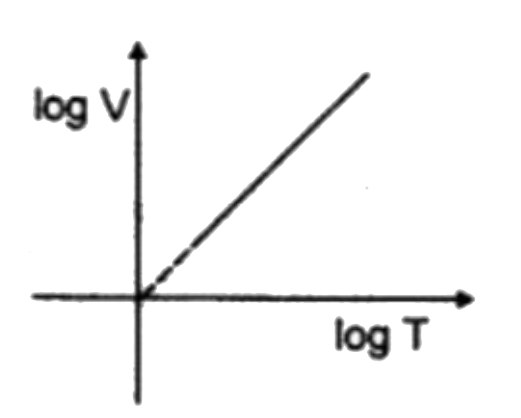
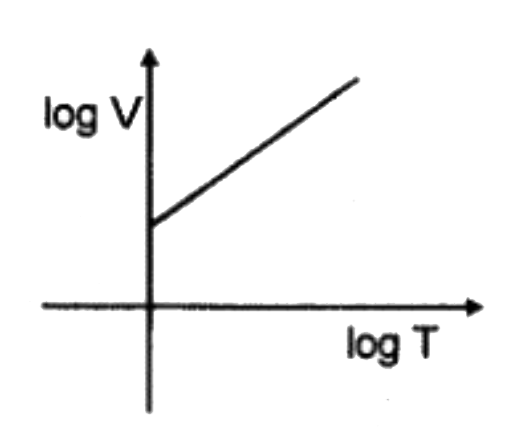
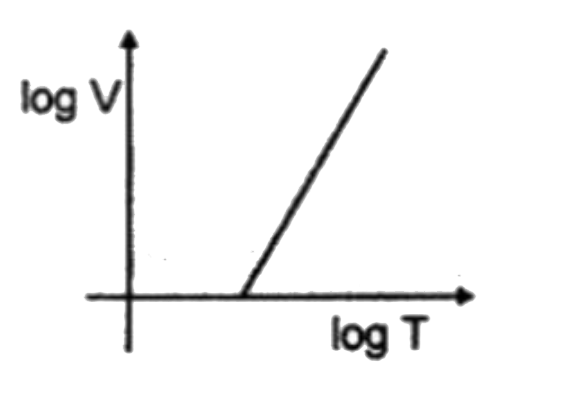
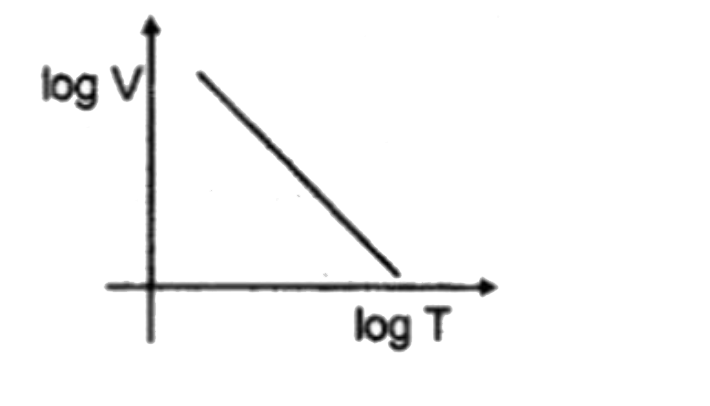
The correct Answer is:B
To determine which sketch represents an isobaric process given the condition (nR)/(P)>1, we can follow these steps:
1. Understanding Isobaric Process:
An isobaric process is one in which the pressure (P) remains constant. Therefore, we can express the relationship between volume (V) and temperature (T) using the ideal gas law:
PV=nRT
Rearranging gives:
V=nRTP
2. Expressing Volume in Terms of Temperature:
Since P is constant in an isobaric process, we can express the equation as:
V=nRP⋅T
Here, nRP is a constant (let's denote it as C), so we can rewrite the equation as:
V=CT
3. Logarithmic Form:
Taking the logarithm of both sides gives:
logV=logC+logT
This can be rearranged to:
logV=logT+logC
This is in the form of y=mx+c, where y=logV, x=logT, m=1, and c=logC.
4. Analyzing the Constant C:
Since we are given that (nR)/(P)>1, it implies that C>1. Therefore, logC>0, meaning that the intercept c is positive.
5. Graph Characteristics:
The graph of logV versus logT will be a straight line with:
- A positive slope of 1 (indicating a direct proportionality).
- A positive y-intercept (since c>0).
6. Identifying the Correct Sketch:
From the above analysis, we need to find a sketch that shows a straight line starting from a positive value on the y-axis (indicating the positive intercept) and having a slope of 1.
Conclusion:
The correct sketch representing an isobaric process will be the one that shows a straight line with a positive y-intercept and a slope of 1.
An isobaric process is one in which the pressure (P) remains constant. Therefore, we can express the relationship between volume (V) and temperature (T) using the ideal gas law:
PV=nRT
Rearranging gives:
V=nRTP
Since P is constant in an isobaric process, we can express the equation as:
V=nRP⋅T
Here, nRP is a constant (let's denote it as C), so we can rewrite the equation as:
V=CT
Taking the logarithm of both sides gives:
logV=logC+logT
This can be rearranged to:
logV=logT+logC
This is in the form of y=mx+c, where y=logV, x=logT, m=1, and c=logC.
Since we are given that (nR)/(P)>1, it implies that C>1. Therefore, logC>0, meaning that the intercept c is positive.
The graph of logV versus logT will be a straight line with:
- A positive slope of 1 (indicating a direct proportionality).
- A positive y-intercept (since c>0).
From the above analysis, we need to find a sketch that shows a straight line starting from a positive value on the y-axis (indicating the positive intercept) and having a slope of 1.
The correct sketch representing an isobaric process will be the one that shows a straight line with a positive y-intercept and a slope of 1.
Topper's Solved these Questions
Similar Questions
Knowledge Check
Which of the following sketches is an isobar (nRP>1)
A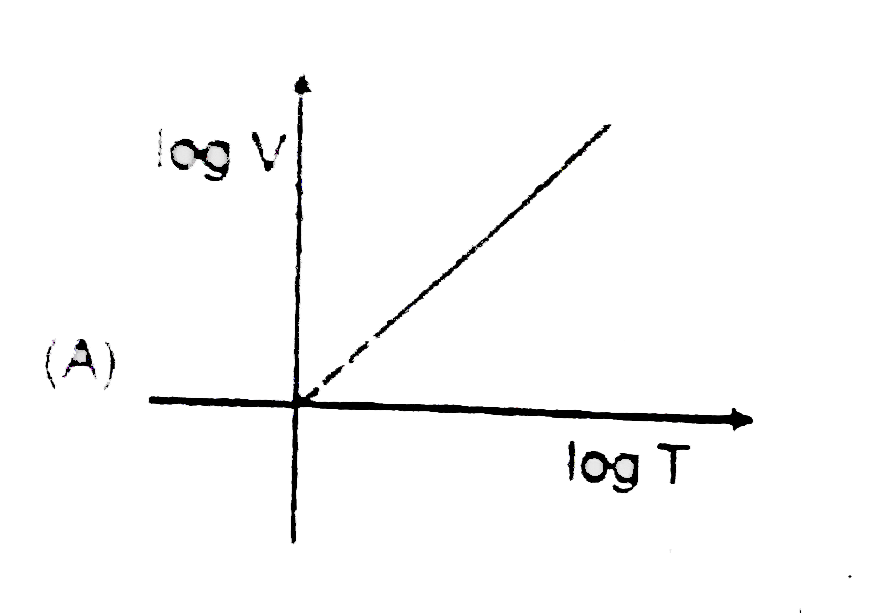 B
B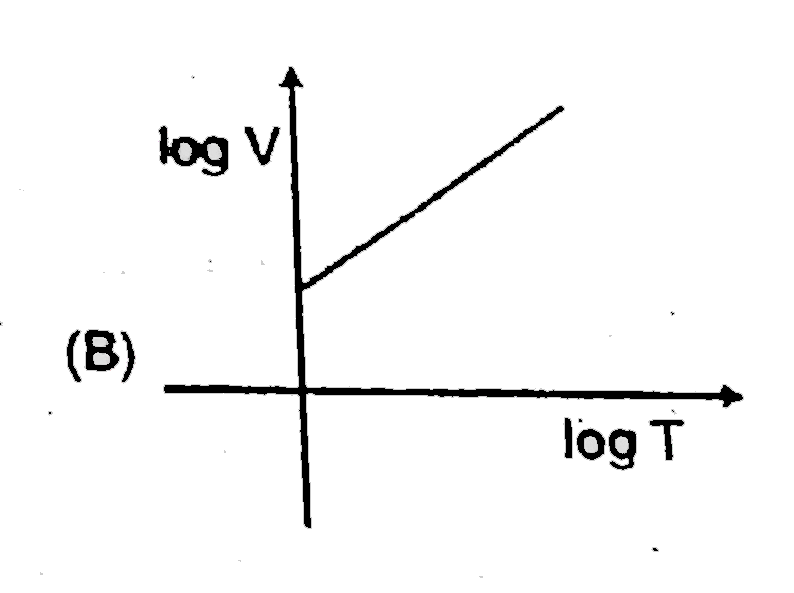 C
C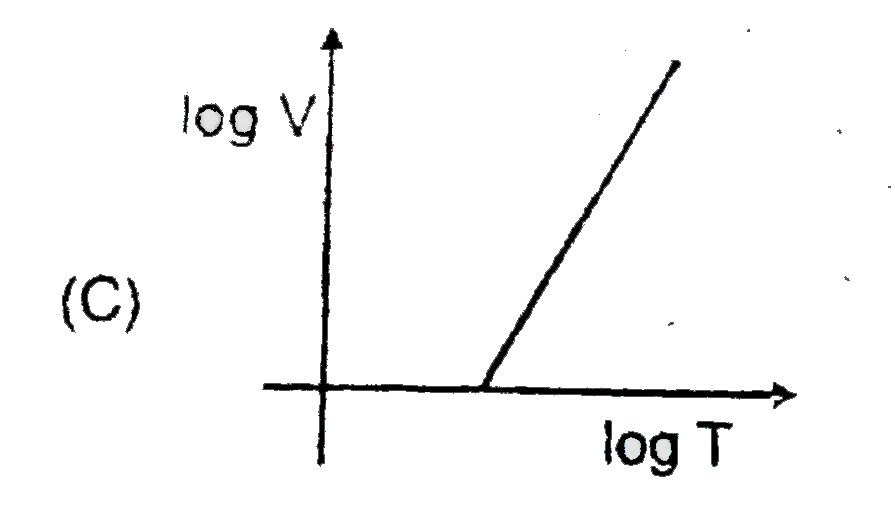 D
D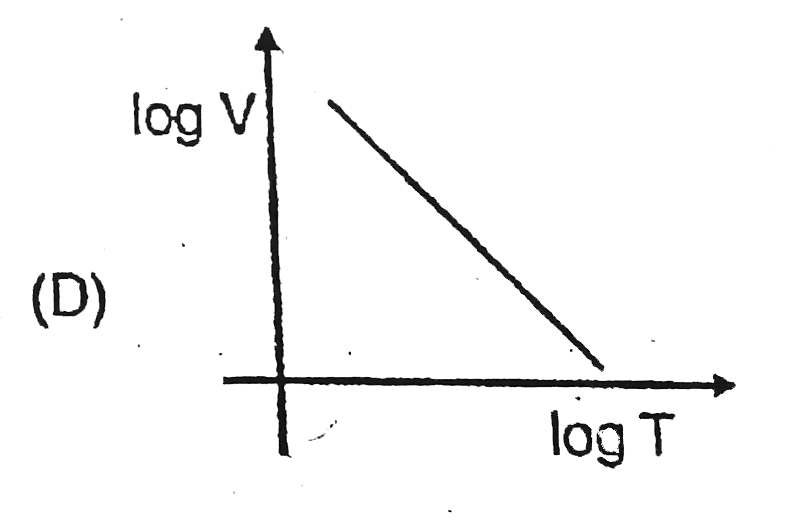
Which of the following nuclides are isobars?
A4021Scand4221ScB4018Arand4021ScC4018Arand4119KDnone of theseWhich of the following pairs represents isobars?
A.19K40 and .11Na23B.2He3 and .2He4C.12Mg24 and .12Mg25D.19K40 and .20Ca40
Which is the following pairs are isobars ?
View SolutionWhich one of the following pairs represents isobars?
View SolutionWhich one of the following pair represents isobars?
View SolutionWhich of the following is an example of a pair of Isobars?
View SolutionWhich of the following is an example of a pair of Isobars?
View Solution
