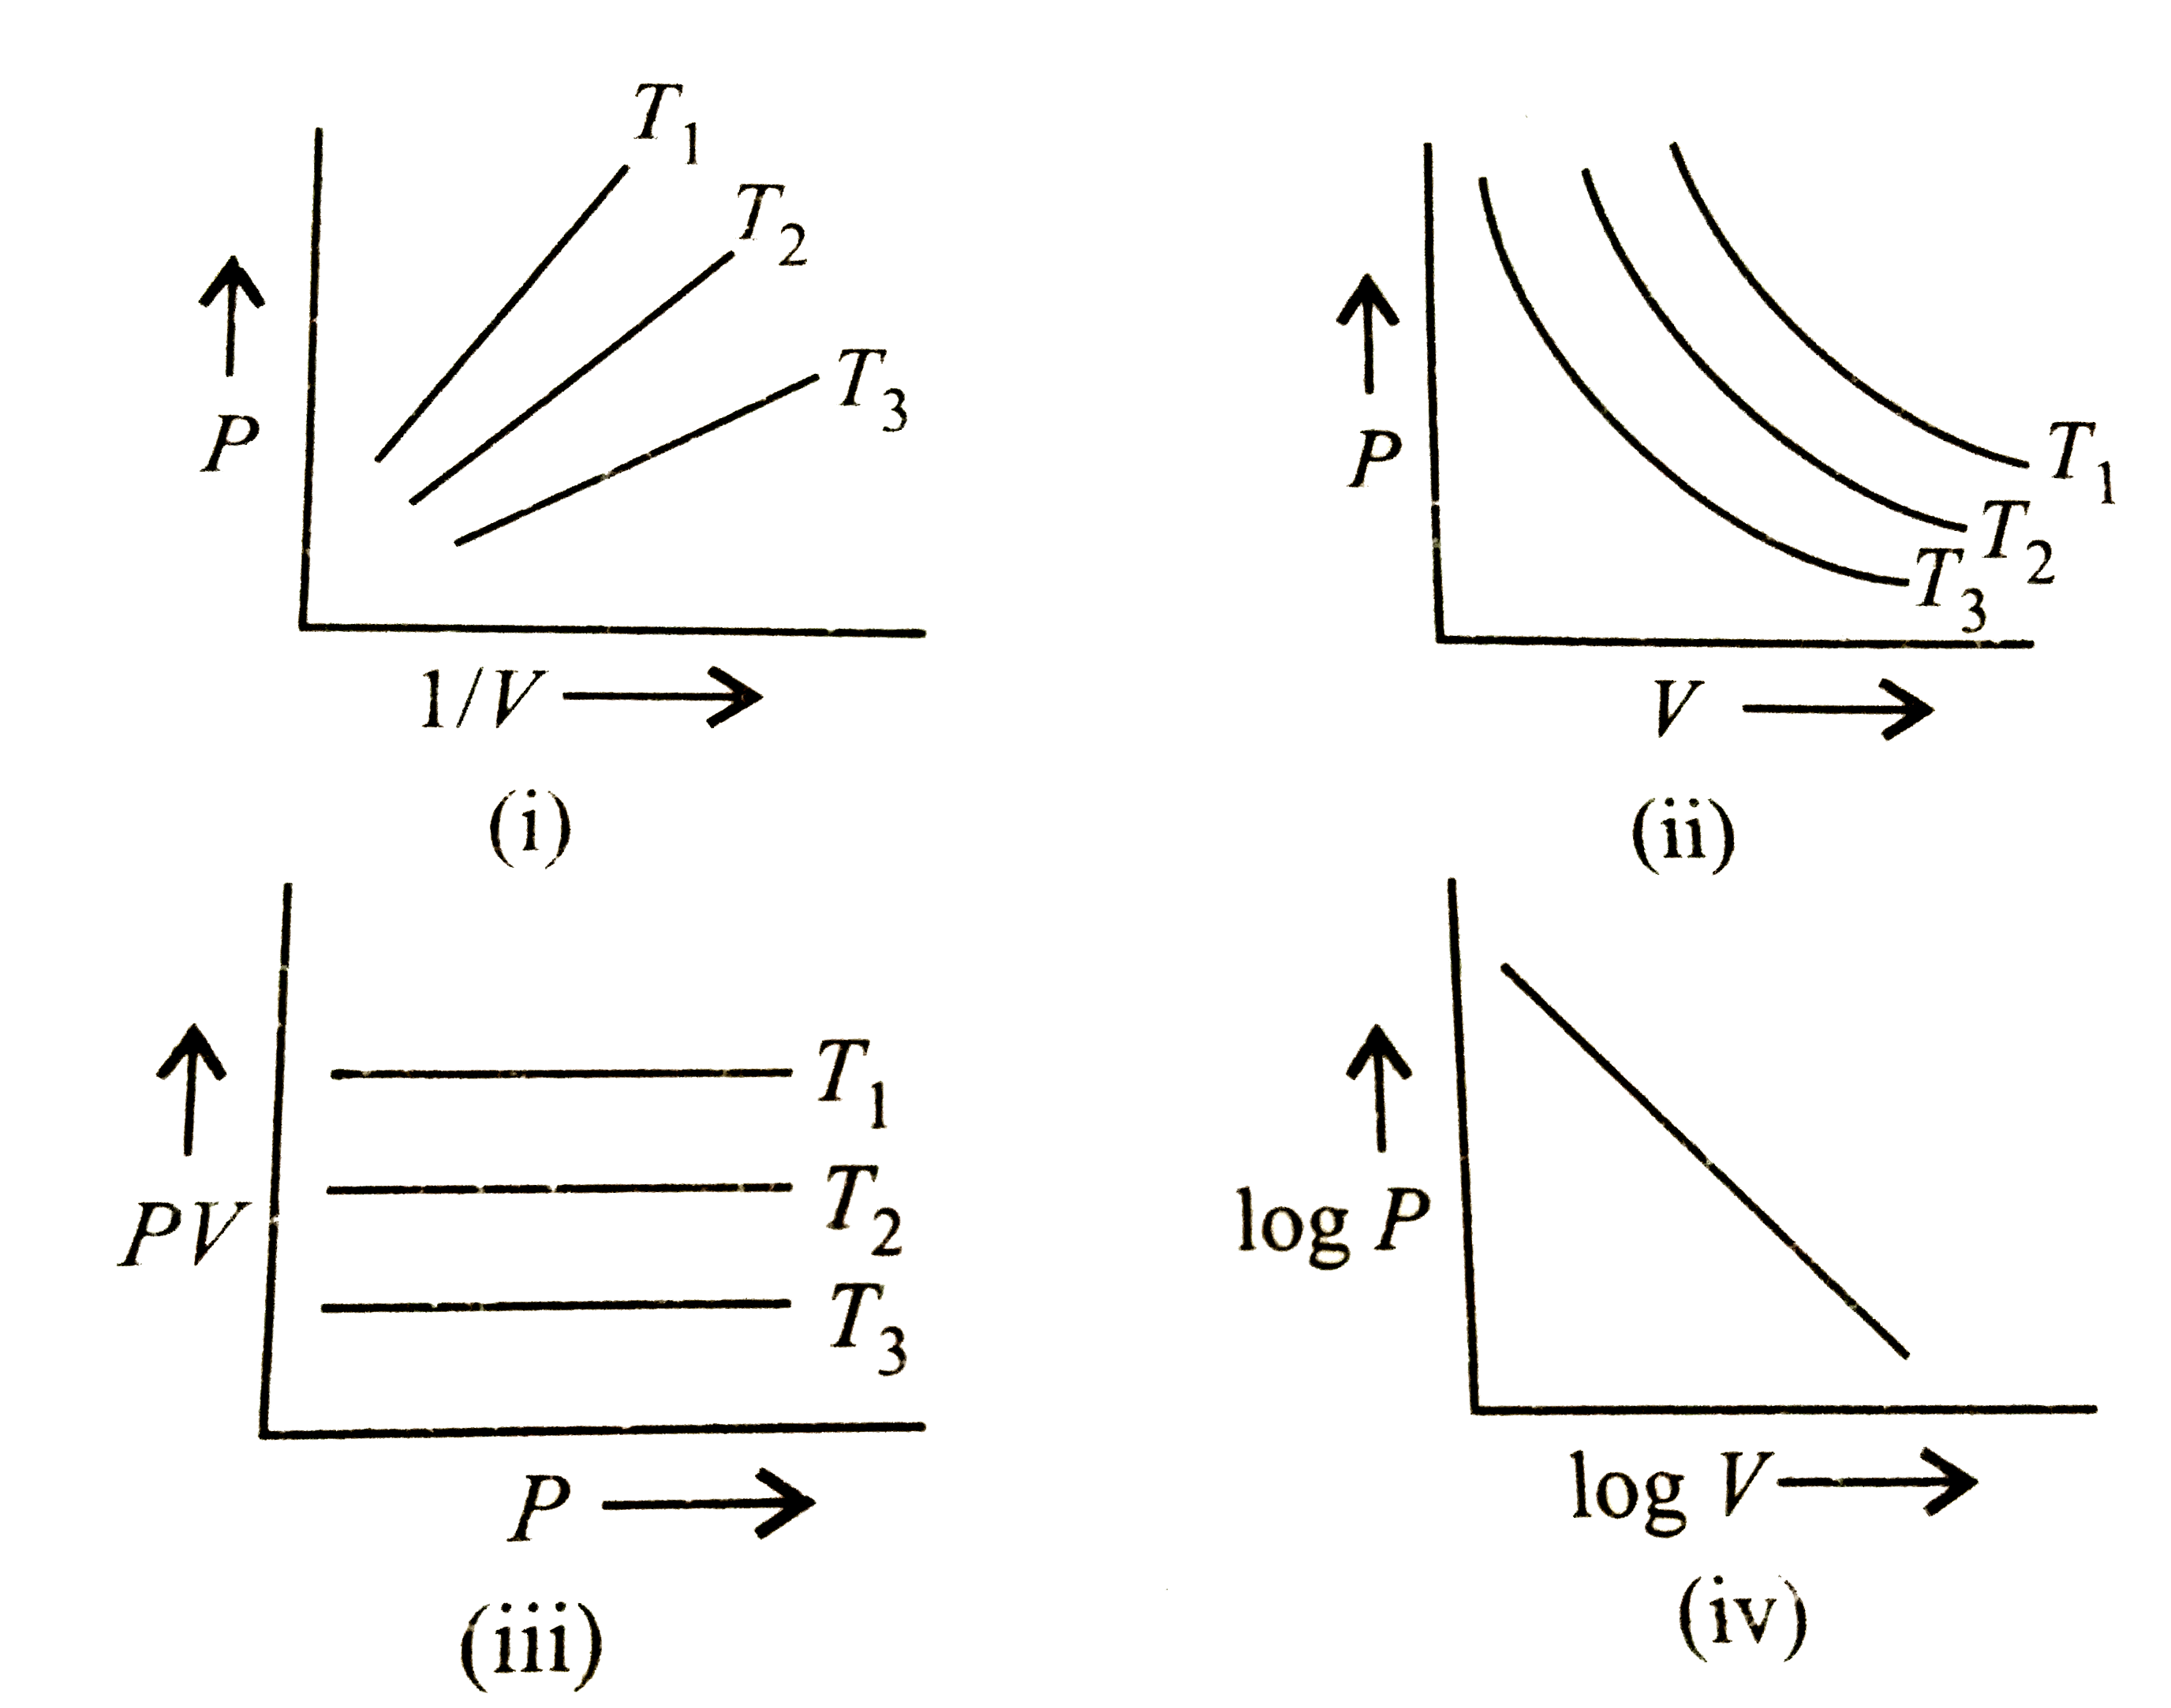
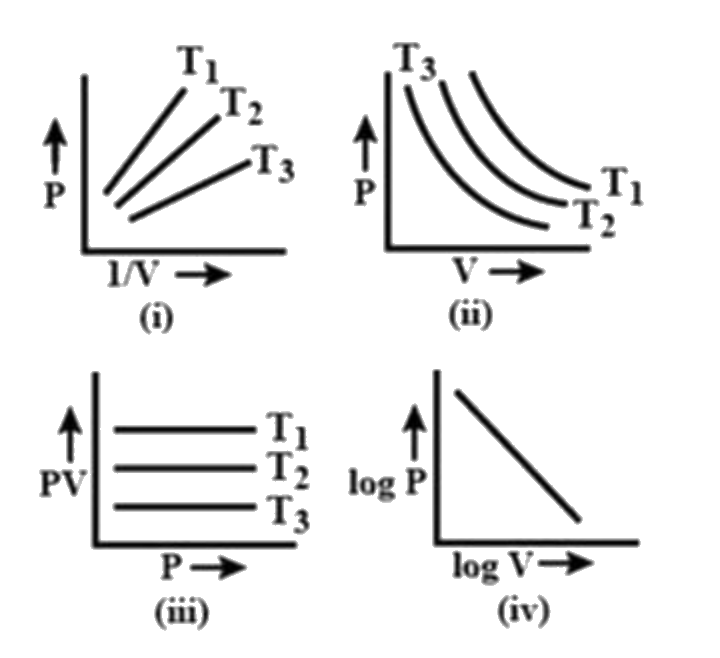
Graph between pressure and volume are plotted at different temperature. Which of the following isotherms represent Boyle's law as PV = constant?
Only (ii) is correct representation of Boyle's law
Only (iv) is correct representation of Boyle's law
All are correct representations of Boyle's law
None of these representations is correct for Boyle's law
The correct Answer is:C
Step by step video & image solution for Graph between pressure and volume are plotted at different temperature. Which of the following isotherms represent Boyle's law as PV = constant? by Chemistry experts to help you in doubts & scoring excellent marks in Class 12 exams.
Updated on:21/07/2023Topper's Solved these Questions
Similar Questions
Knowledge Check
Which of the following graph represent Boyle's law ?
A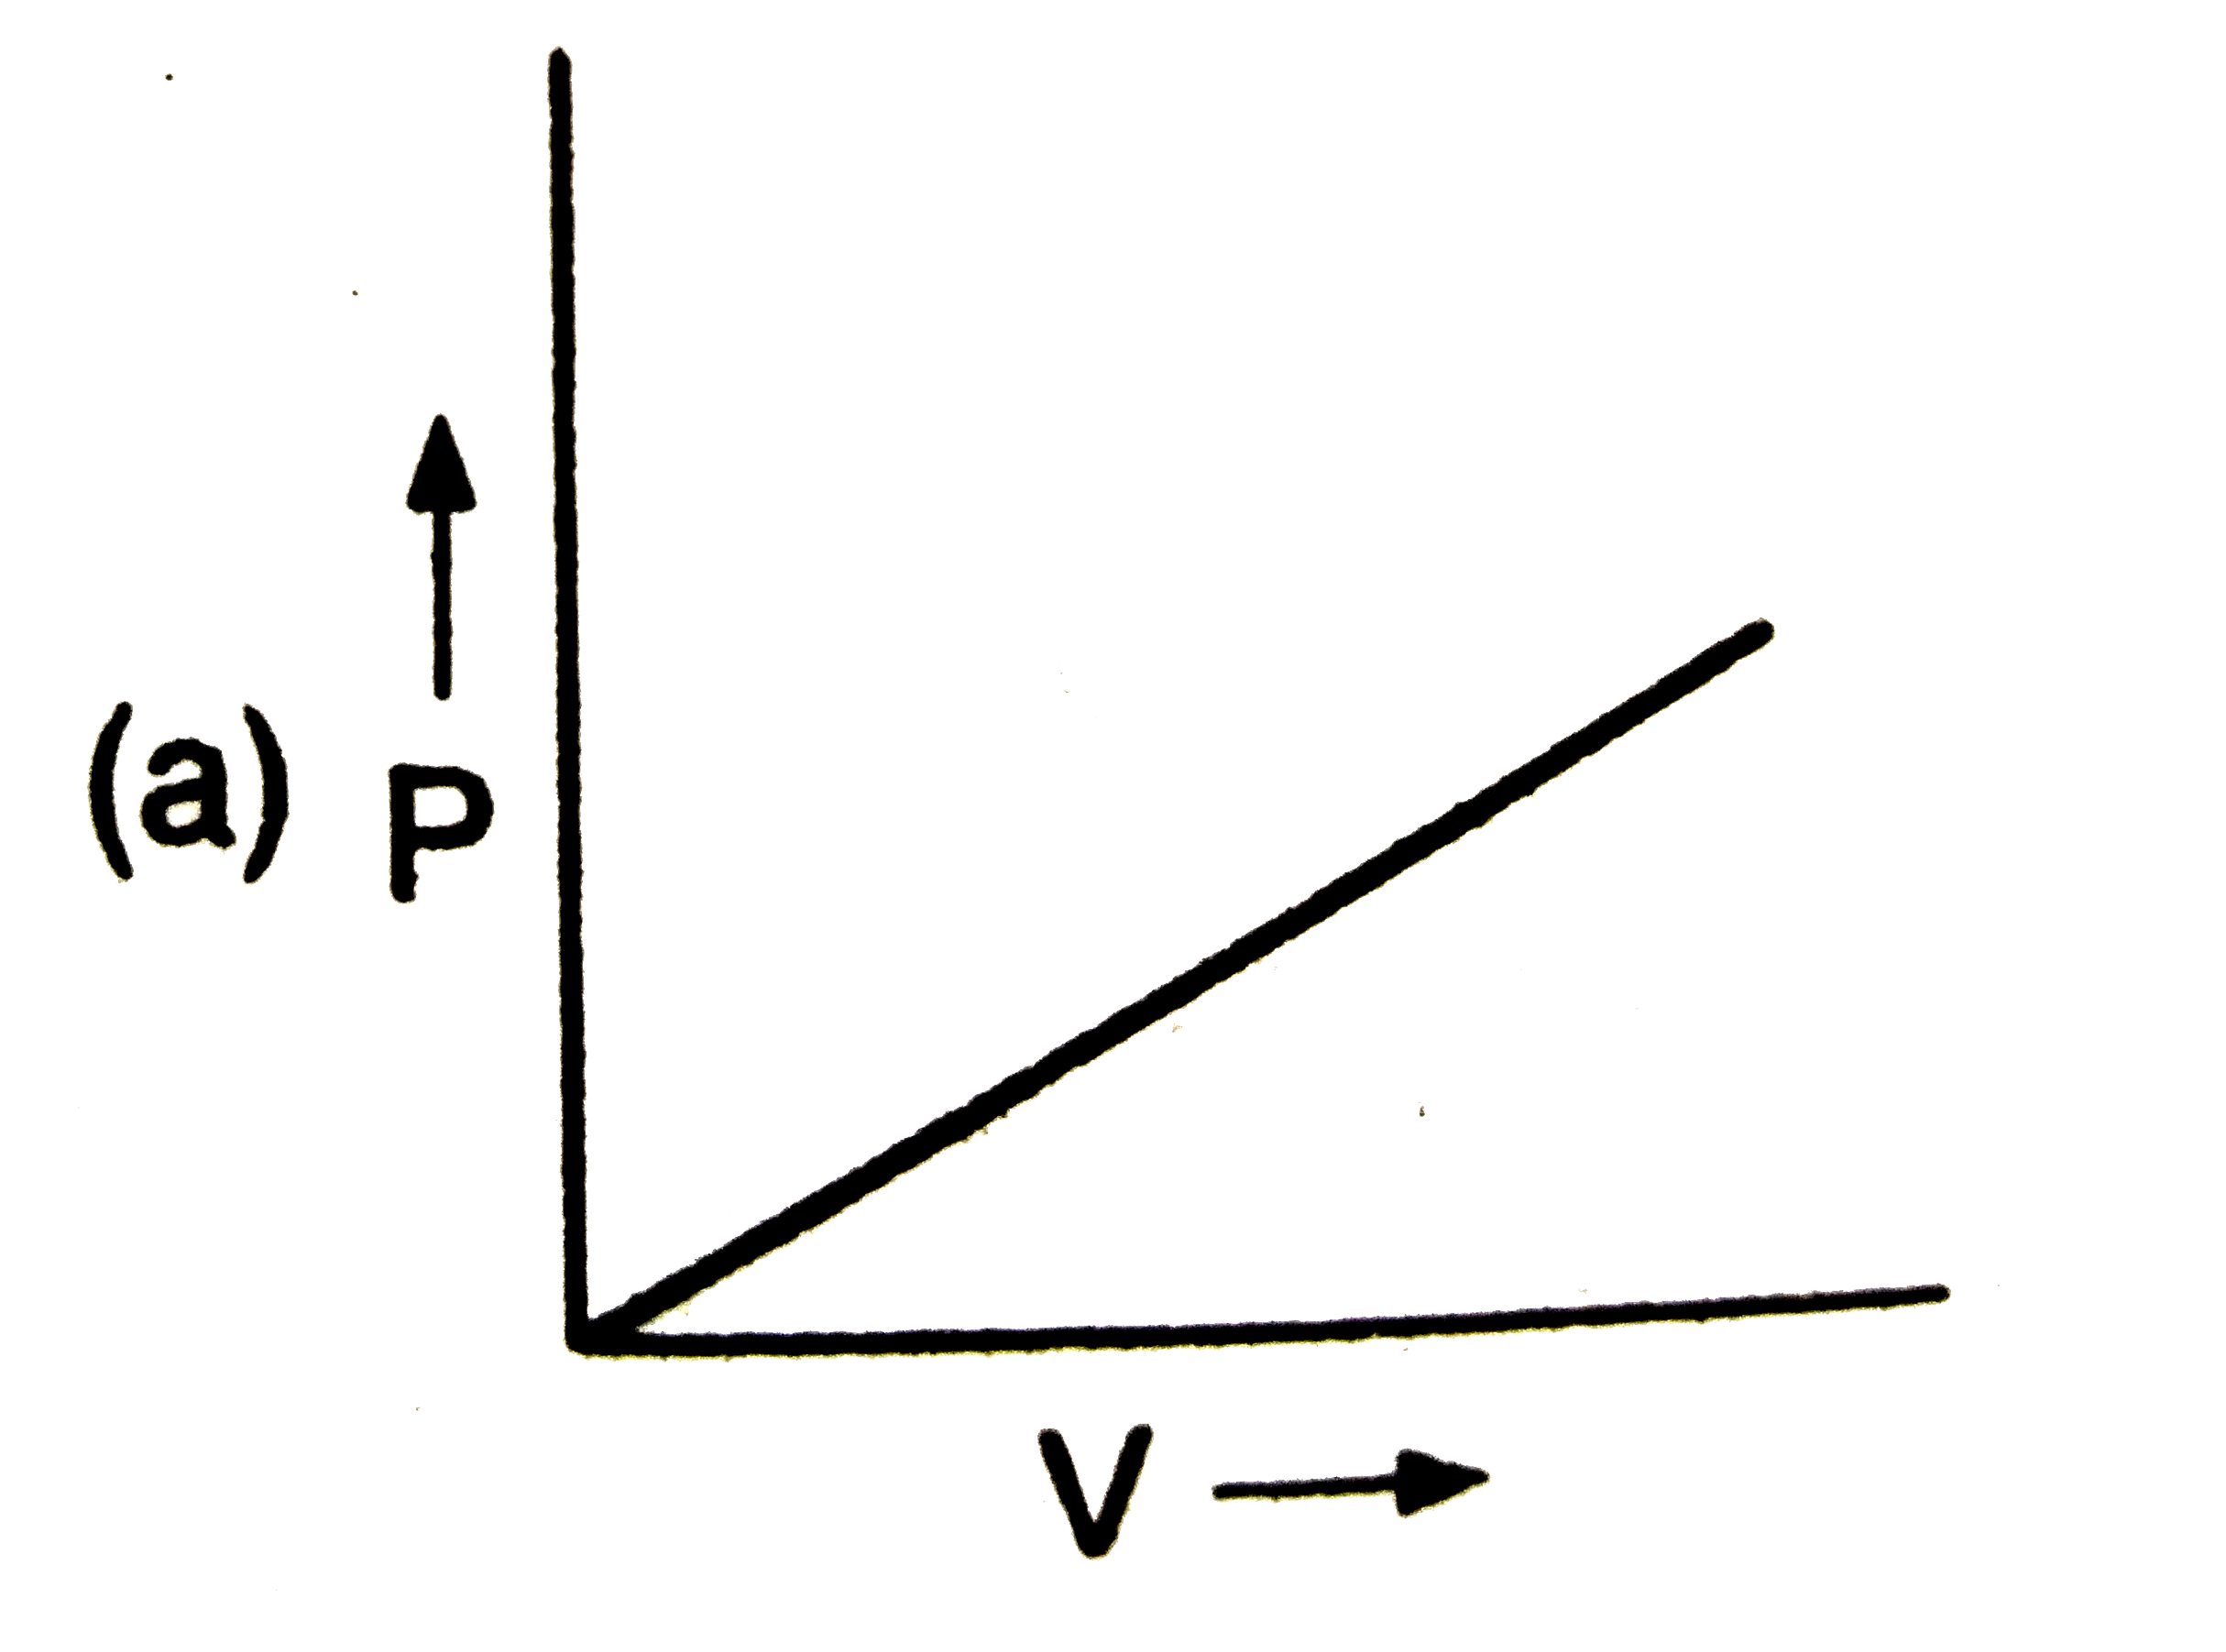 B
B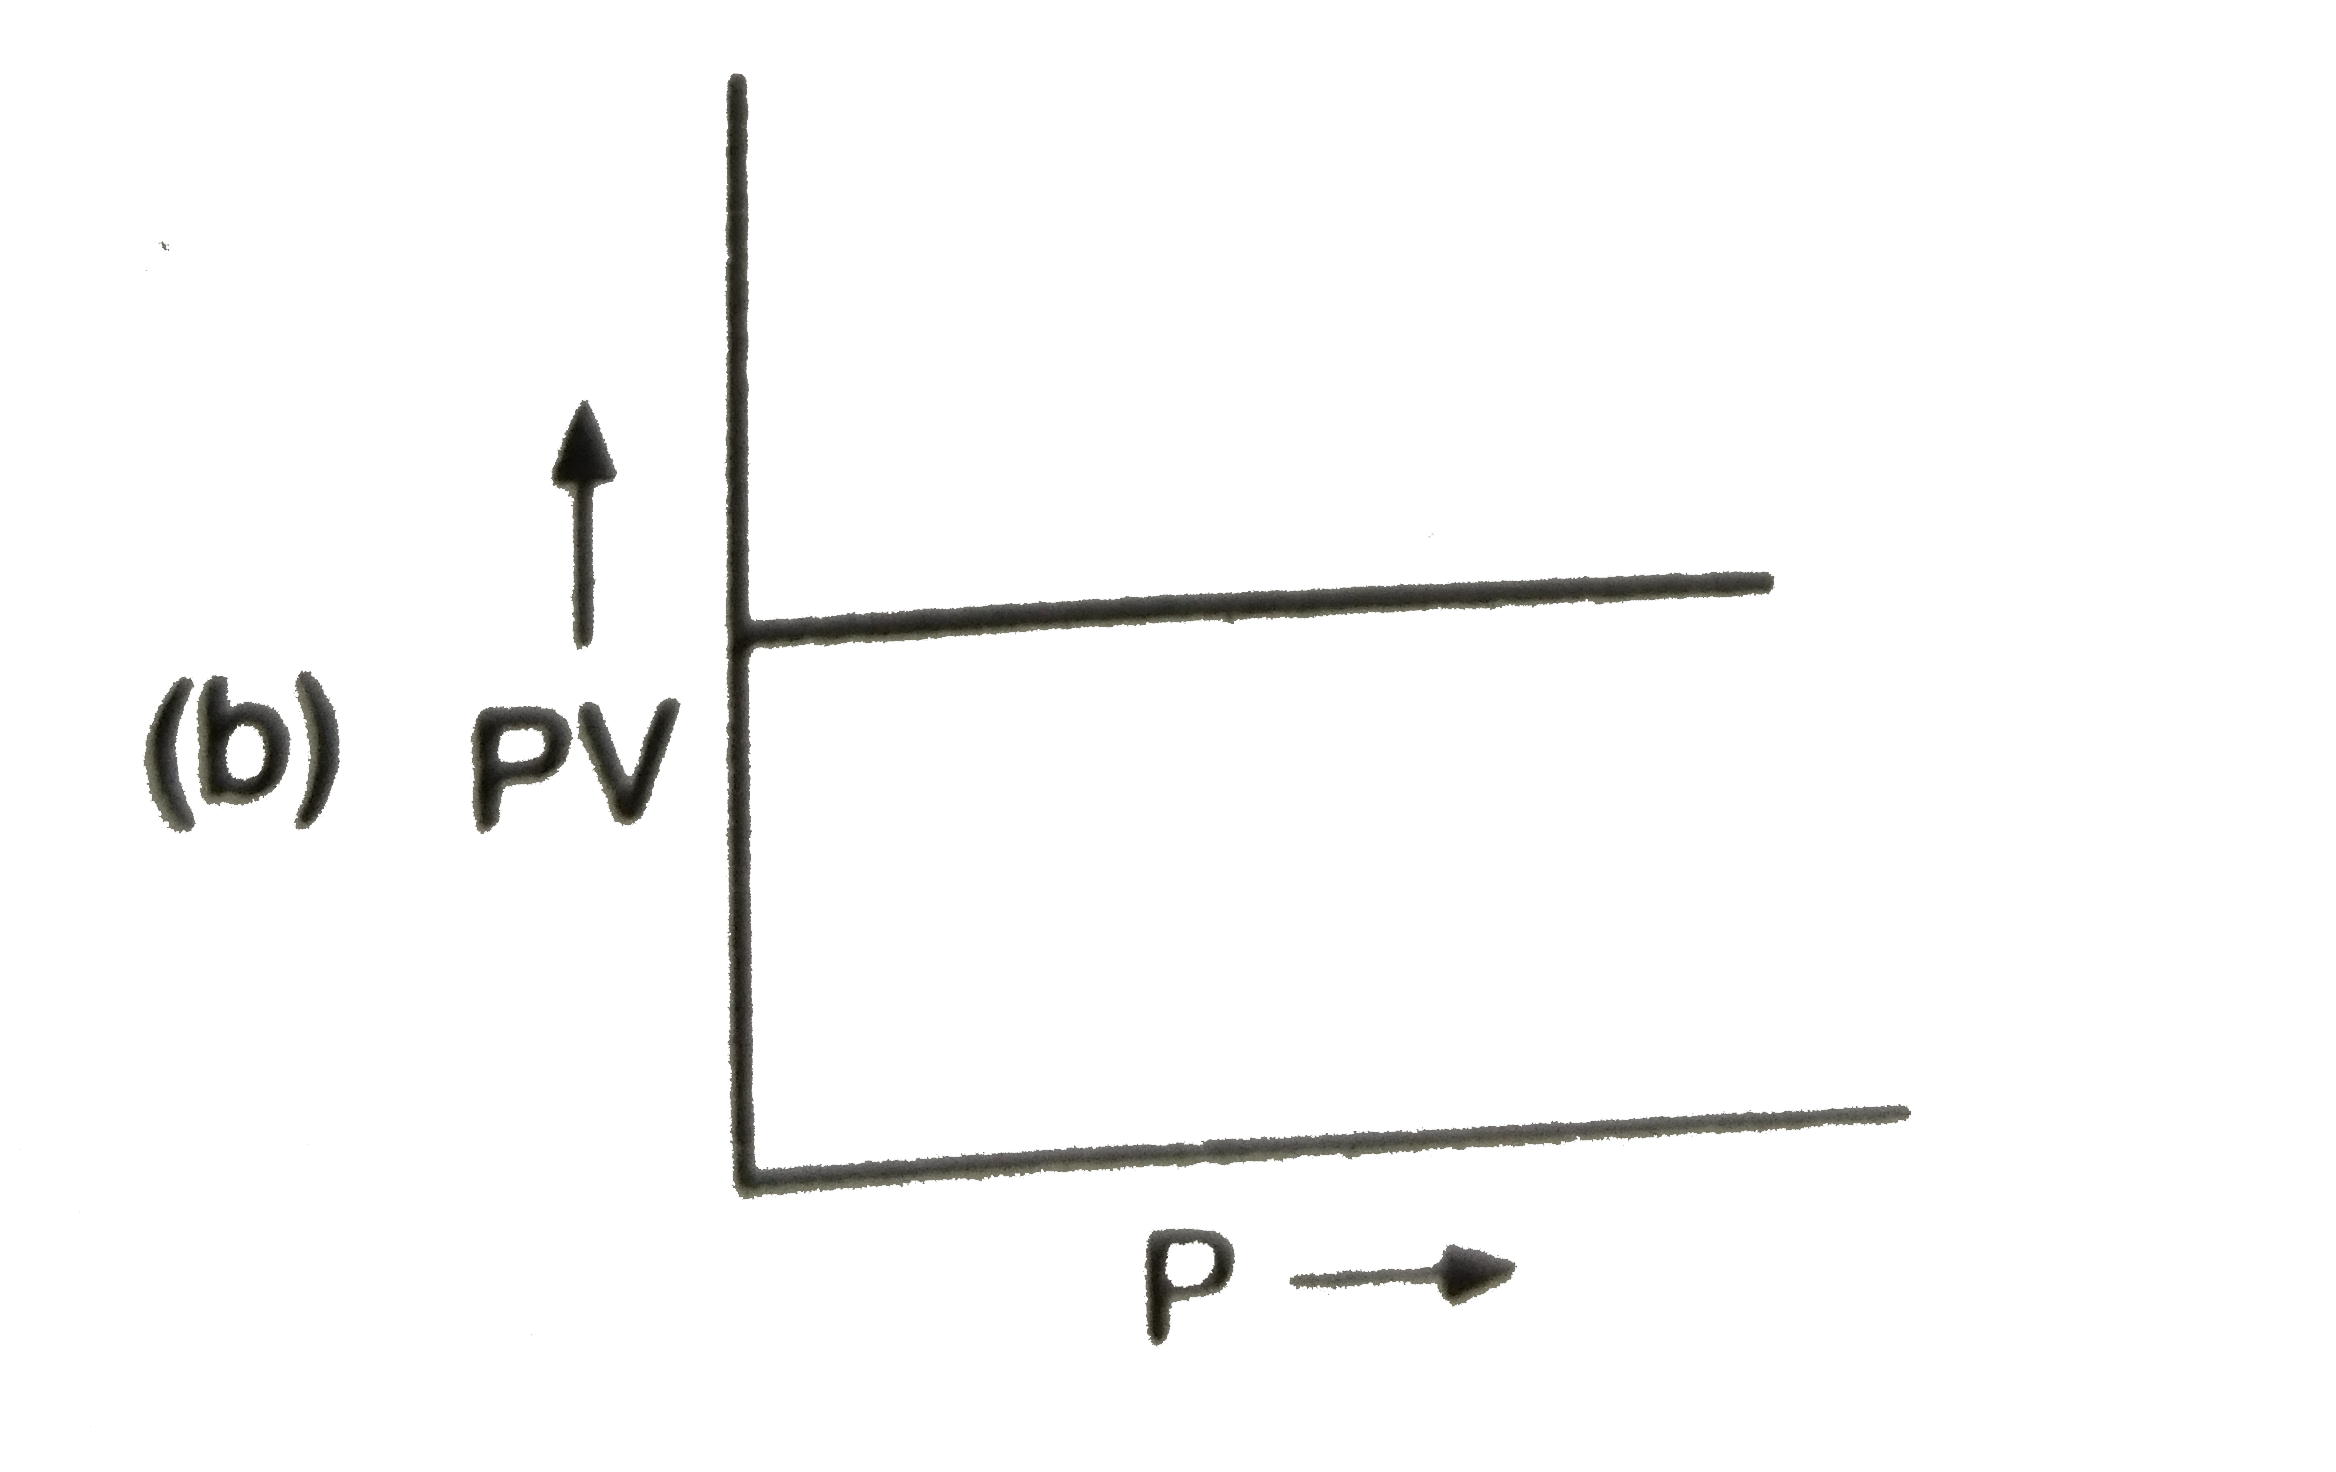 C
C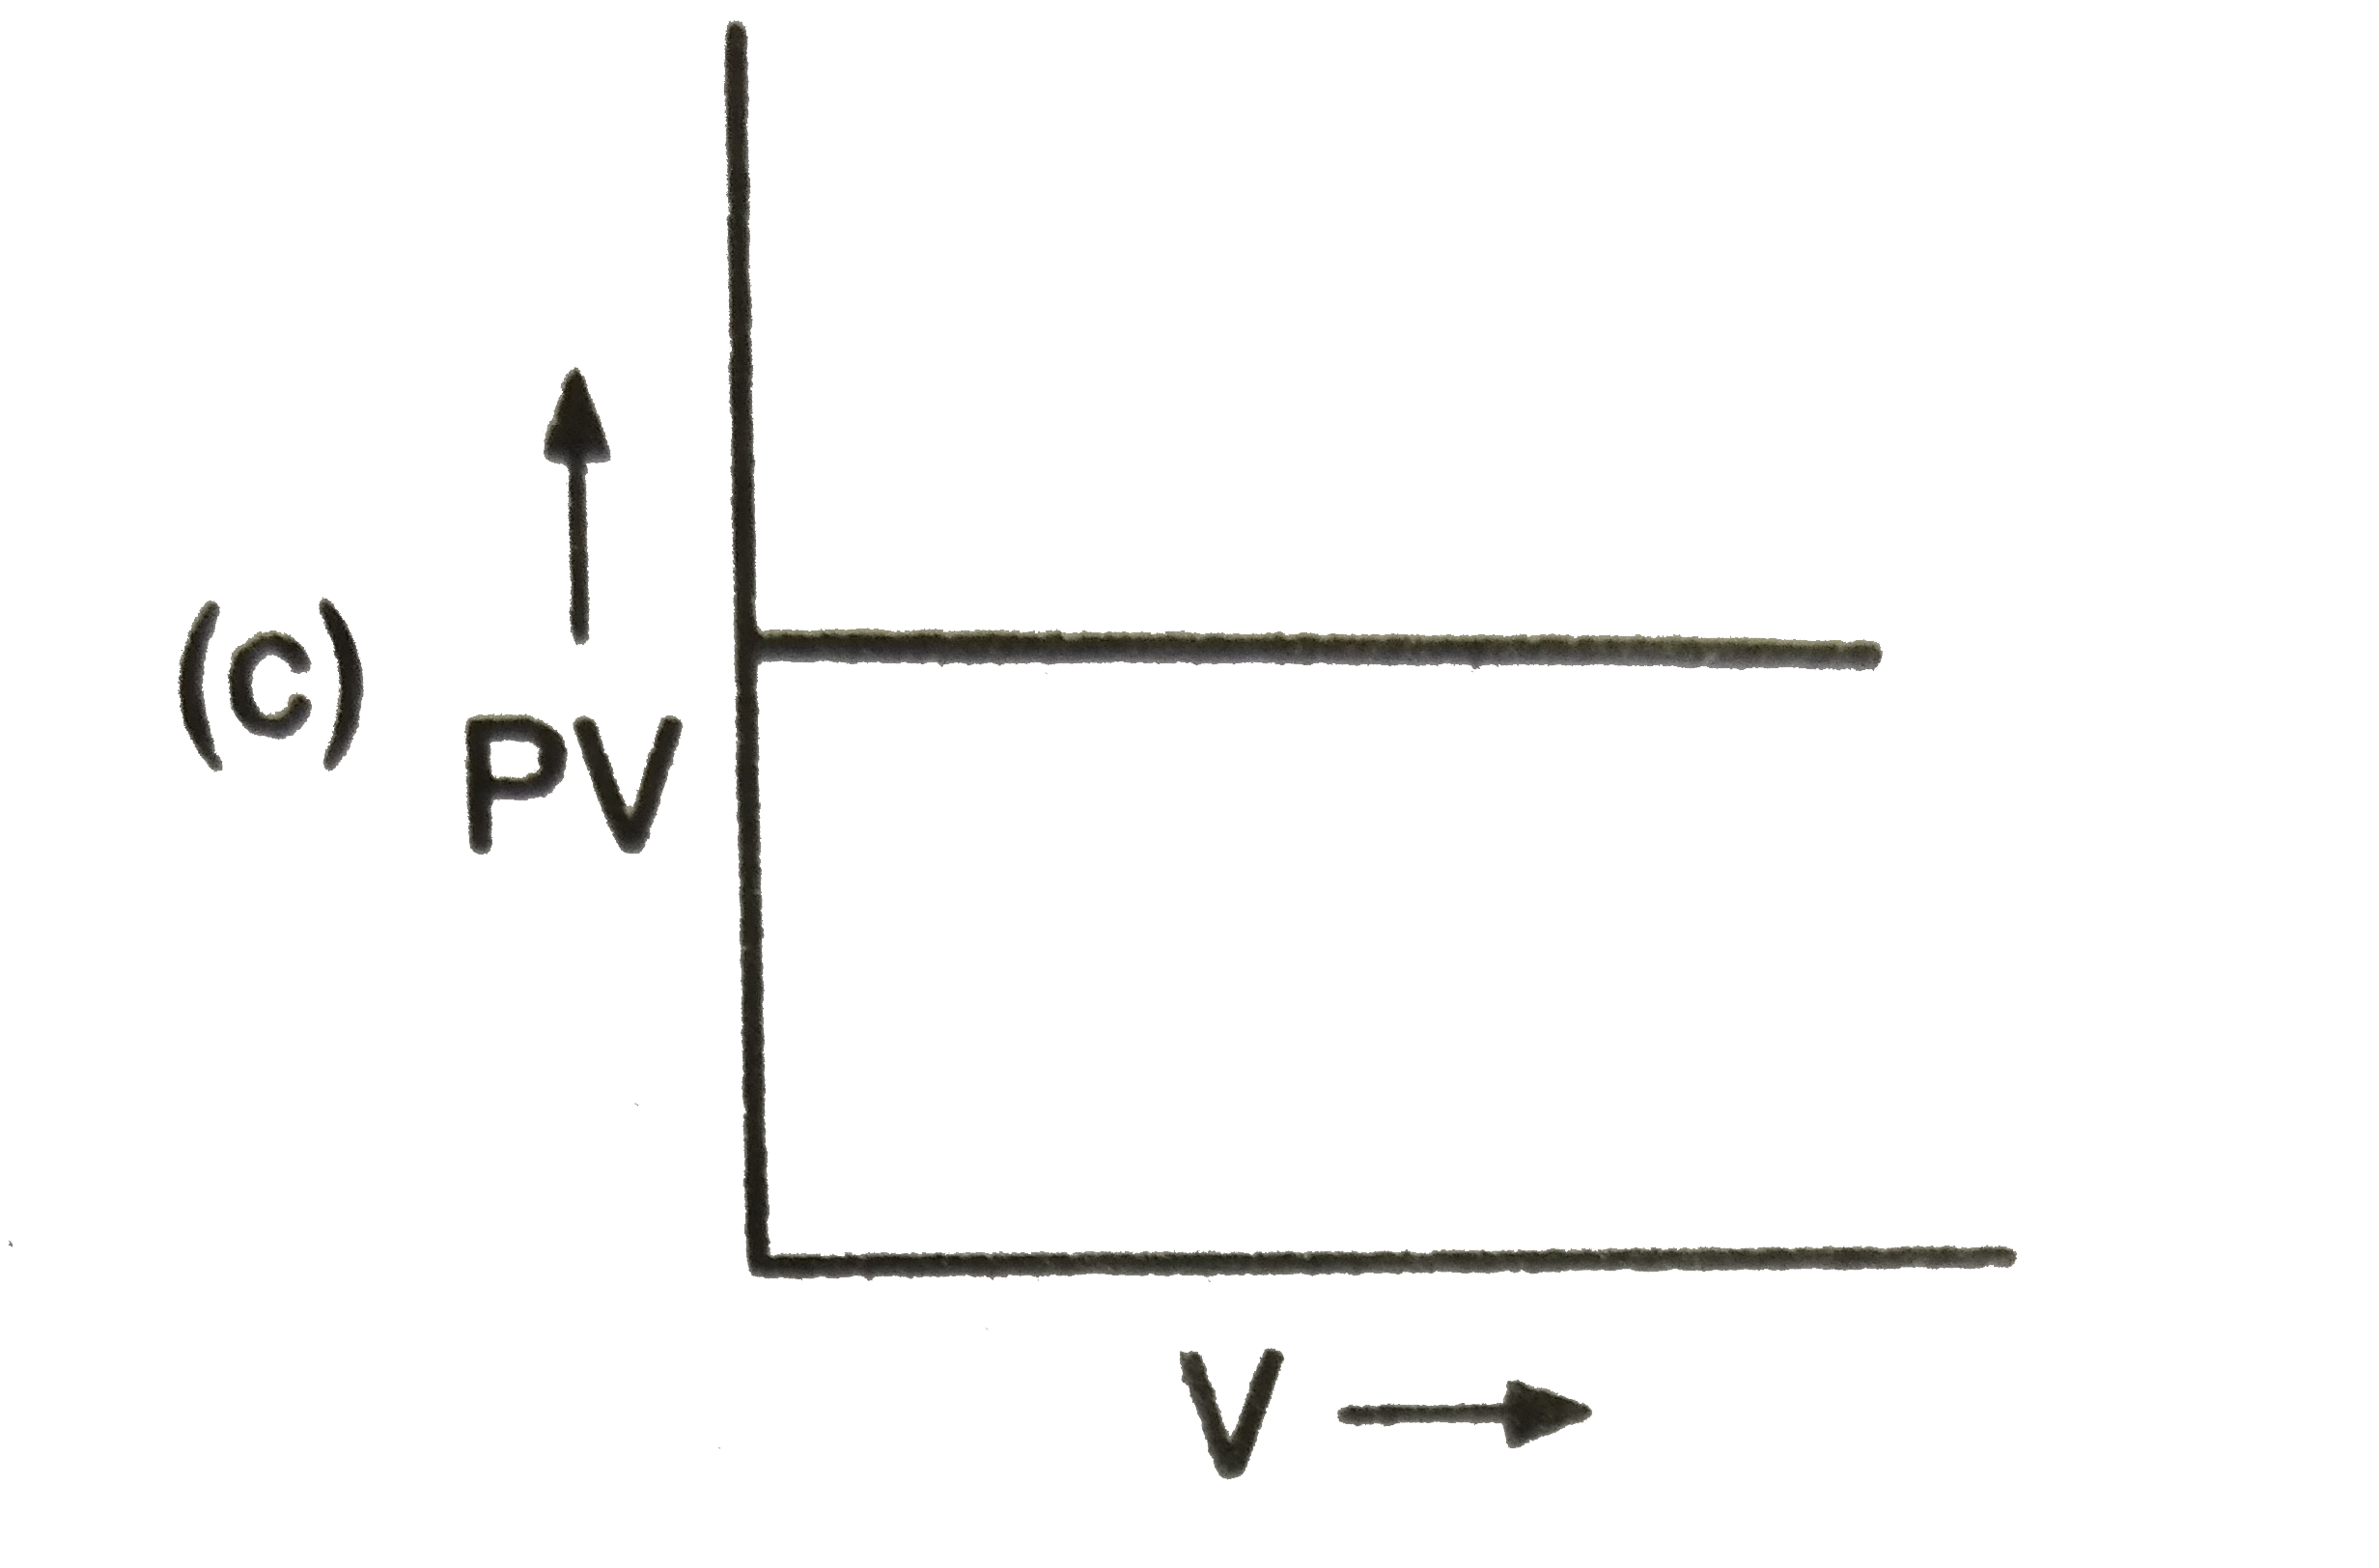 D
D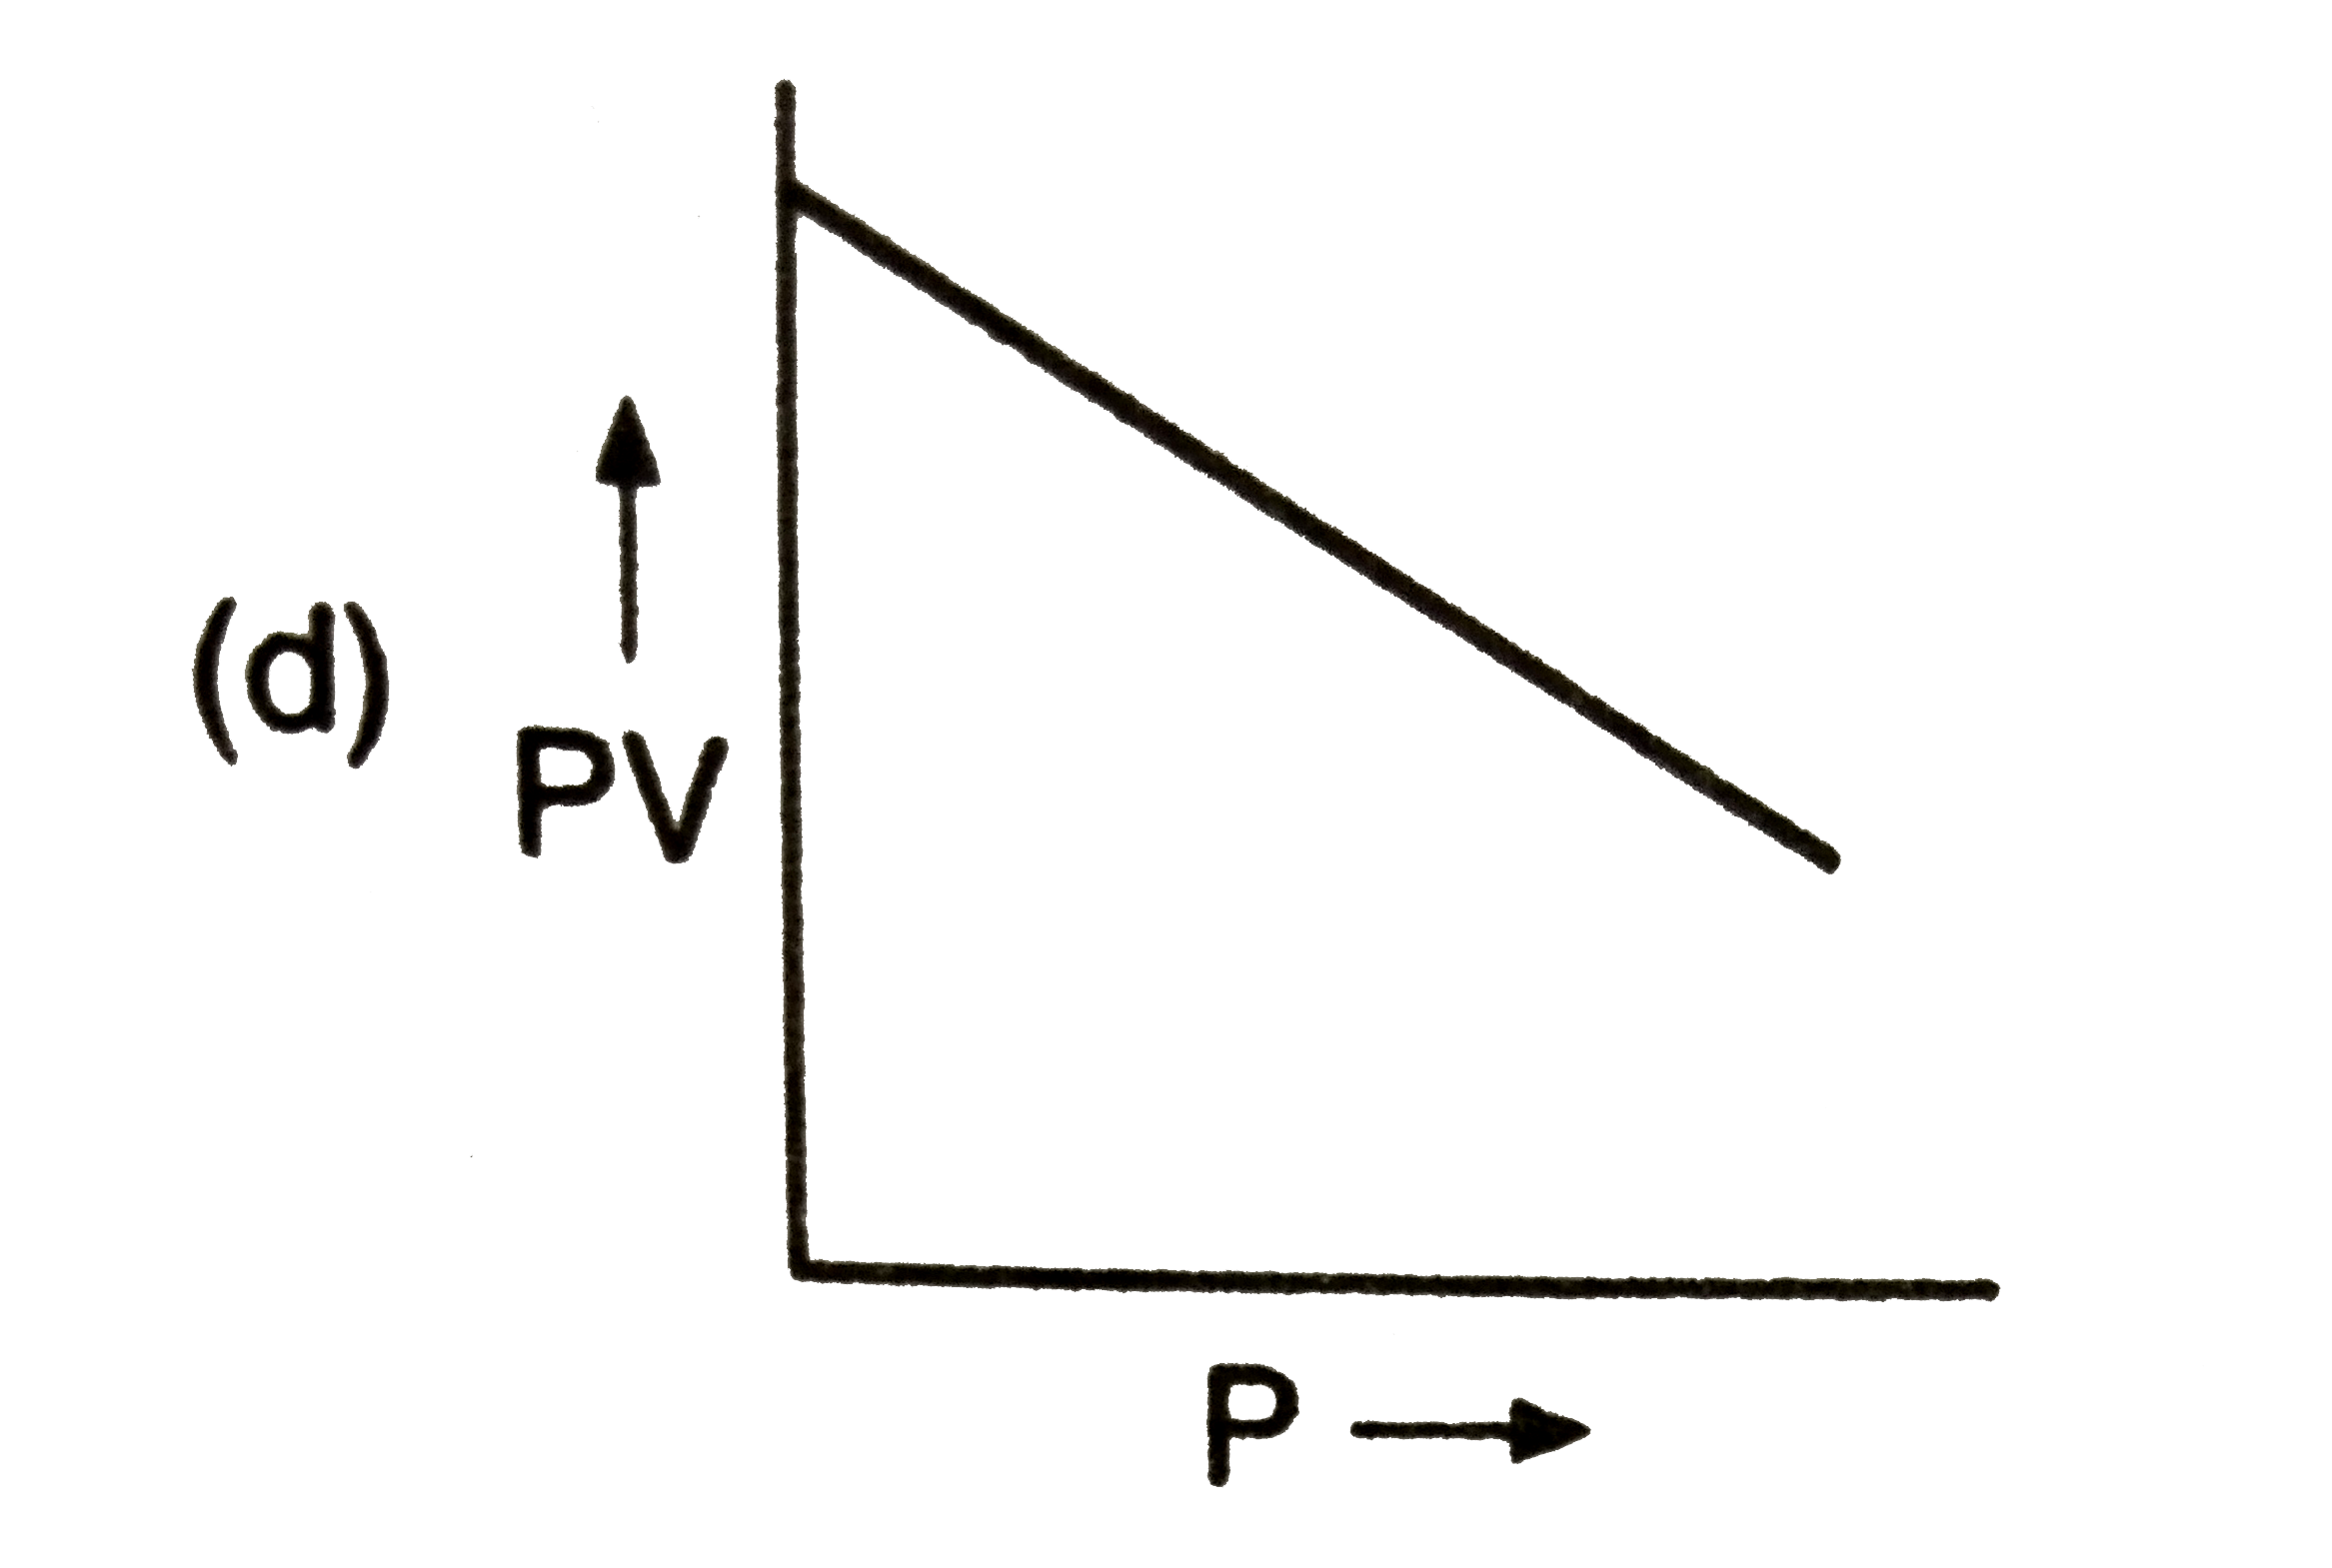
Which of the following graph represents Boyle's law ?
A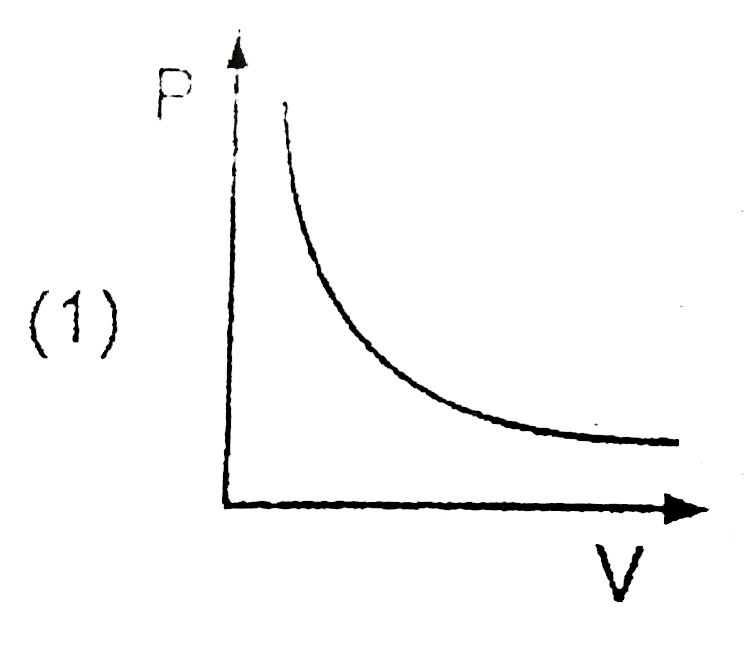 B
B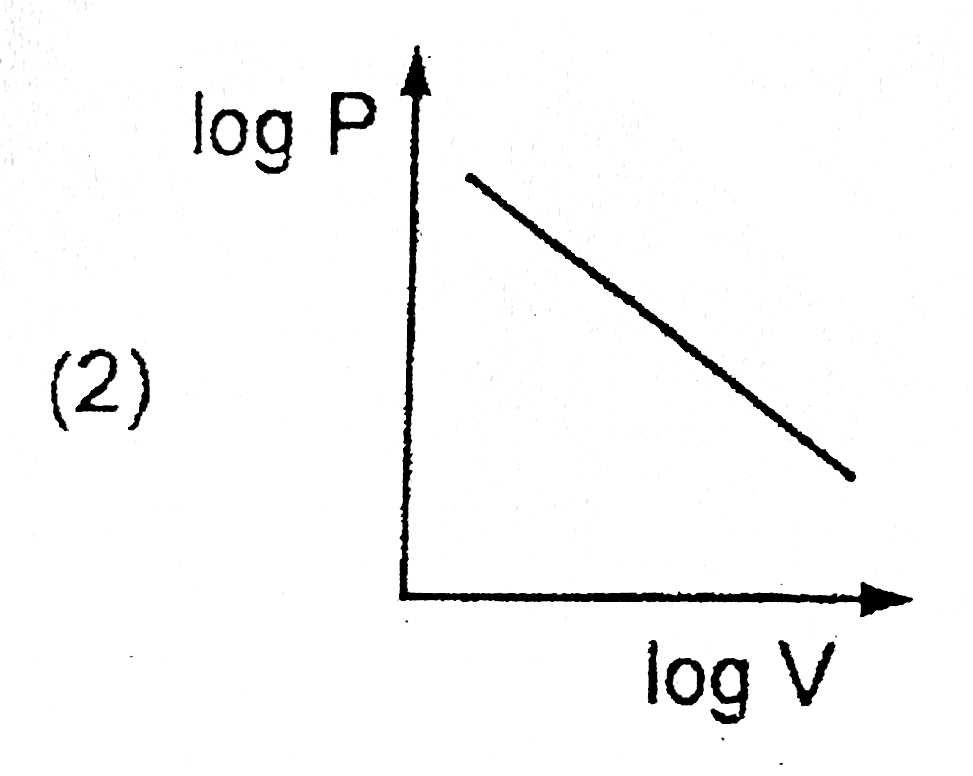 C
C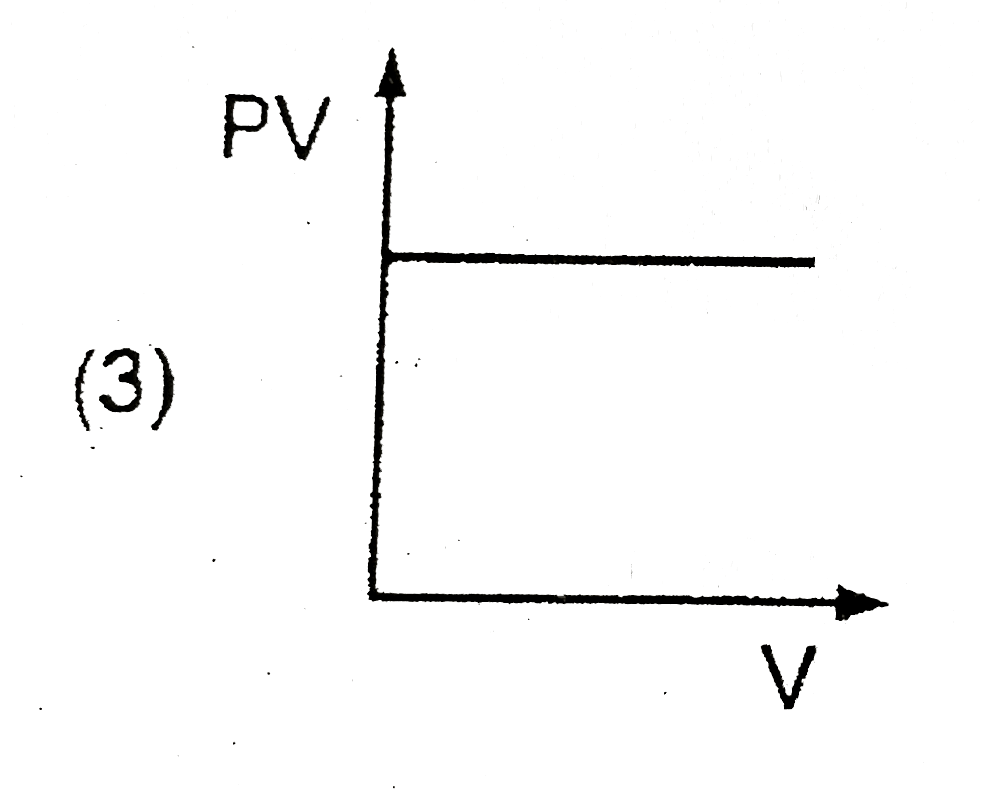 DAll of these
Which of the following graph represents Boyle's law ?
A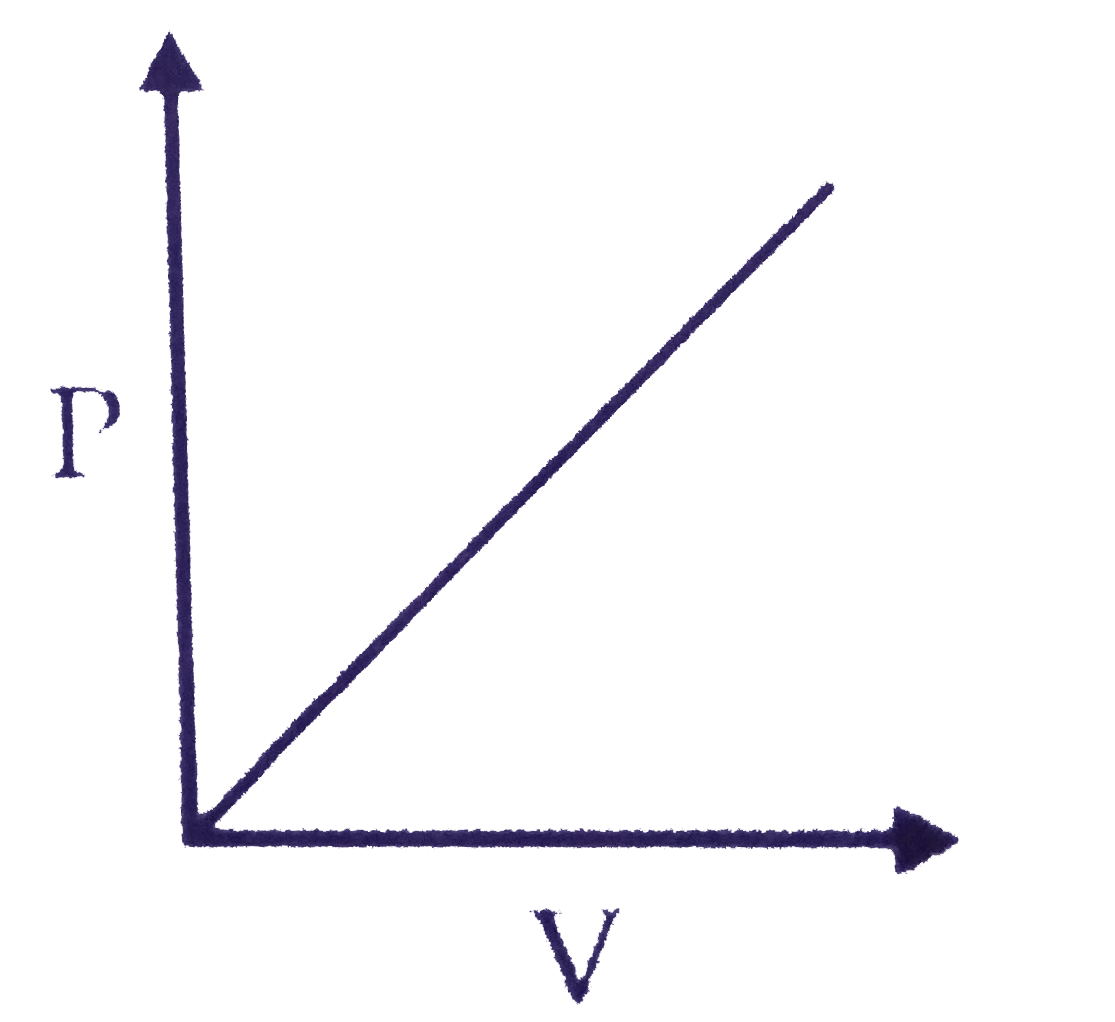 B
B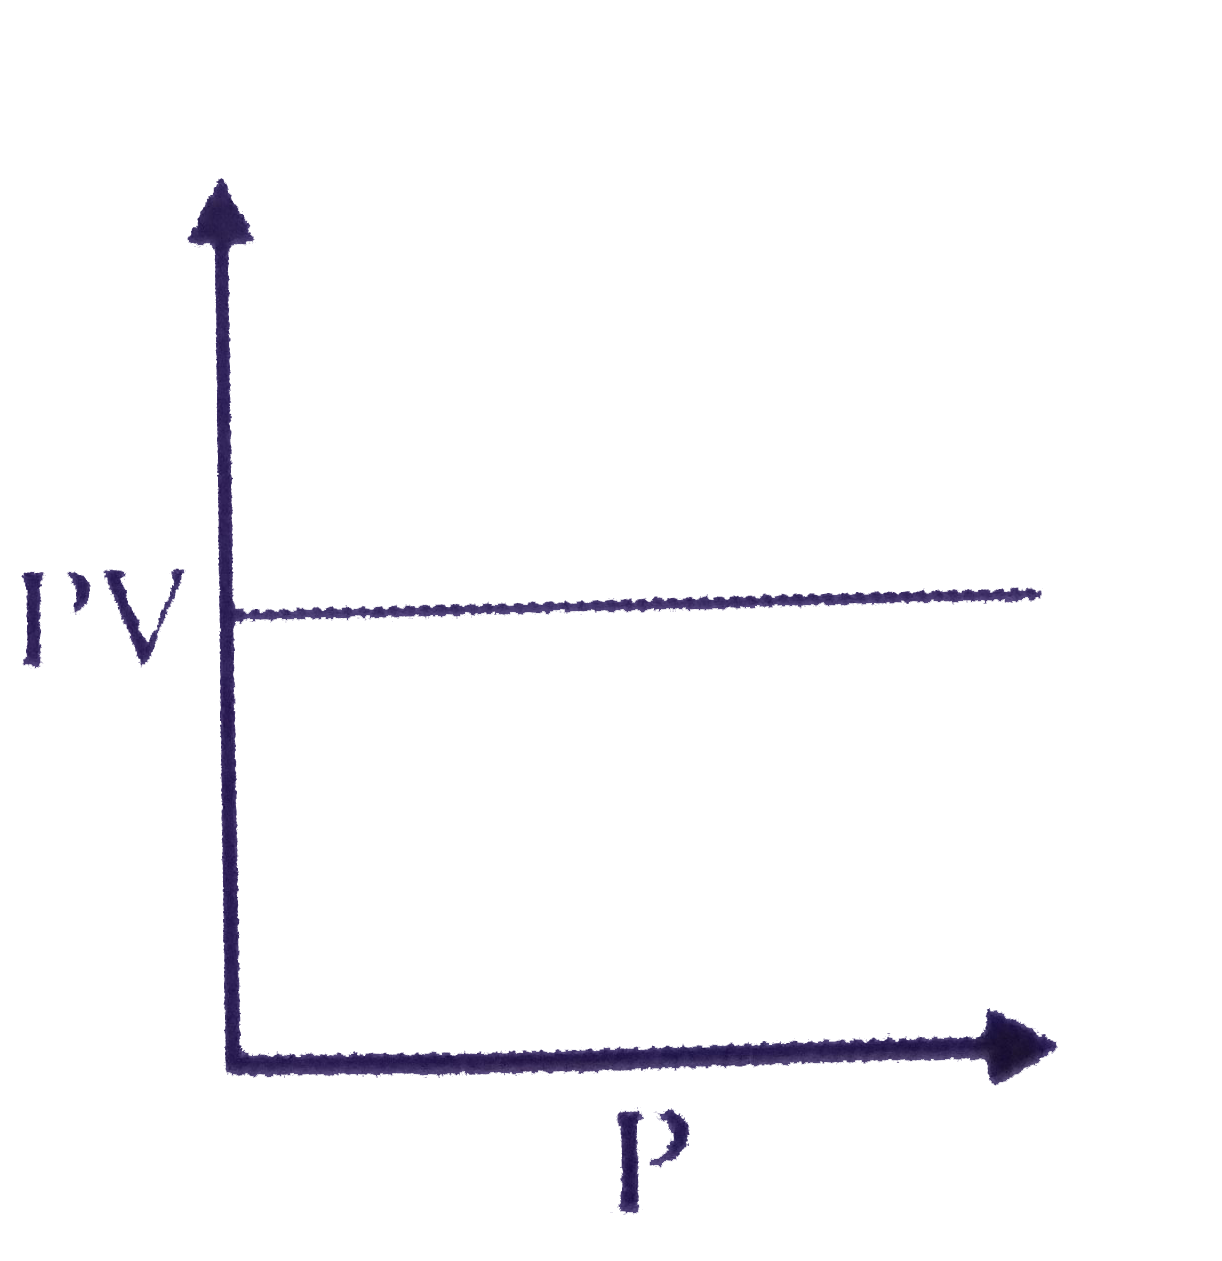 C
C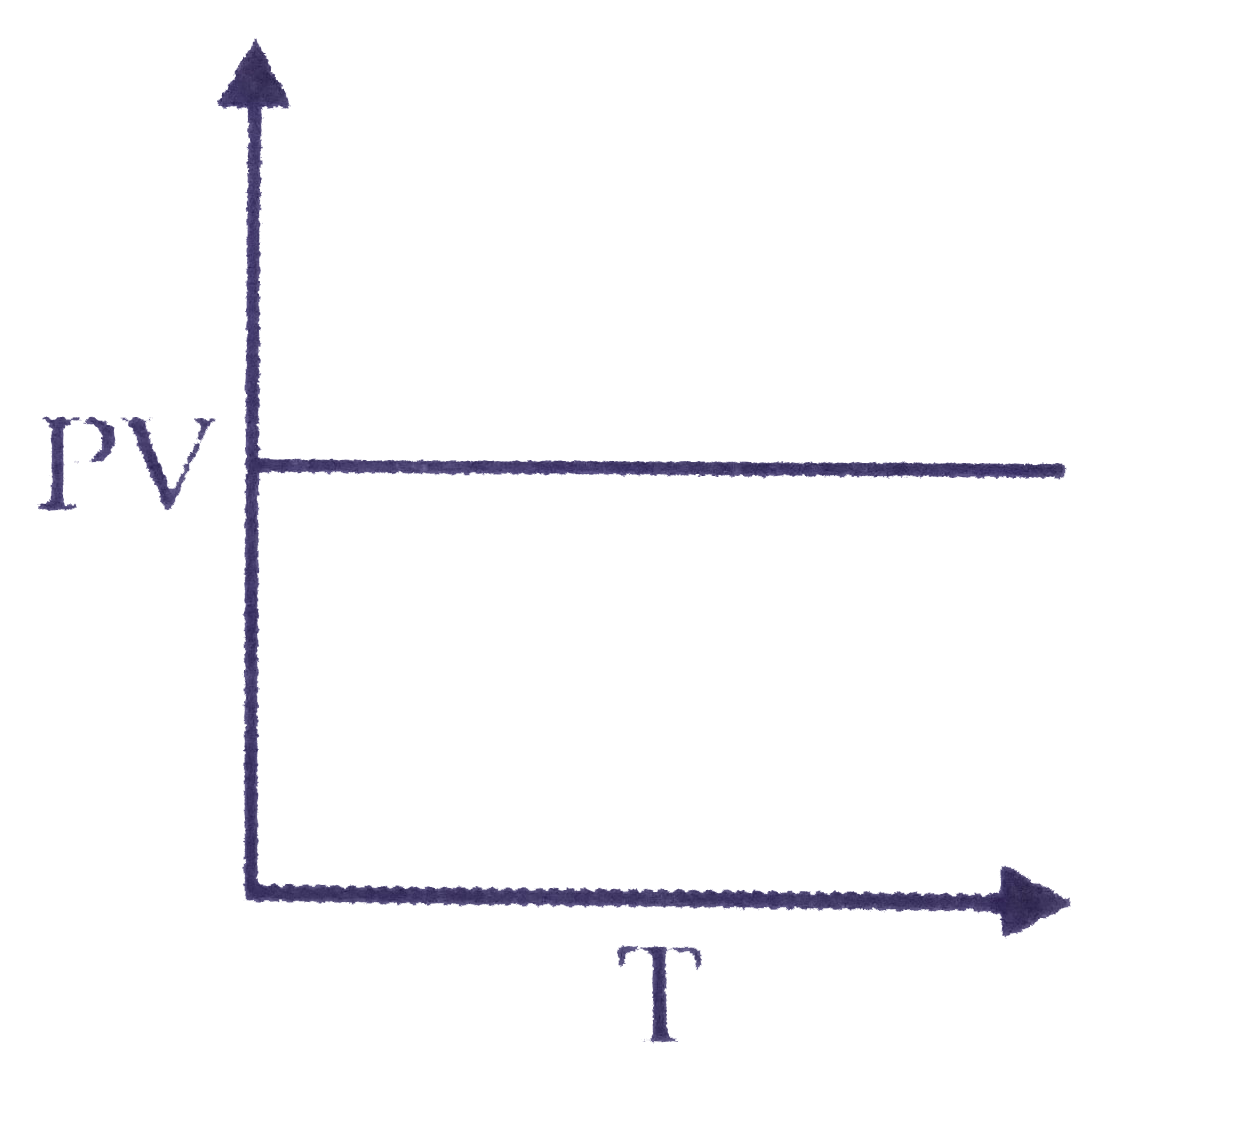 D
D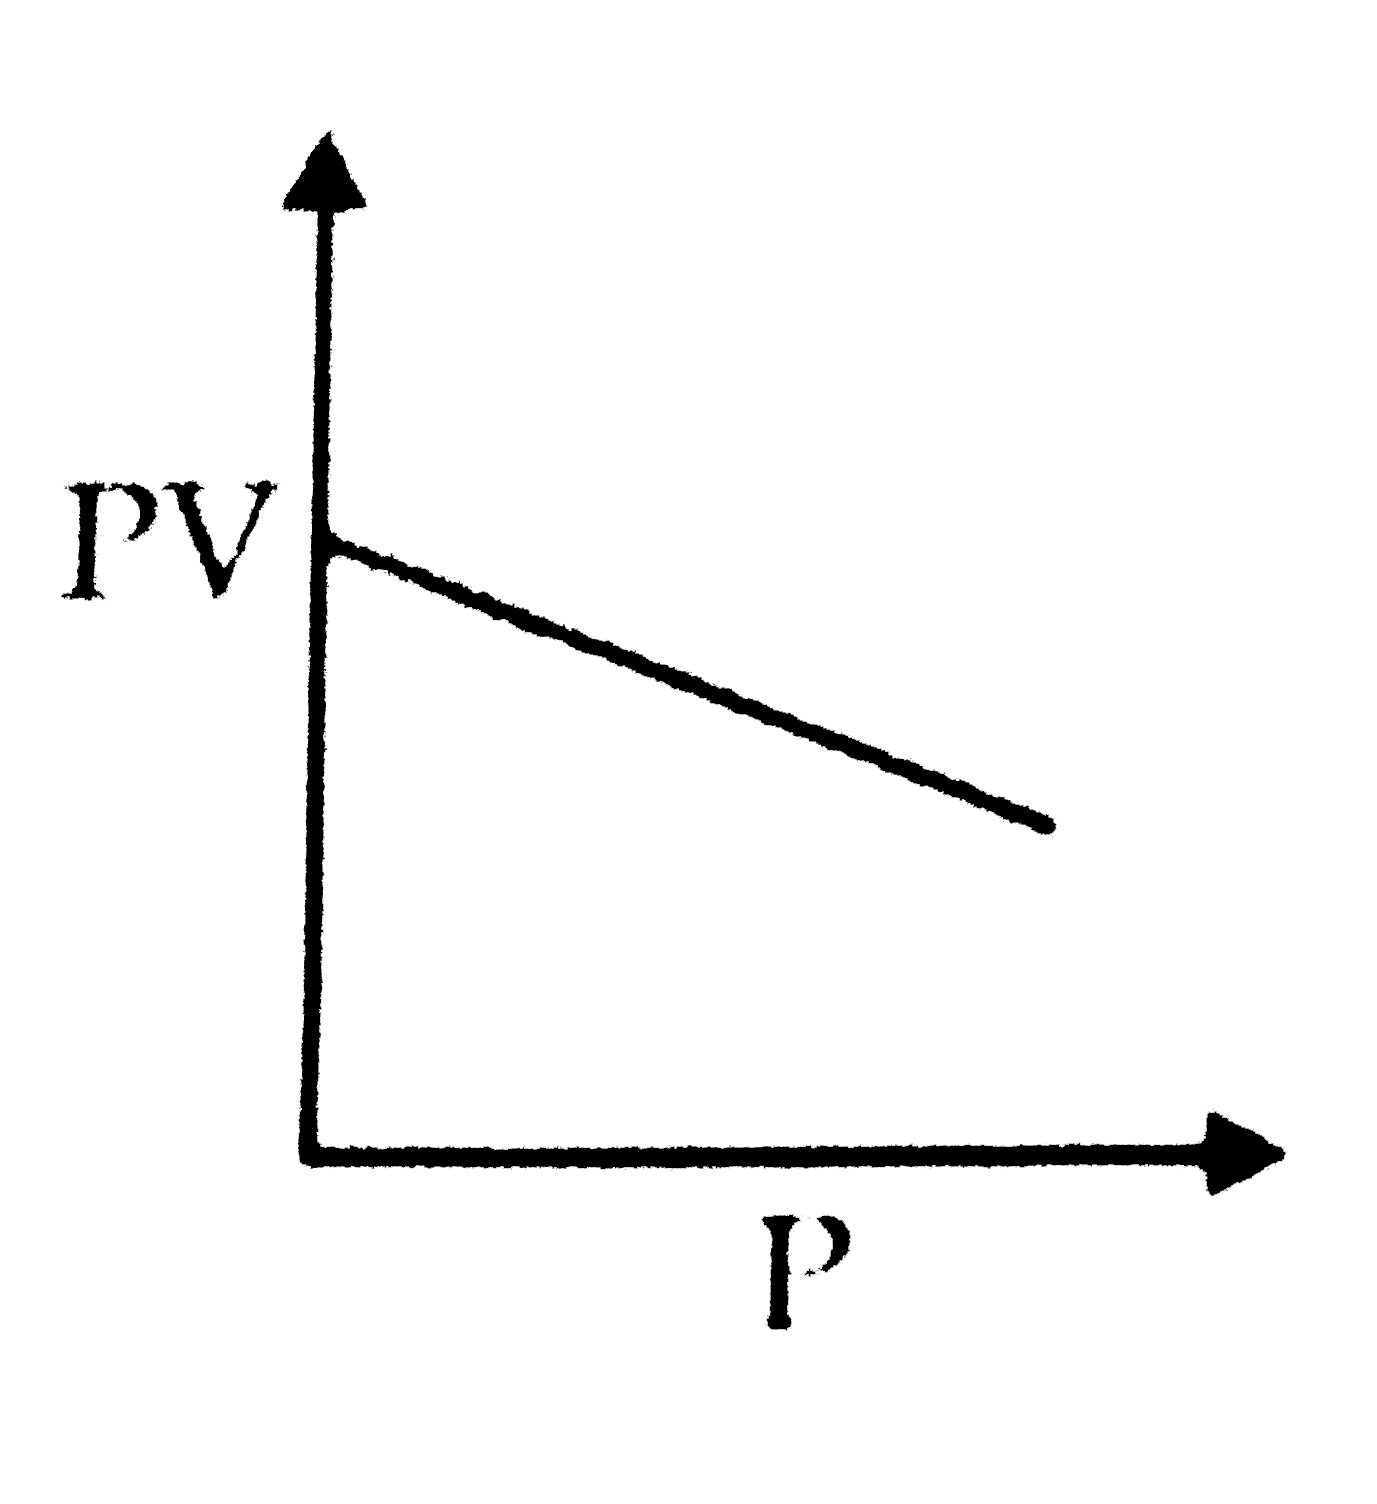
Which of the following plots does not represent Boyle's law?
View SolutionWhich of the following curves does not represent Boyle's law ?
View SolutionWhich of the following curve does not represent Boyle's law?
View SolutionWhich of the following curves does not represent Boyle's law?
View SolutionOne of the following represents the Boyle's law .
View Solution

