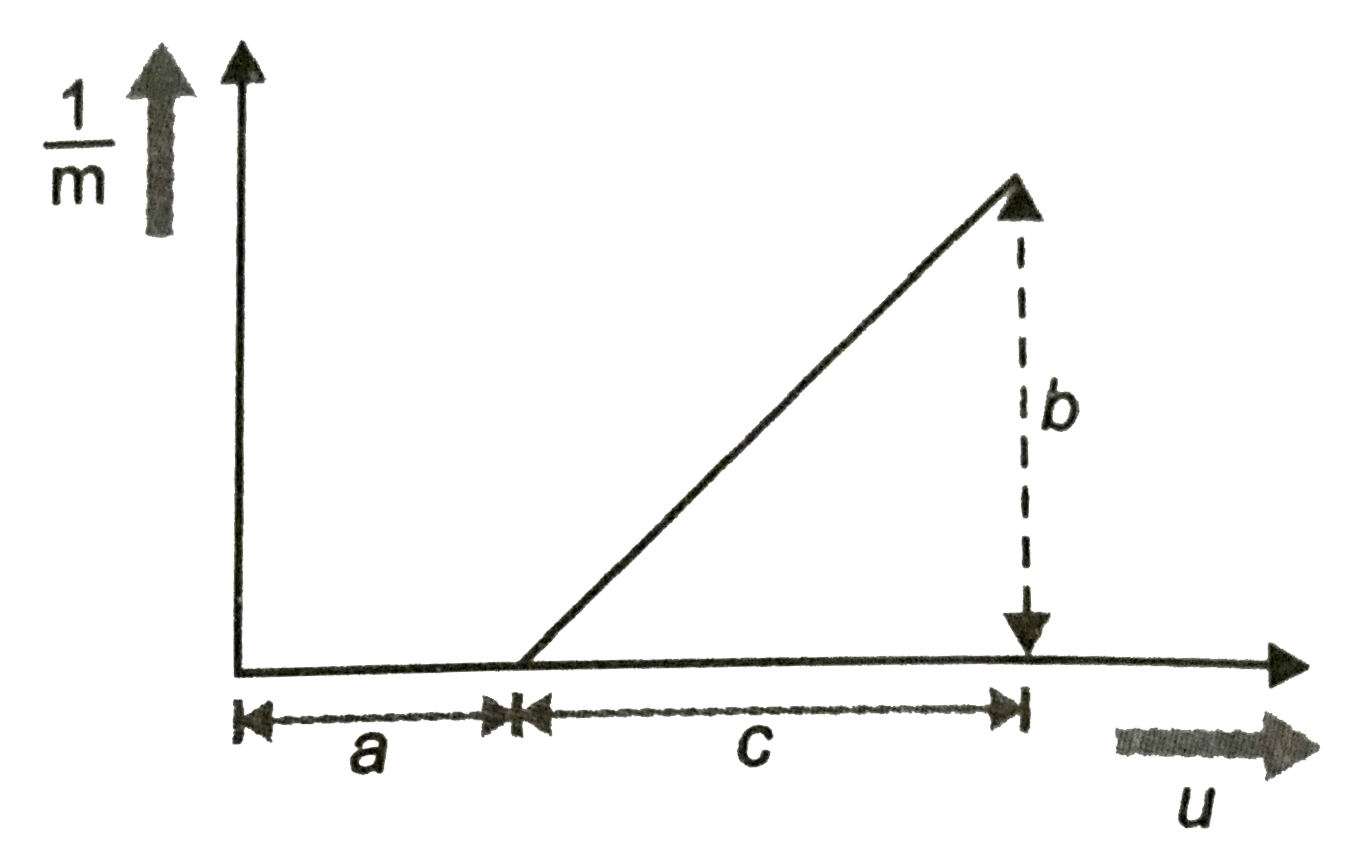
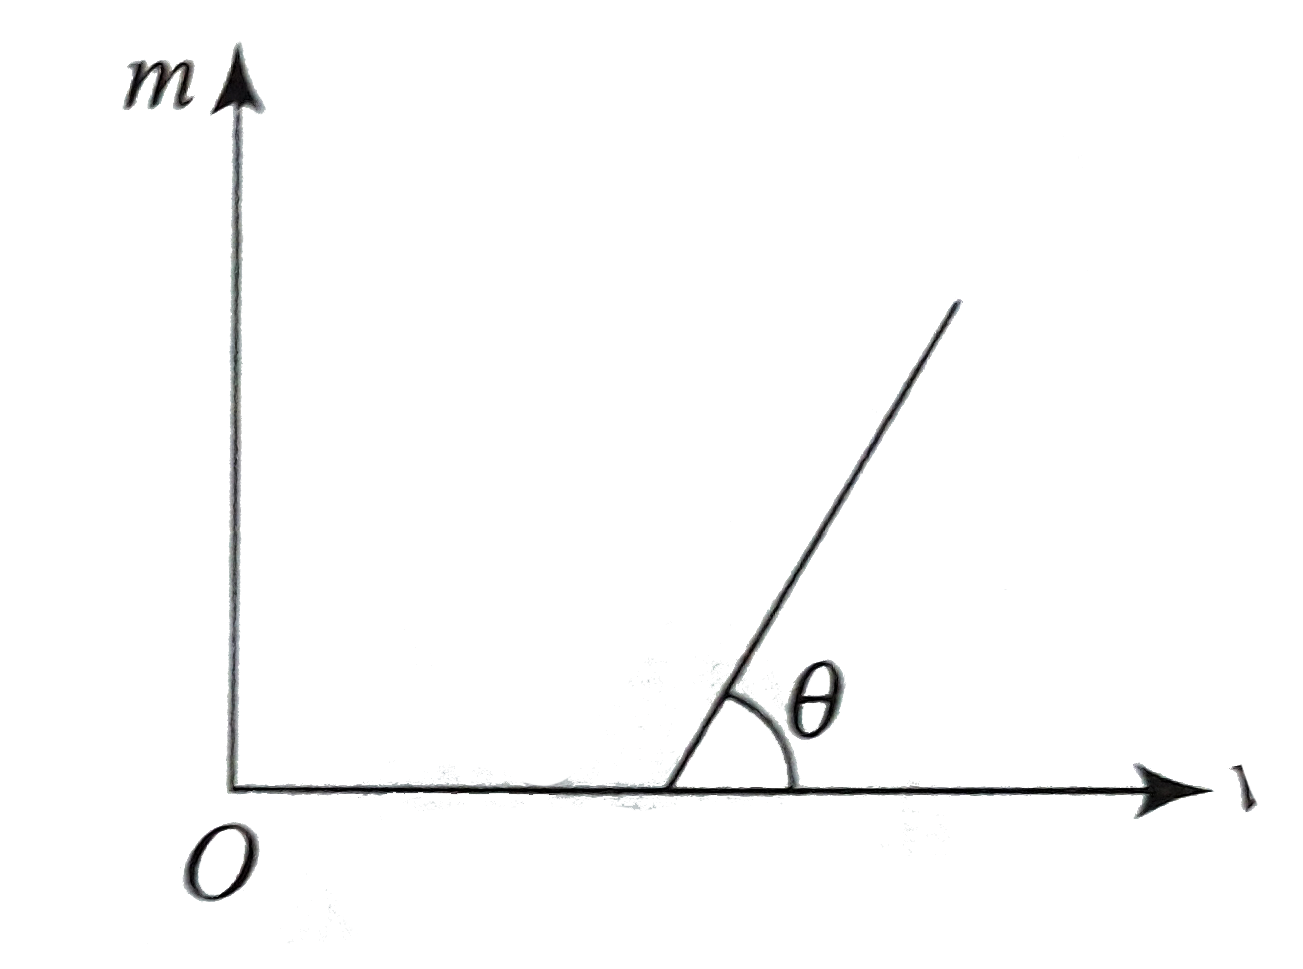
The graph in Fig. shows how the inverse of magnification 1/m produced by a convex thin lens varies with object distance u. What was the focal length of the lens used ?
 .
.
bca
bca
cb
bc
The correct Answer is:C
Step by step video & image solution for The graph in Fig. shows how the inverse of magnification 1//m produced by a convex thin lens varies with object distance u. What was the focal length of the lens used ? . by Physics experts to help you in doubts & scoring excellent marks in Class 12 exams.
Related Playlists
Similar Practice Problems
- Question 1 - Select One
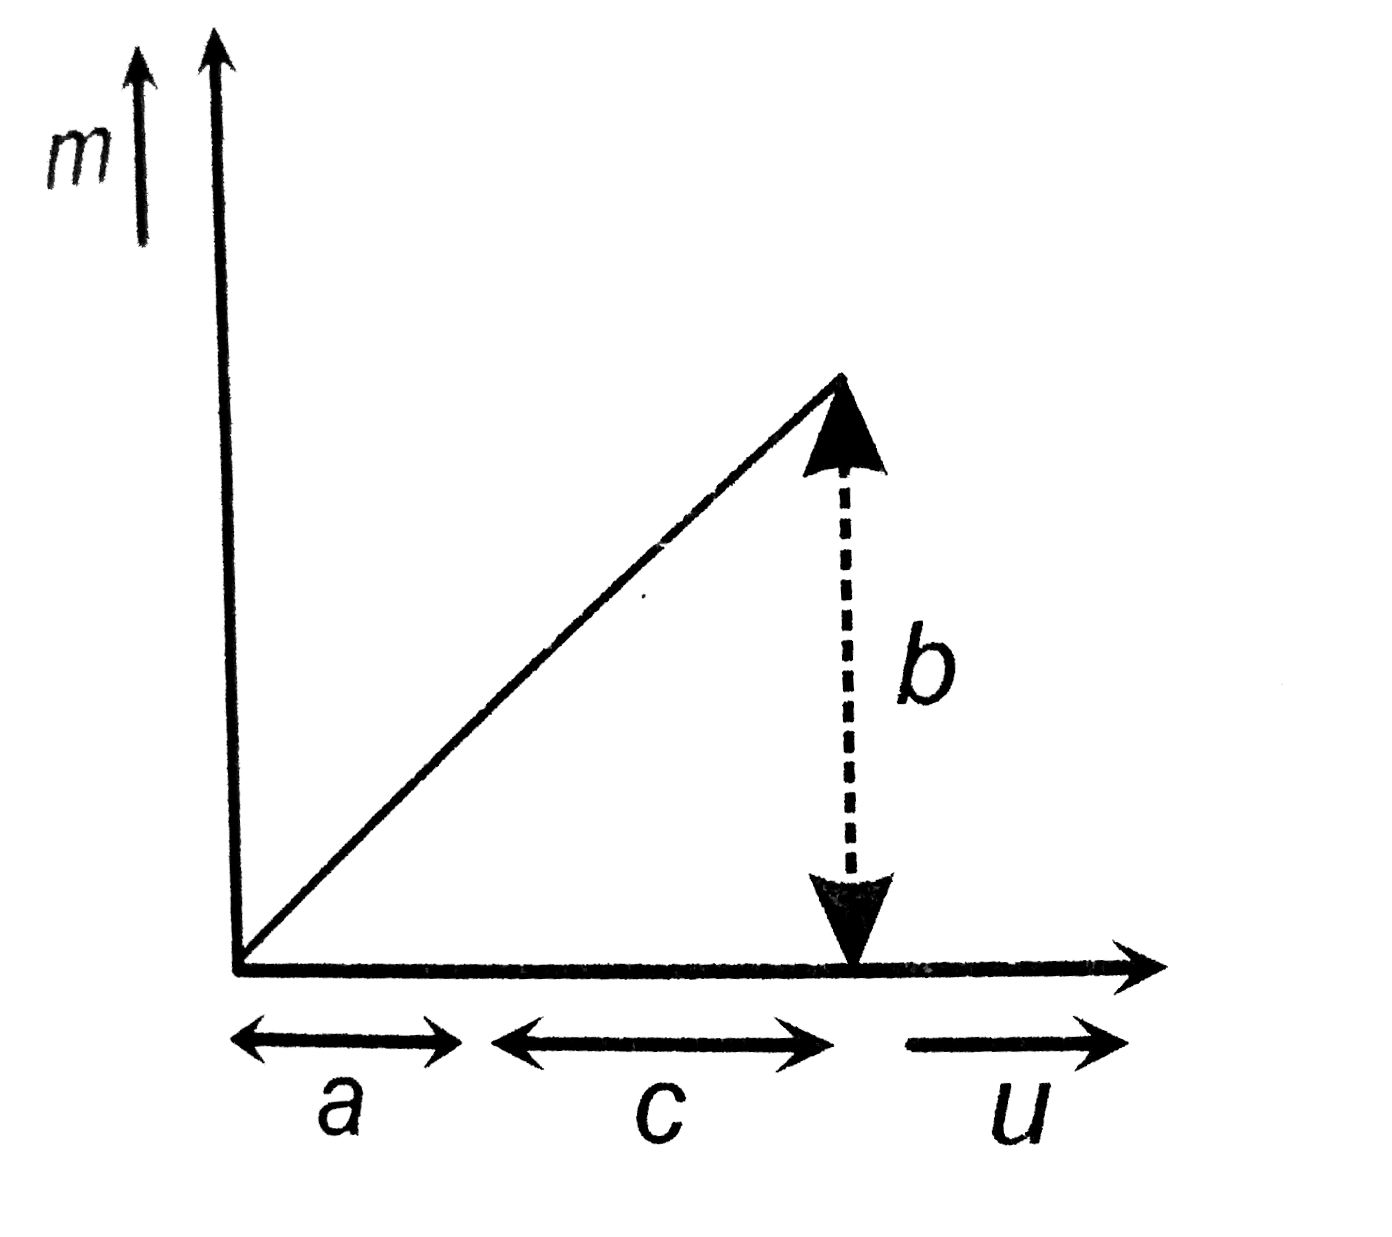
The graph shows how the magnification m produced by a convex thin lens varies with image distance v. What was the focal length of the used ?
 AbcBbcaCbcaDcb
 - Question 1 - Select One
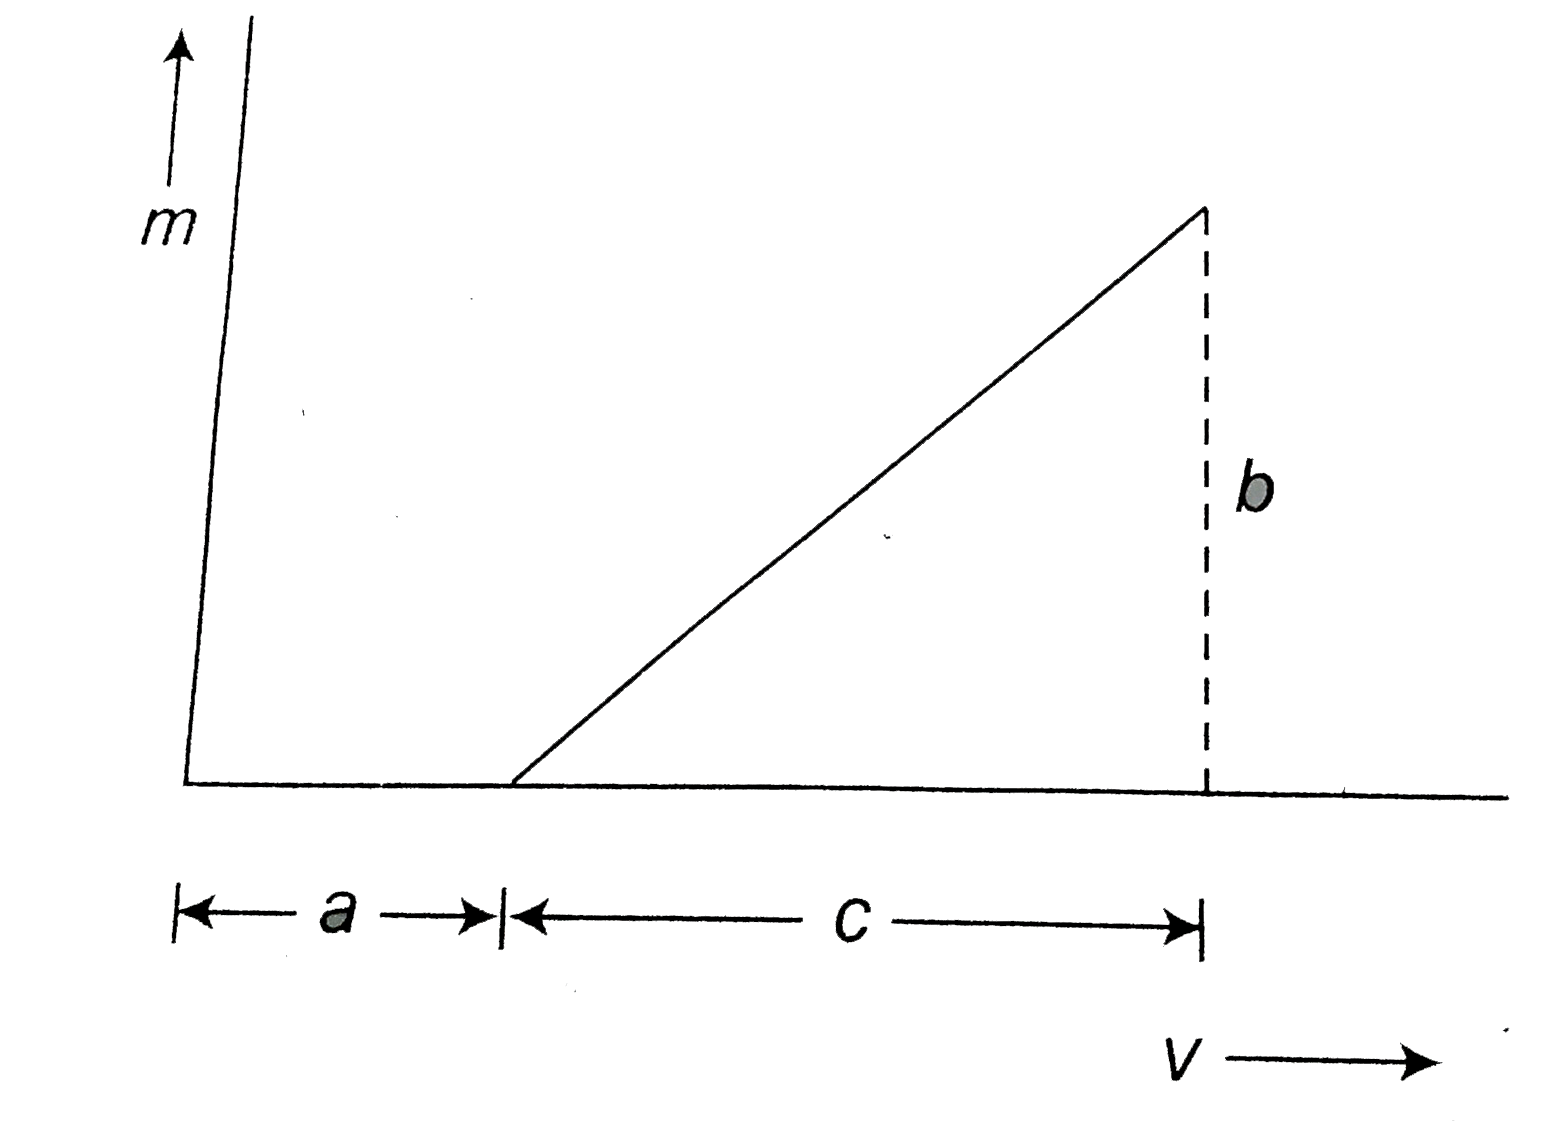
The graps shows the variation of magnification m produced by as convex lens with the image distance v. The focal length of the lens isAbcBcbCaDa,bc - Question 1 - Select One
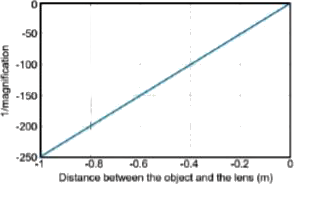
The following graph depicts the inverse of magnification versus the distance between the object and lens data for a setup. The focal length of the lens used in the setup is
 A250 mB0.004 mC125 mD0.002 m
 - Question 1 - Select One
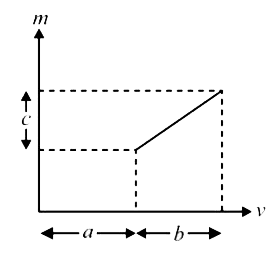
Figure, shows variation of magnification m (produced by a thin convex lens) and distance v of image from pole of the lens. When of the following statements are correct?
 AFocal length of the lens is equal to intercept on v-axisBFocal length of the lens is equal to inverse of slope of the lineCMagnitude of intercept on m-axis is equal to unityDNone of the above
Similar Questions
The graph shows how the magnification m produced by a thin lens varies with image distance v. What is the focal length of the lens used?
 View Solution
The magnification producted by a convex lens is positive or negative depending on the object distance.
True/FalseView SolutionThe following graph depicts the inverse of magnification versus the distance between the object and lens data for a setup. The focal length of the lens used in the setup is
 View Solution
Draw ray diagram showing the image formation by a convex lens when an object is placed at twice the focal length of the lens.
View SolutionA thin converging lens forms the real image of certain real object magnified m times.The magnification of real image become n when lens is moved nearer to object by distance x . find focal length of the lens
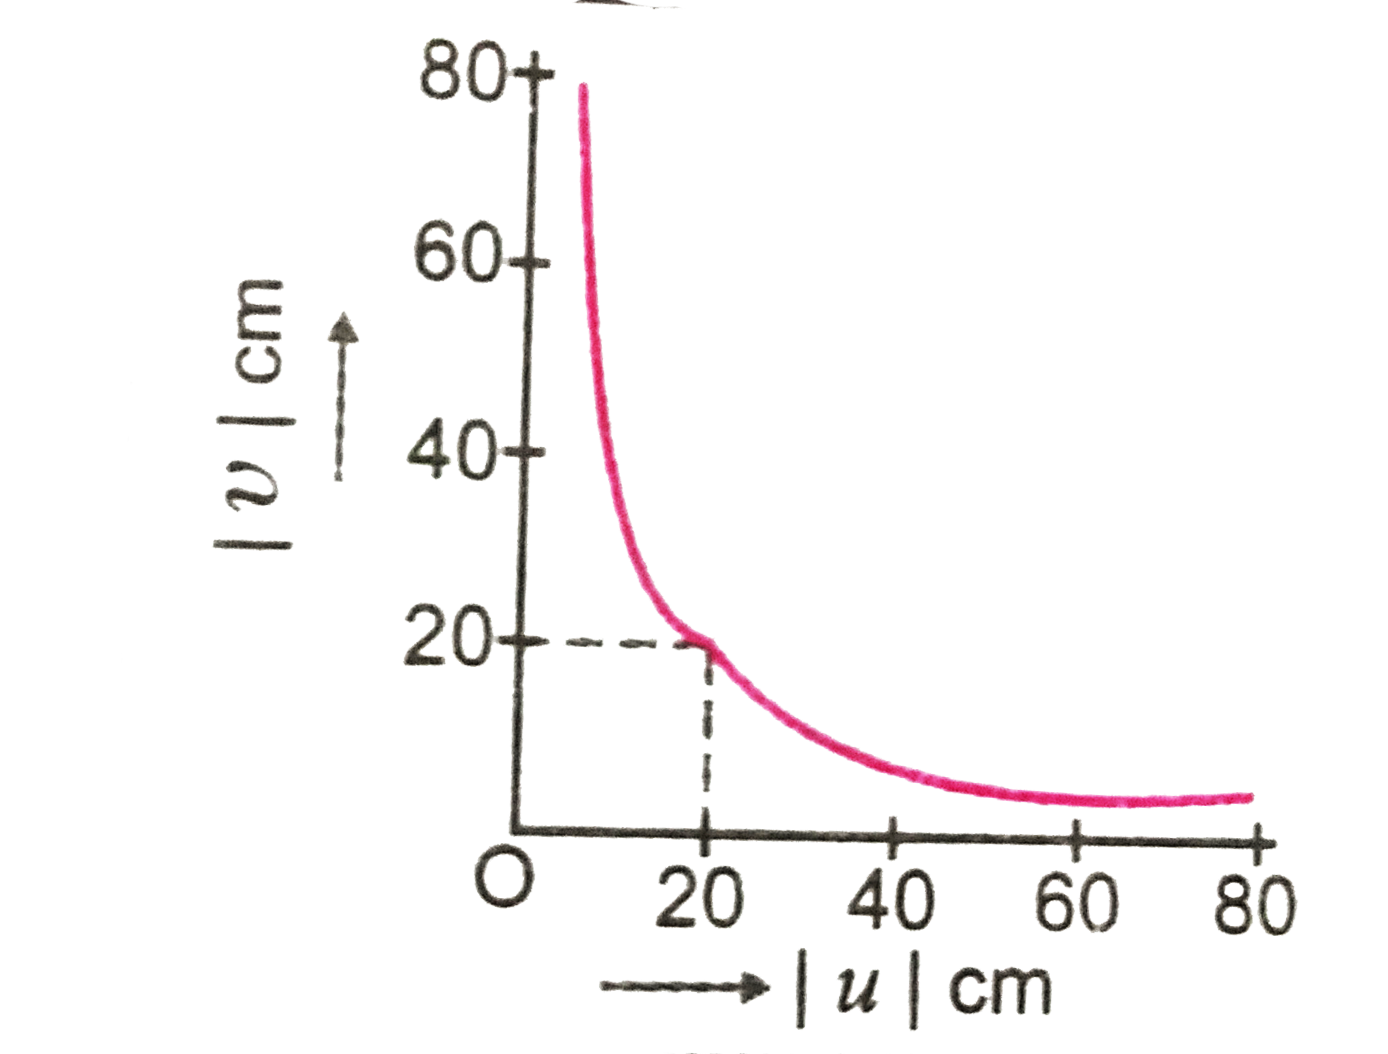
View SolutionThe graph in shows the variation of image distance (v) with object distance (u) in case of a lens. Find focal length of the lens. What is the nature of the lens, if image formed is real ?
 .View Solution

