The following graph shows the range of variation among population members for a trait determined by multiple genes.
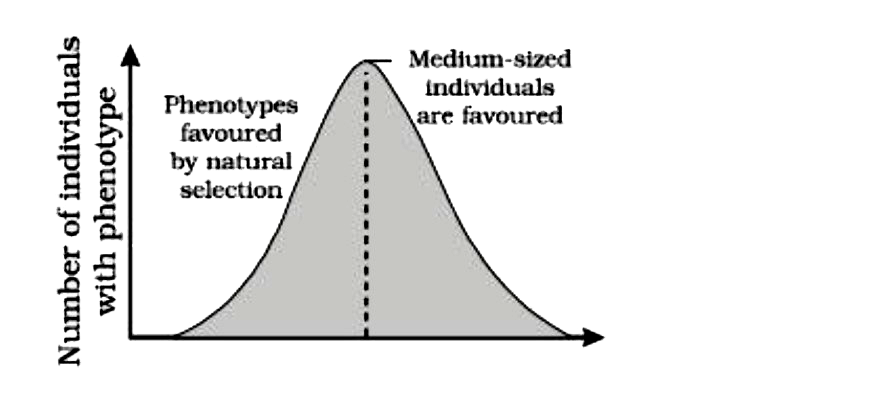
If this population is subject to stabilizing selection for several generations, which of the distribution is most likely to result ?

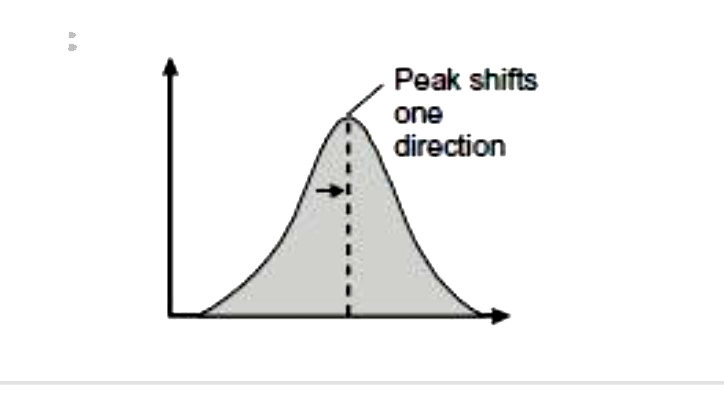

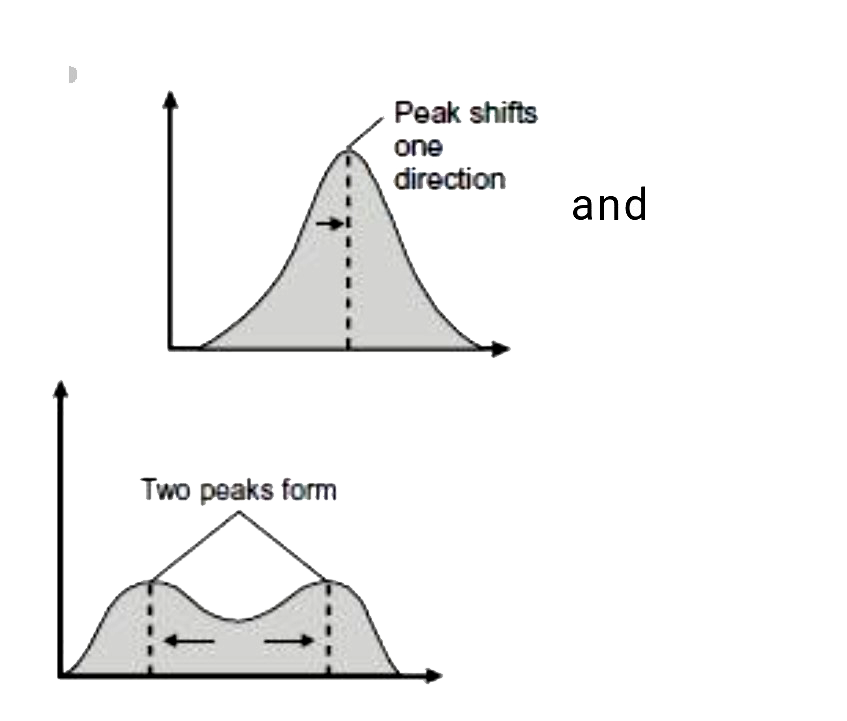
The correct Answer is:A
Step by step video & image solution for The following graph shows the range of variation among population members for a trait determined by multiple genes. If this population is subject to stabilizing selection for several generations, which of the distribution is most likely to result ? by Biology experts to help you in doubts & scoring excellent marks in Class 12 exams.
Updated on:21/07/2023Topper's Solved these Questions
Similar Questions
Differences between the members of a population will most likely be passed to future generations if they are:
View SolutionYou discovered a novel eukaryotic organism that glows in the dark. You believe this trait is due to a single gene, and you wish to clone the gene. Which of the following strategies is most likely to be successful ?
View Solution
Knowledge Check
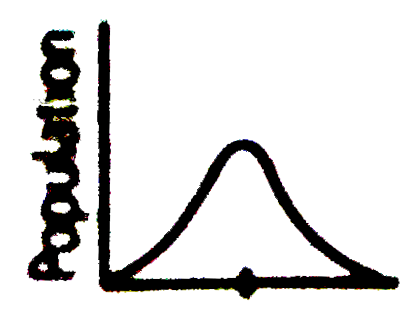
The given graph shows the range of variation among population members for a trait determined by multiple genes. If this population is subjected to disruptive selection for several generations, which of the following distributions is most likely to result?
 A
A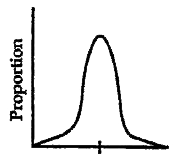 B
B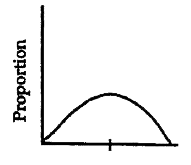 C
C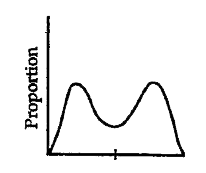 D
D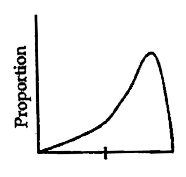
The given graph shows the range of variation among population members for a trait determined by multiple genes. If this population is subjected to disruptive selection for several generations, which of the following distributions is most likely to result?
 A
A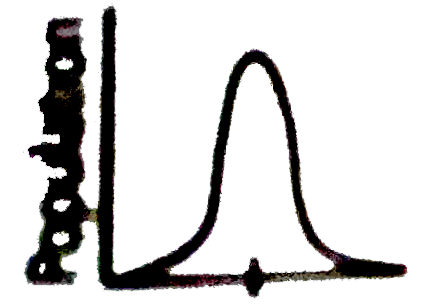 B
B C
C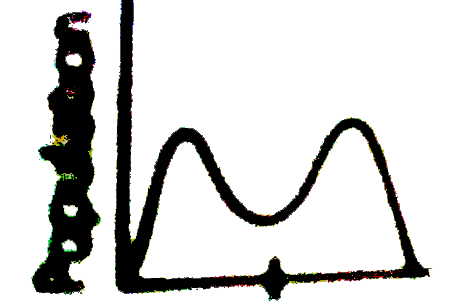 D
D
Which one of the following map shows the population distribution?
AChoropleth mapsBIsopleth mapsCDot mapsDSquare root map
Among the following countries, which one is most densely populated ?
View SolutionWhich among the following is the third most populated country in Asia?
View SolutionYou are studying leaf size in a population of plants. The second session is particularly dryand the following year the average leaf size in the population is smaller than the year before. But the amount of the overall variation is the same and the population size is not changed. Also you have done experiments that show that small leaves are better adapted to dry conditions than are large leaves. Which of the following has occurred?
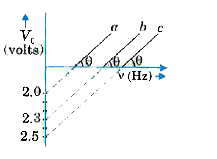
View SolutionThe following graph shows the variation of stopping potential with frequency for three different metals a, b and c . A light wave having wavelength 550 nm is falling on th metal surface a,b,c one by one. Which metal plate with generate photoelectric current?
View SolutionWhich of the following ways is most likely to decrease the genetic diversity in a population ?
View Solution
