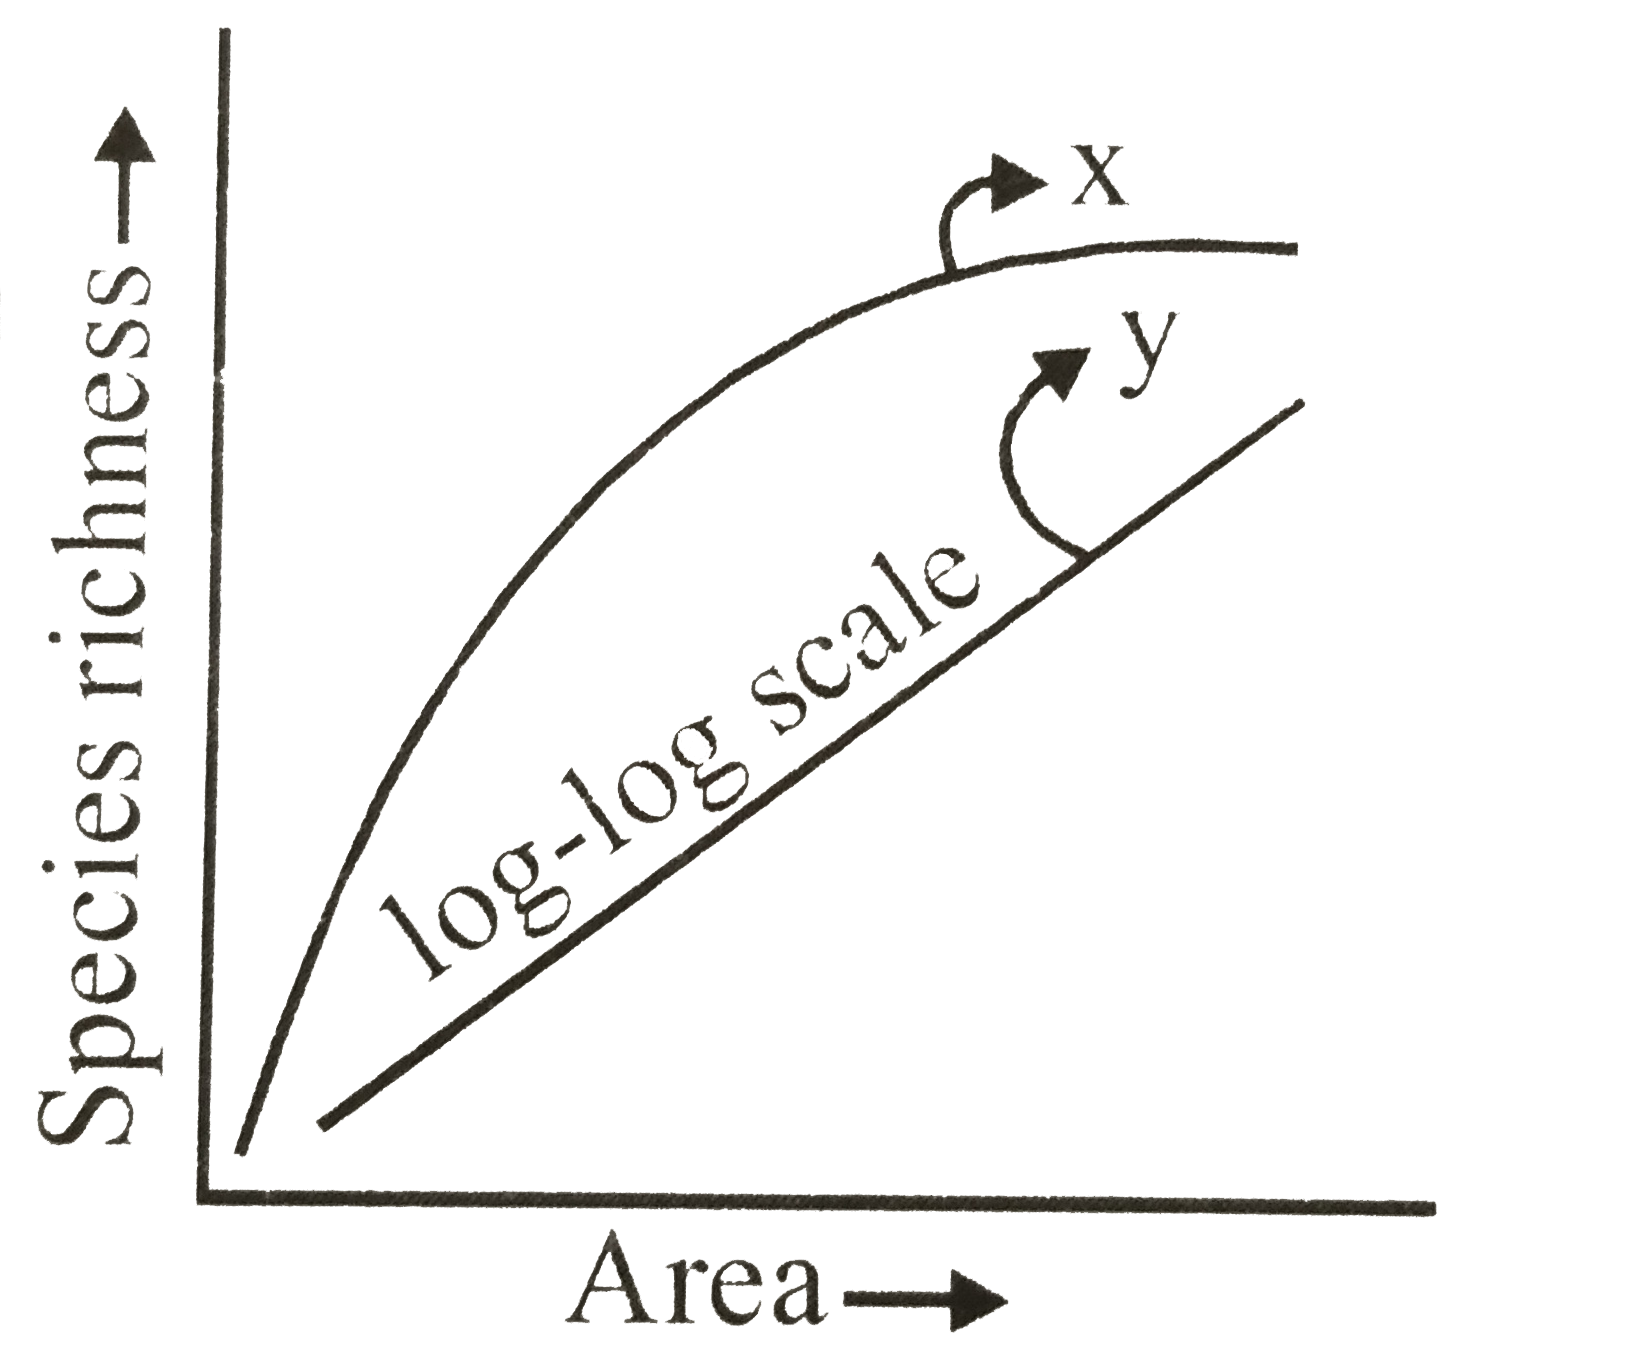
In mollusks of New York state, which of these experiences gives you a value between 0.1 to 0.2?
( S = log of species richness, A = log of Area, C = log of Y- intercept in the species richness area curve)
S−CA
S−AC
C−AS
A−SC
The correct Answer is:A
To solve the question regarding the values in mollusks of New York state and their relationship with species richness, area, and the y-intercept in the species-area curve, we can follow these steps:
1. Understand the Variables:
- S: log of species richness
- A: log of area
- C: log of y-intercept in the species richness-area curve
2. Species-Area Relationship:
- The species-area relationship can be expressed as:
S=C+Z⋅A
- Here, Z represents the slope of the line in the log-log plot of species richness against area.
3. Identify the Range for Z:
- According to the information provided, the value of Z (the slope) typically falls between 0.1 and 0.2 for specific taxonomic groups in a defined area.
4. Rearranging the Equation:
- To find Z, we can rearrange the species-area relationship equation:
Z=S−CA
- This means that Z can be calculated if we know the values of S, C, and A.
5. Conclusion:
- Since the question asks for a value that falls between 0.1 and 0.2, we conclude that Z, which represents the slope of the species-area relationship curve for mollusks in New York state, is the value that fits this criterion.
Final Answer:
The value that experiences a range between 0.1 to 0.2 in mollusks of New York state is Z (the slope of the species-area relationship).
---
- S: log of species richness
- A: log of area
- C: log of y-intercept in the species richness-area curve
- The species-area relationship can be expressed as:
S=C+Z⋅A
- Here, Z represents the slope of the line in the log-log plot of species richness against area.
- According to the information provided, the value of Z (the slope) typically falls between 0.1 and 0.2 for specific taxonomic groups in a defined area.
- To find Z, we can rearrange the species-area relationship equation:
Z=S−CA
- This means that Z can be calculated if we know the values of S, C, and A.
- Since the question asks for a value that falls between 0.1 and 0.2, we conclude that Z, which represents the slope of the species-area relationship curve for mollusks in New York state, is the value that fits this criterion.
The value that experiences a range between 0.1 to 0.2 in mollusks of New York state is Z (the slope of the species-area relationship).
Topper's Solved these Questions
Similar Questions

Study the above graph and answer the following questions -
(i) Identify x and y
(ii) The relation between species richness and area can be denoted as generally
(iii) The value of z lies in range of
(iv) On a log scale the relation between species richness and area is
View SolutionRelationship between species richness (S) and area (A) represent in the following graph is described by the equation

View Solution
Knowledge Check
Which of these examples will have the steepest curve when log of species richness and log of area are plotted on a graph?
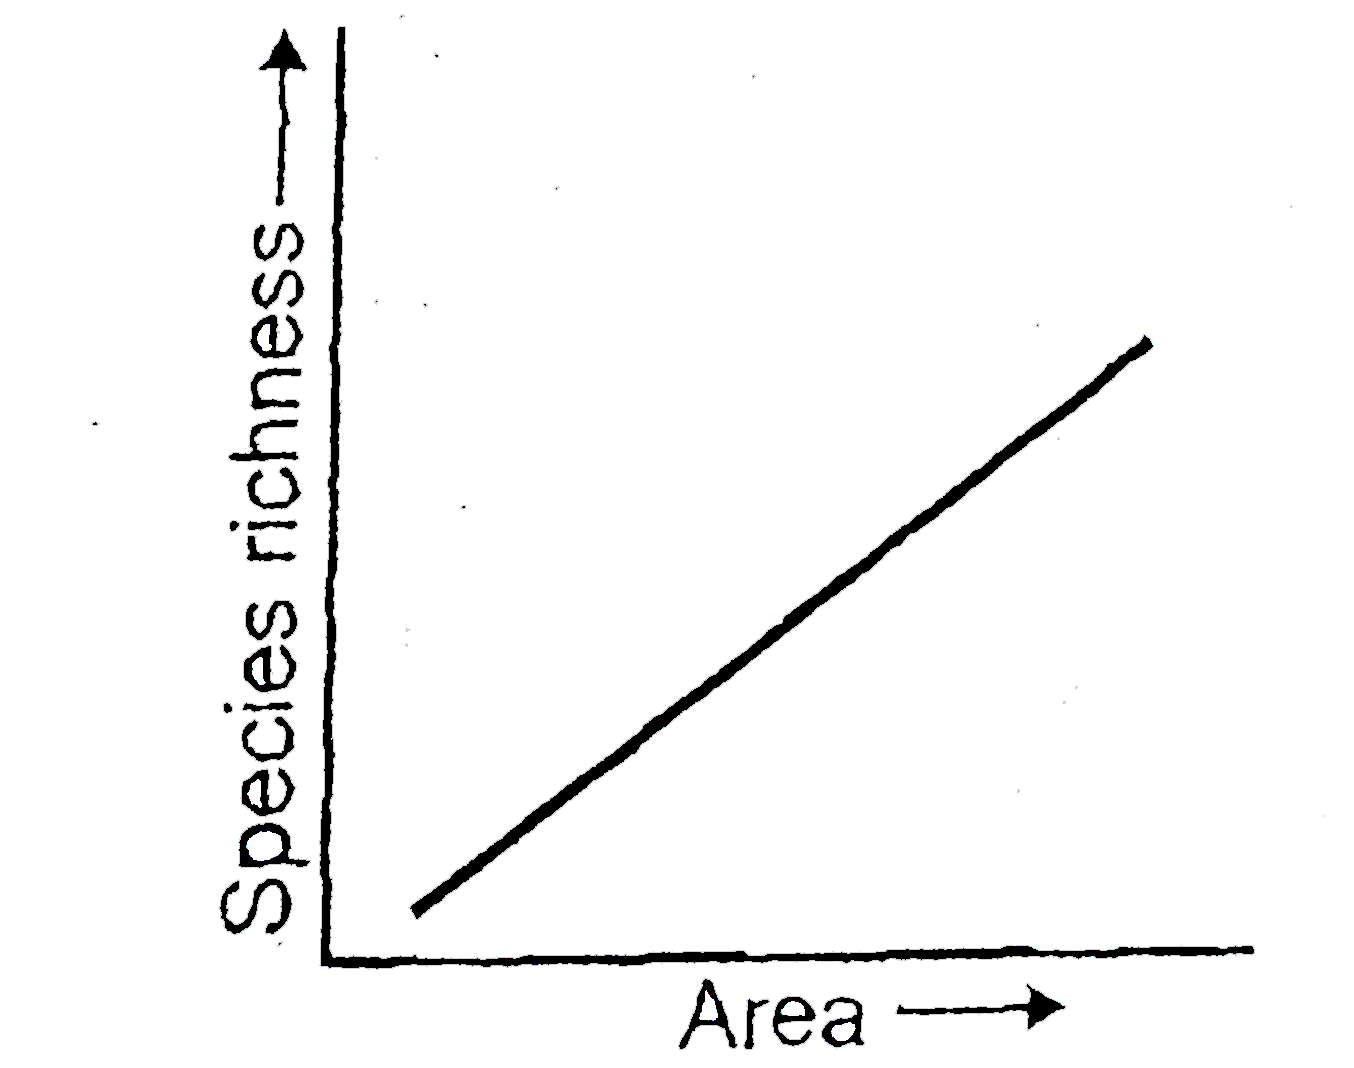
Aplants in BritainBbirds in CaliforniaCmolluscs in New York StateDmammals in the tropical forests of different continentsA graph of species richness vs area on log-log axes is
AlinearBsigmoidalCoscillatoryDparabolicThe relation between specises richness and area is described on a logarithmic scale by the equation [where S = species richness, A = area, Z = slope of the line (regression coefficient ), C= Y - intercept]
Alog S = log CBlog S = Z log AClogS=logC−ZlogADlogS=logC+ZlogA
Which of the statement are in accordance with the observation of geographer Alexander von Humboldt ?
I. Within a region species, richness increases with increasing explored area but within a limit.
II. The relation between species richness and area is a rectangular hyperbole.
III. The richness of species decreases with the increasing explored area.
IV. There is no relation between the explored area and species richness .
View SolutionAlexander von Humboldt is associated with
(a.) species - area relationship
(b.) log S = log C + z logA
(C.) Within a region , species richness increases with the increasing limited explored area.
(d.) Increased diversity contributes to higher productivity.
(e.) Species diversity increases with the loss of keystone species.
View SolutionThe area enclosed between the curve y=loge(x+e) and the coordinate axes is
View SolutionFor relation 2logy−logx−log(y−1)=0
View SolutionArea bounded by the curve y = log x, the X-axis and the lines x = e, x = 2e is
View Solution
