
This graph indicates:
Stabilizing selection
Directional selection
Disruptive selection
Industrial selection
The correct Answer is:A
Step by step video & image solution for This graph indicates: by Biology experts to help you in doubts & scoring excellent marks in Class 12 exams.
Updated on:21/07/2023Topper's Solved these Questions
Similar Questions
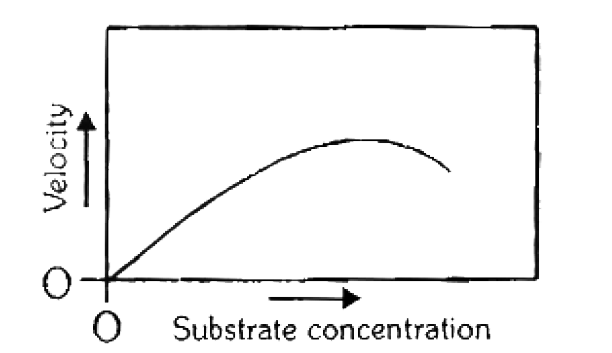
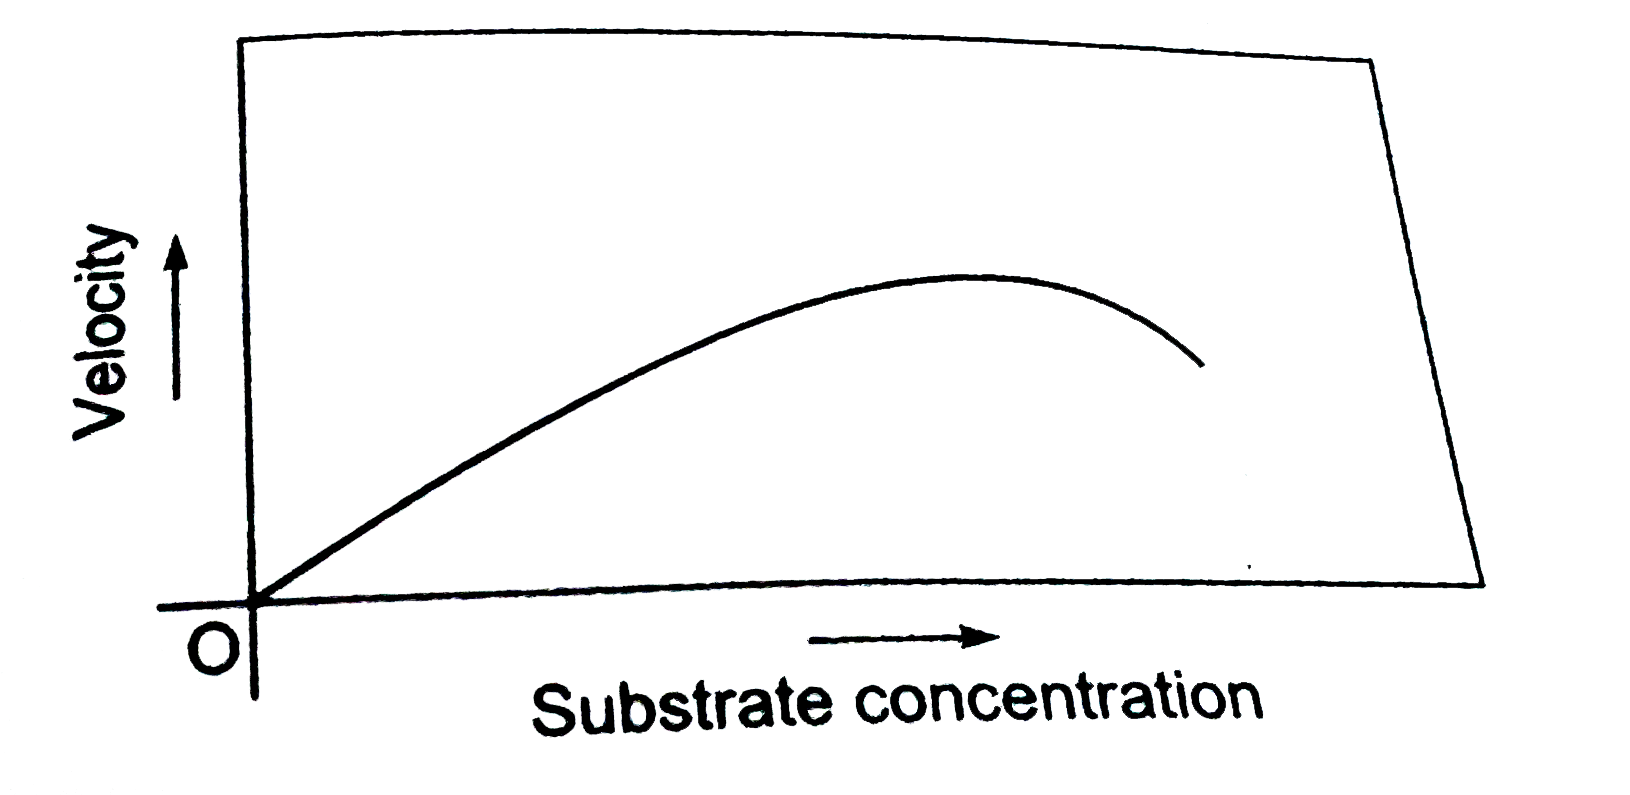
The graph given below shows the effect of substrate concentration on the rate of reaction of the enzyme green-gram-phosphatase What does the graph indicates?
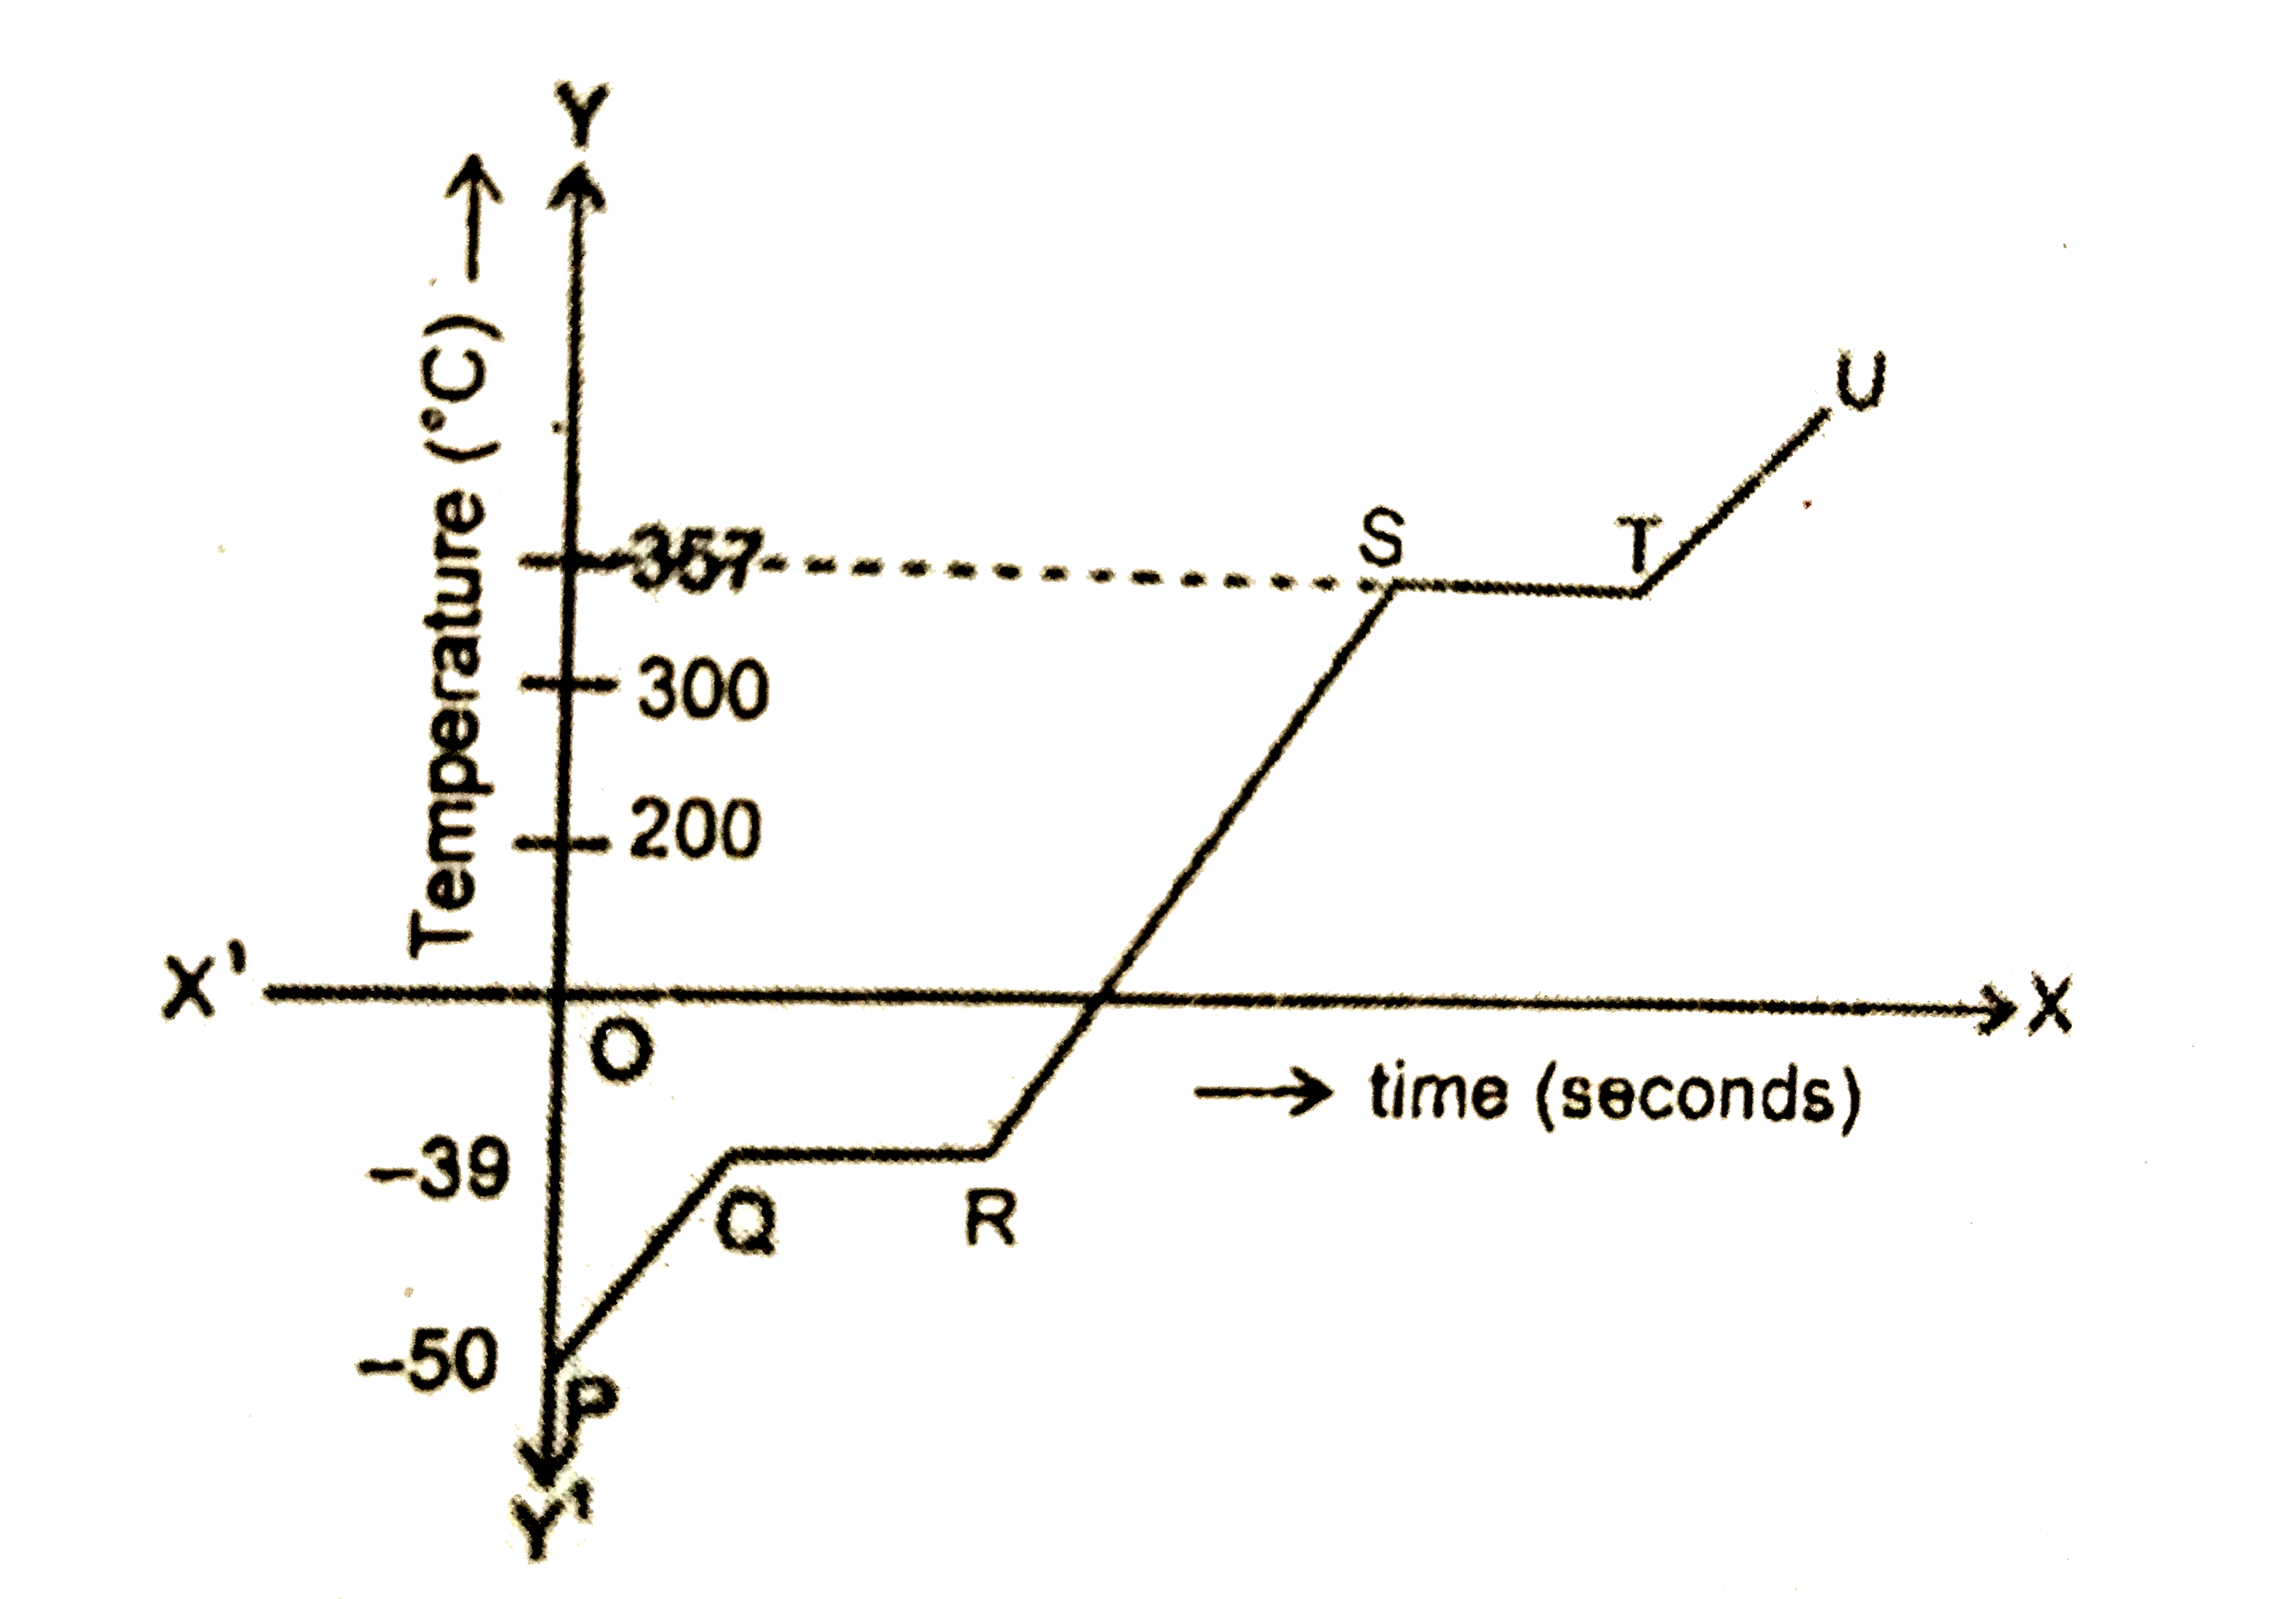
View SolutionThe heating curve of a paritcular substance in solid state is as shown in the figure .choose the correct alternative
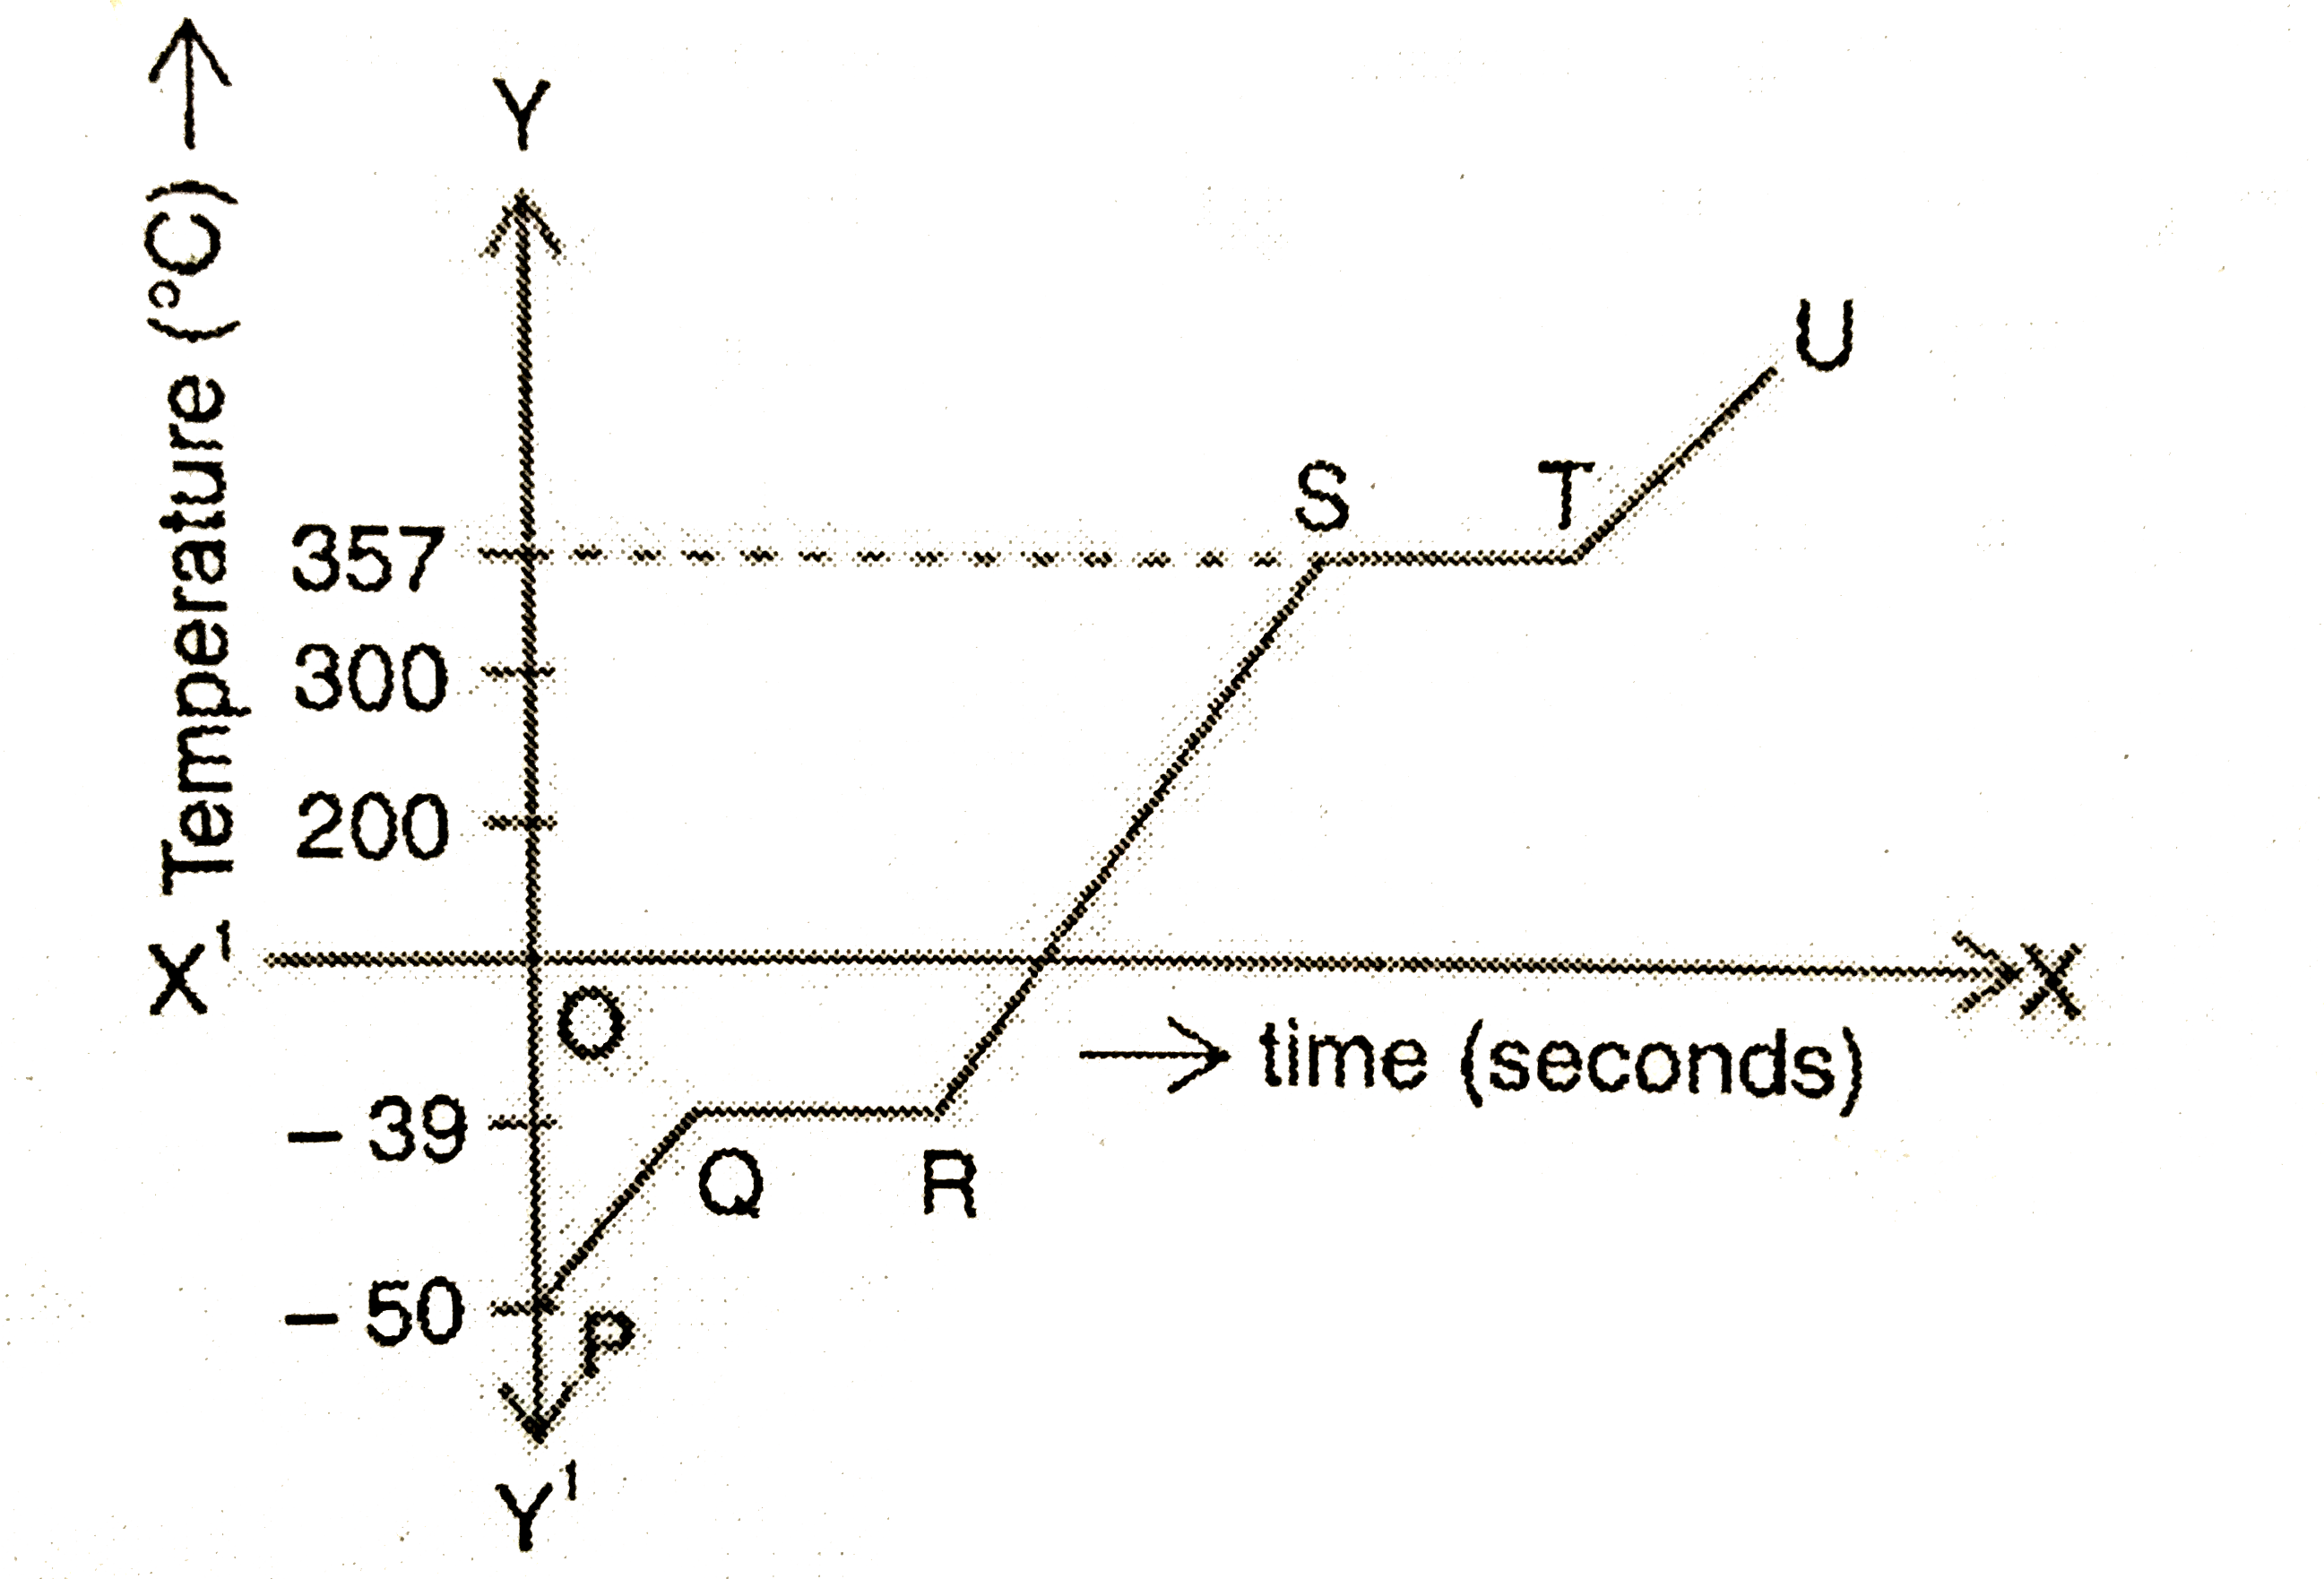
The porition QR of the graph indicates
View Solution
Knowledge Check
In an experiment freshly hatched larvae of an insect (Khapra beetle) were reared on a basal diet (complete diet without cholesterol) with increasing amounts of cholesterol. Results obtained are shown in the graph given in the table : The graph indicates that
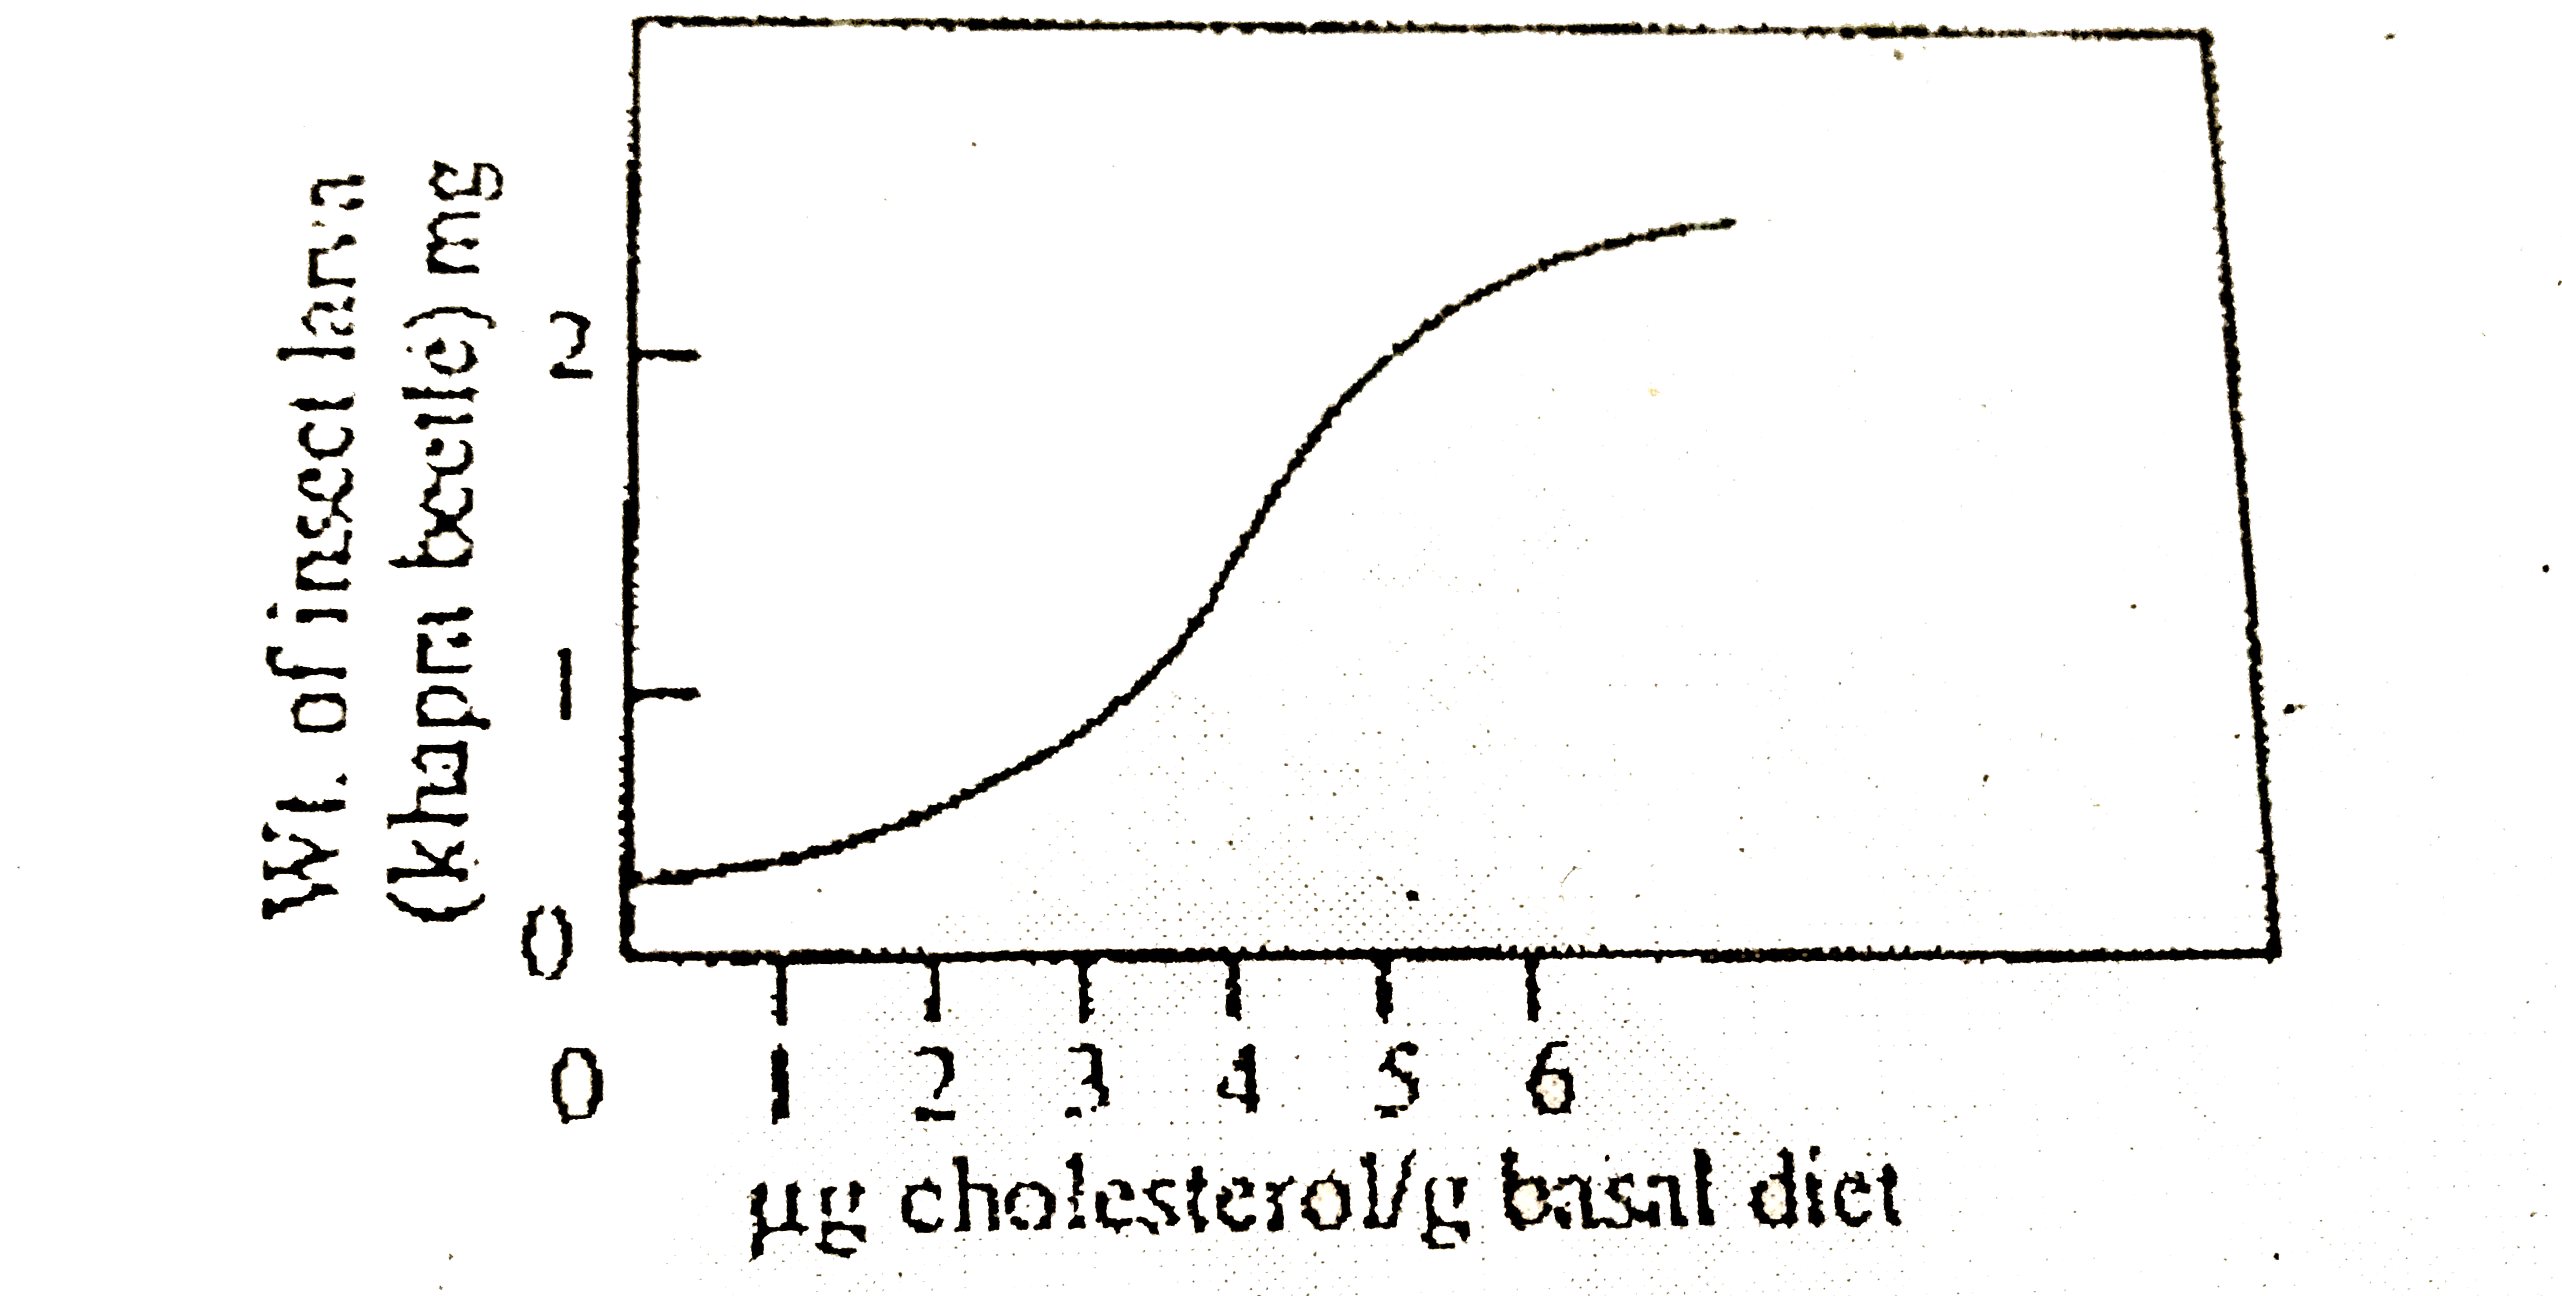 Acholesterol is an essential dietary requirement of khapra beetleBgrowth of khapra beetle is directly proportional to cholesterol concentrationCcholesterol concentration of 2μgg diet is the optimum levelDgrowth of khnpra beetle is inhibited when cholesterol concentration exceedsμg/g diet.
The distance of a particle as a function of time is shown here. The graph indicates that
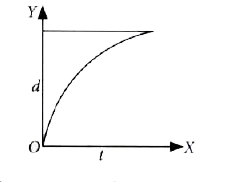 Athe particle starts with certain velocity but the motion is retarded and finally the particle stops.Bthe velocity of the particle is constant throughout.Cthe acceleration of the particle is constant throughout.Dthe particle starts with another constant velocity, the motion is in acceleration and finally the particle moves with another constant velocity.
The heating curve of a paritcular substance in solid state is as shown in the figure .choose the correct alternative

The porition QR of the graph indicatesAno change in heat energy.Bchange in temperature.Cchange of state.DBoth (b) and (c).
The heating curve of a paritcular substance in solid state is as shown in the figure .choose the correct alternative

The porition QR of the graph indicates
View SolutionWhen two plants L and M were exposed to different light intensities and temperature they showed changes in their rates of photosynthesis. Which have been represented in the following graph.
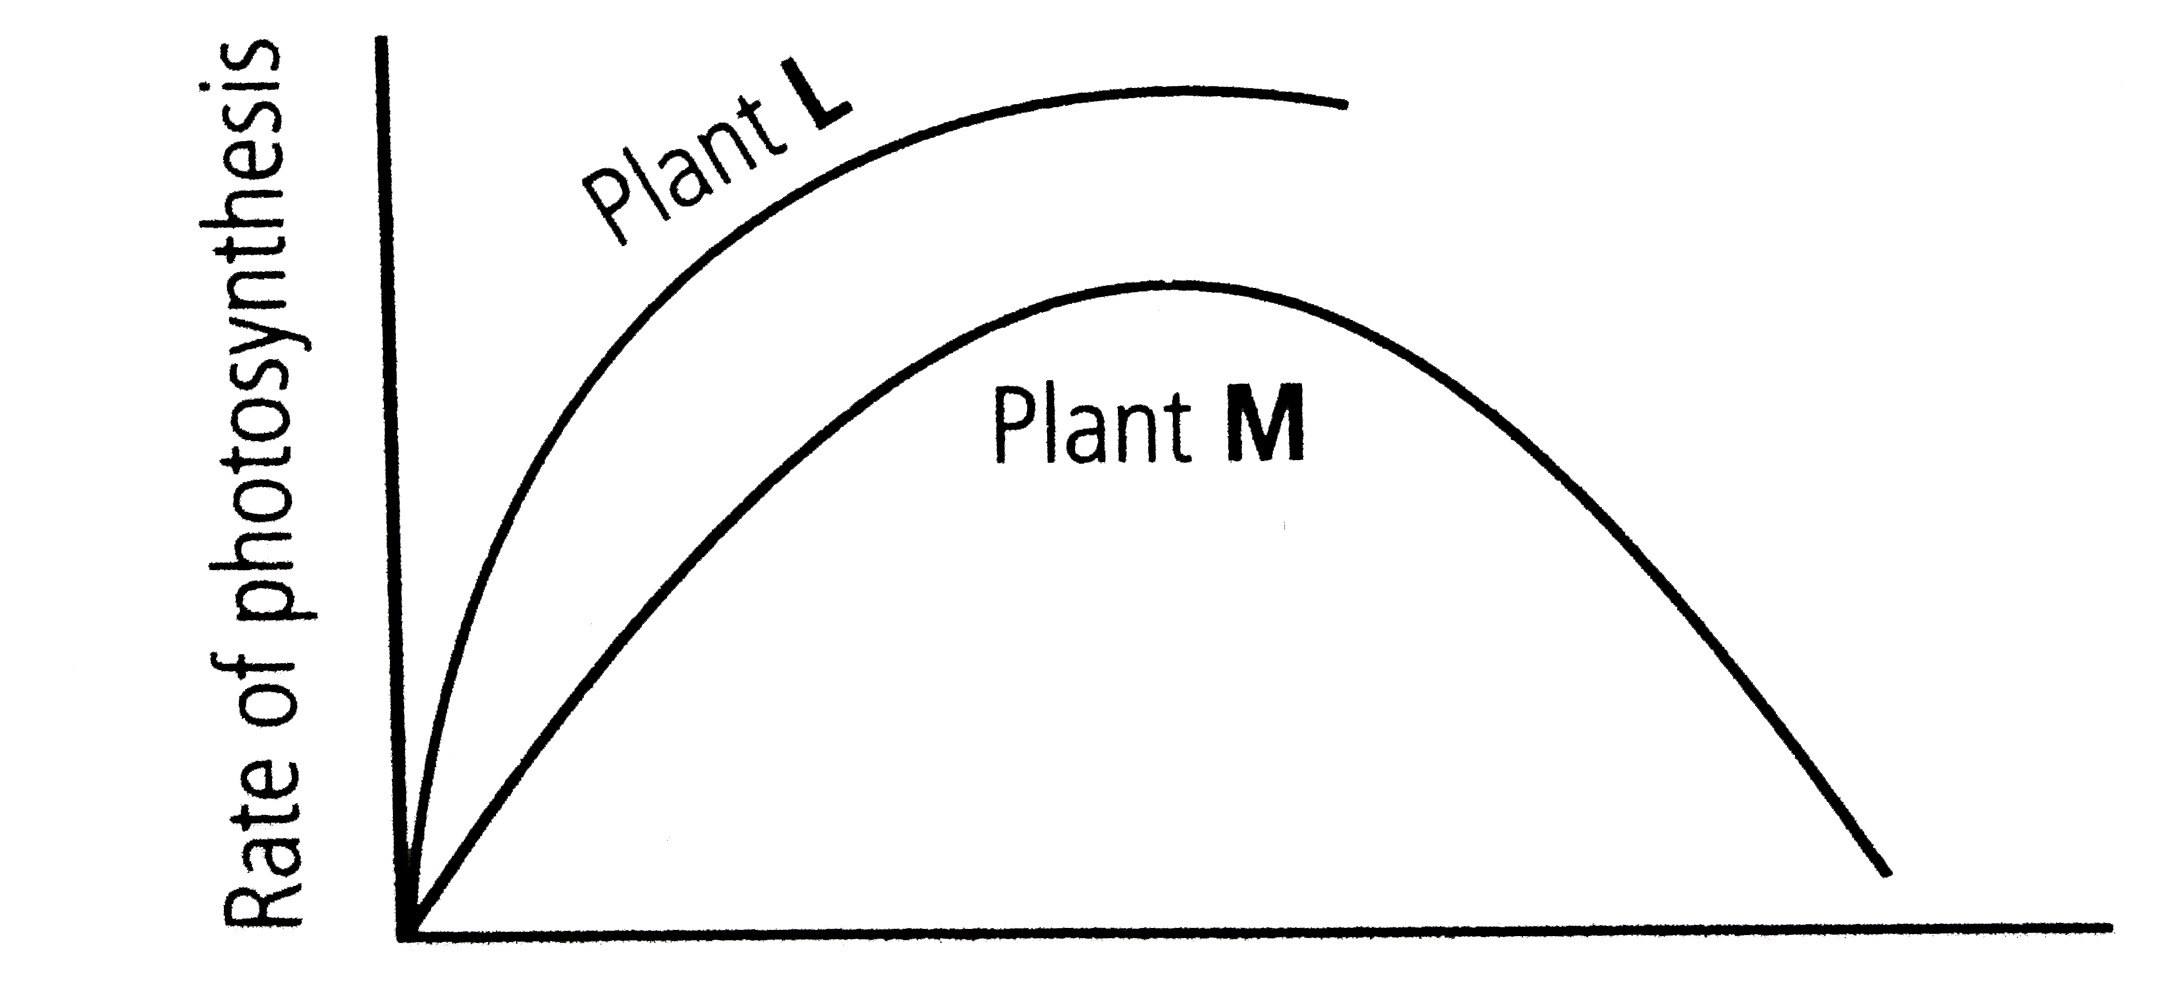
The graph indicates that
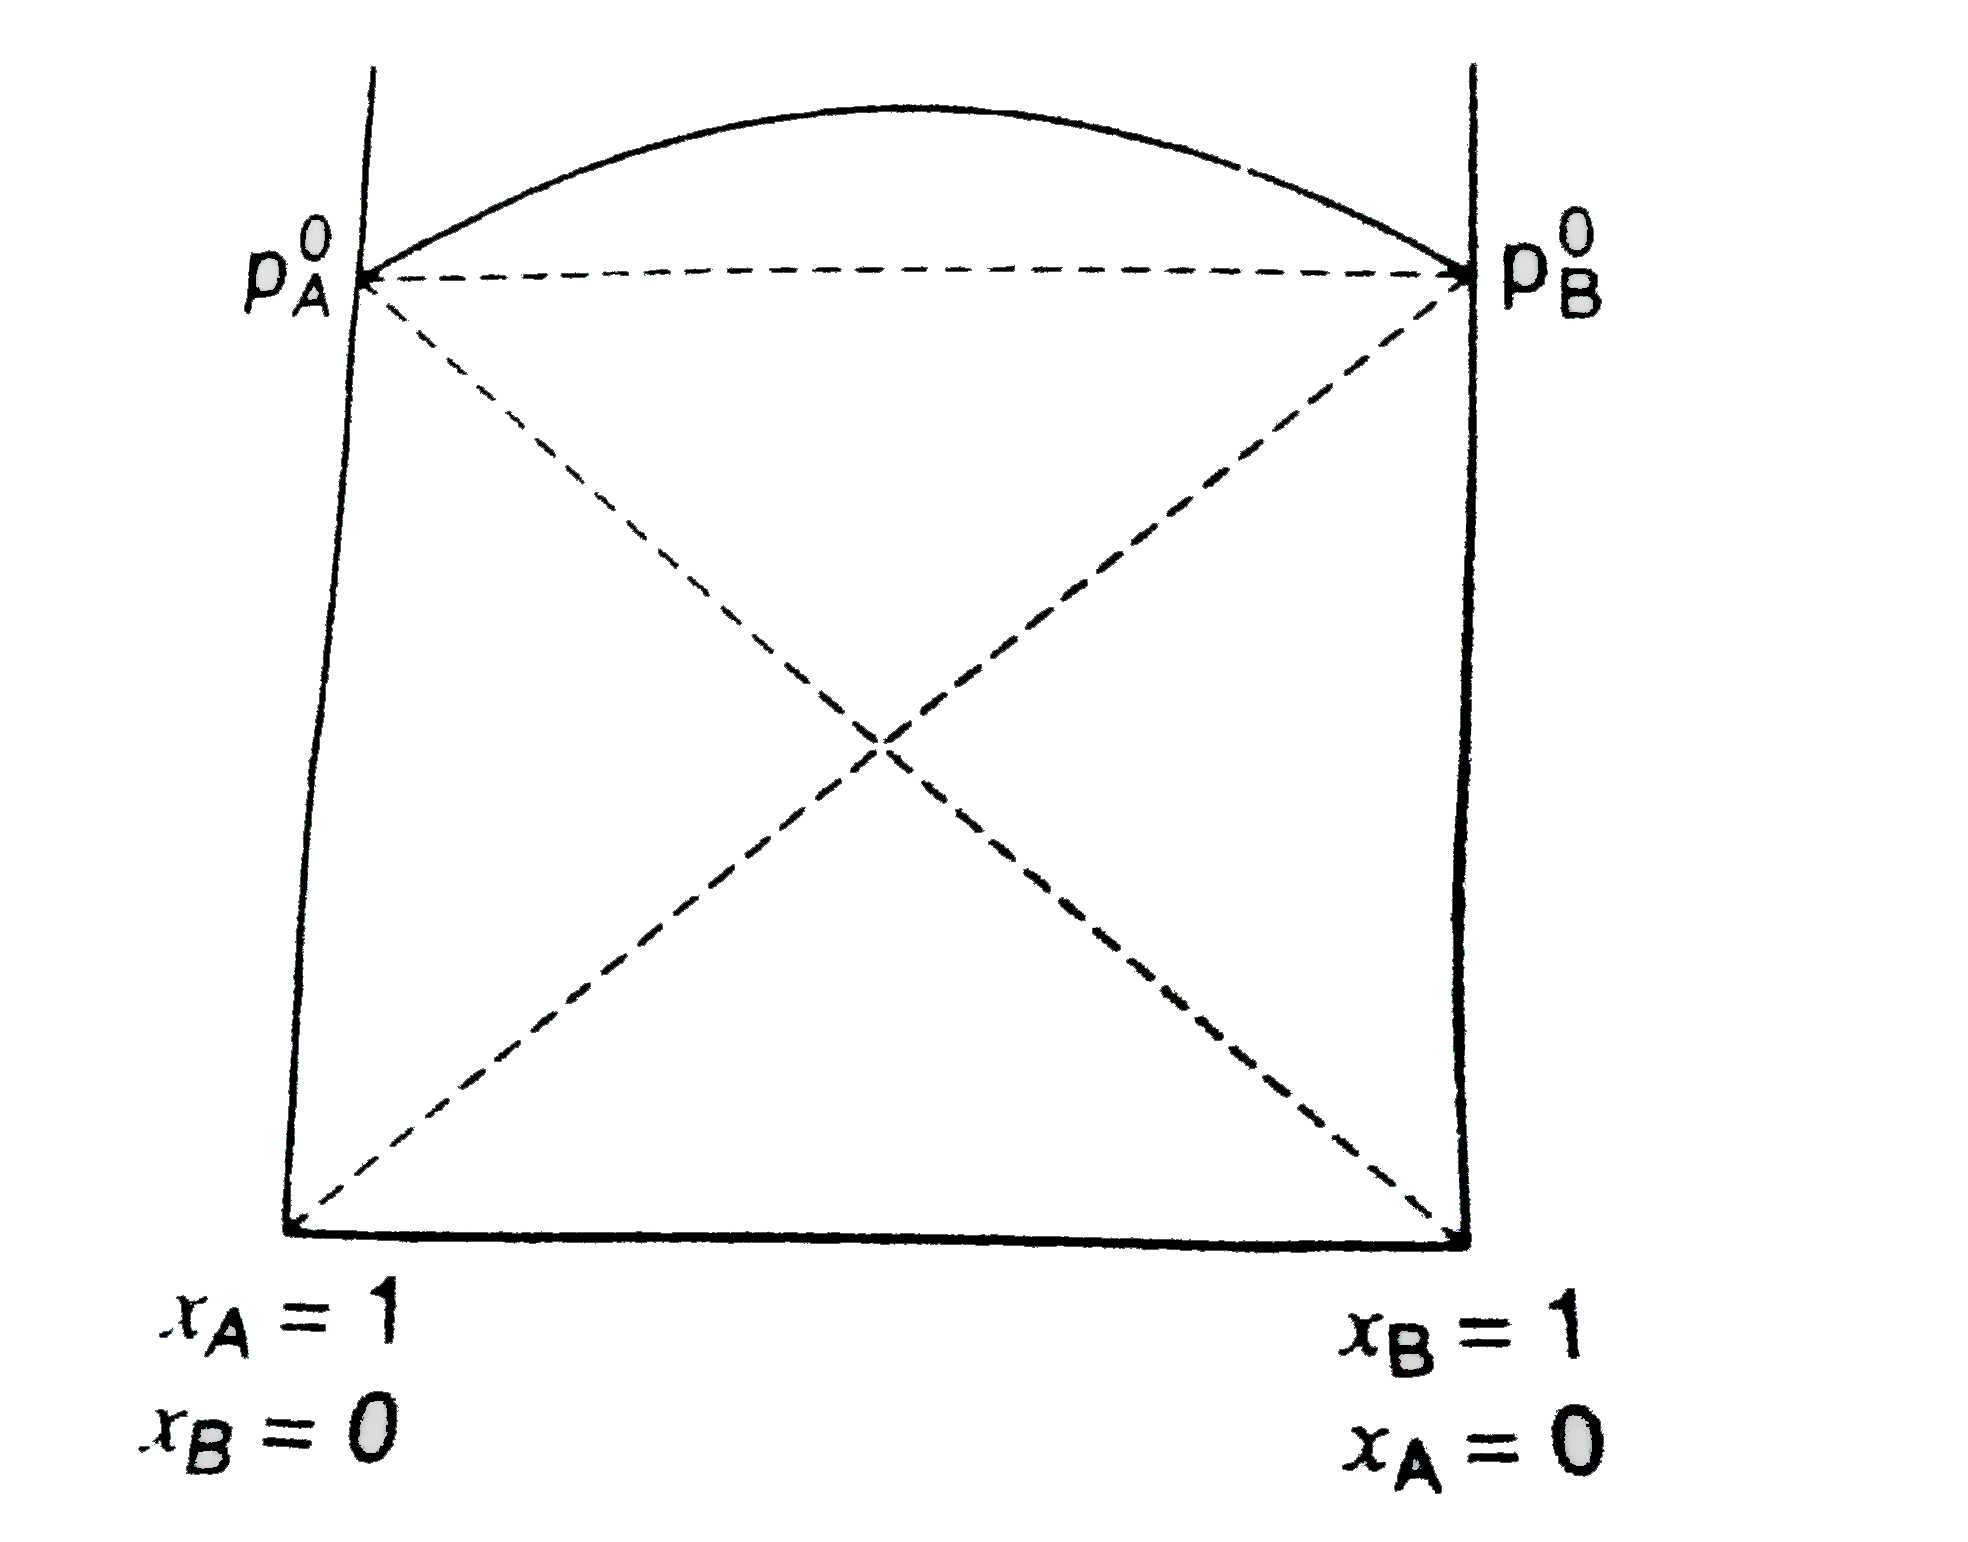
View SolutionThe given graph indicates :
View SolutionRS part of the graph indicates _________ state of substance
View Solutionthe graph given in Fig.9.36 shows the effect of substrate concentration on the rate of reaction of the enzyme green-gram -phosphatase . What does the graph indicates ?
View Solution
