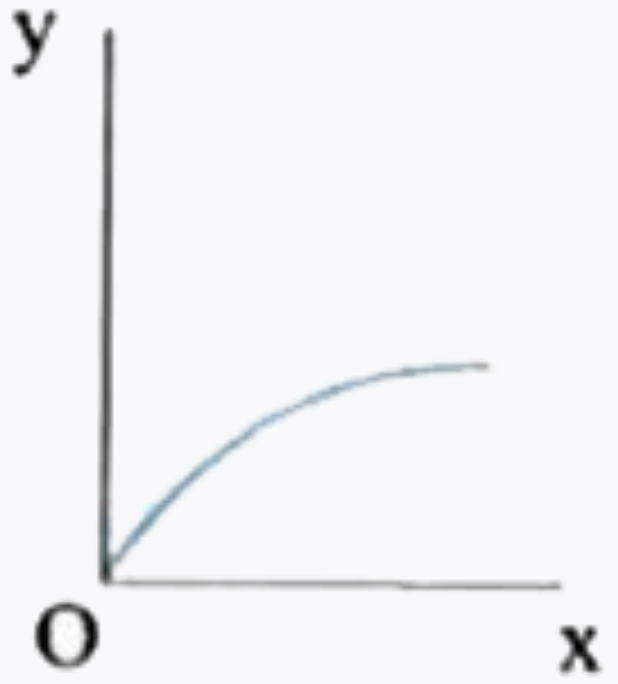
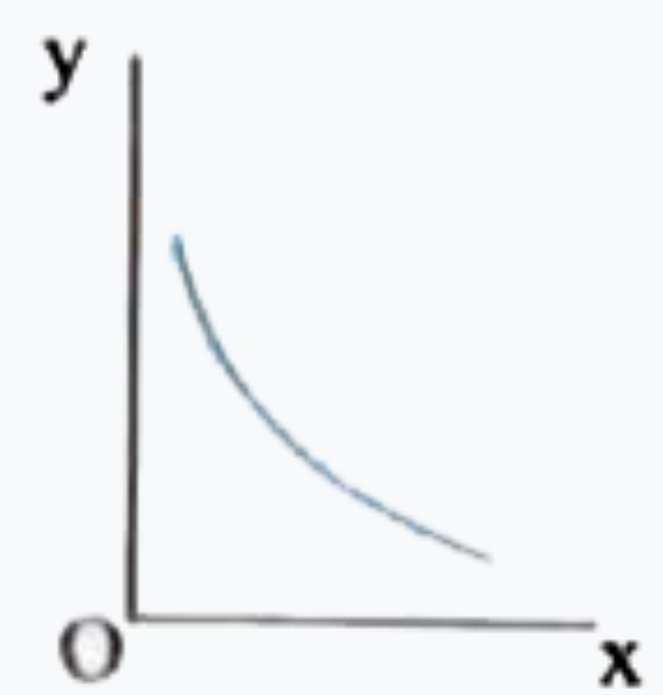
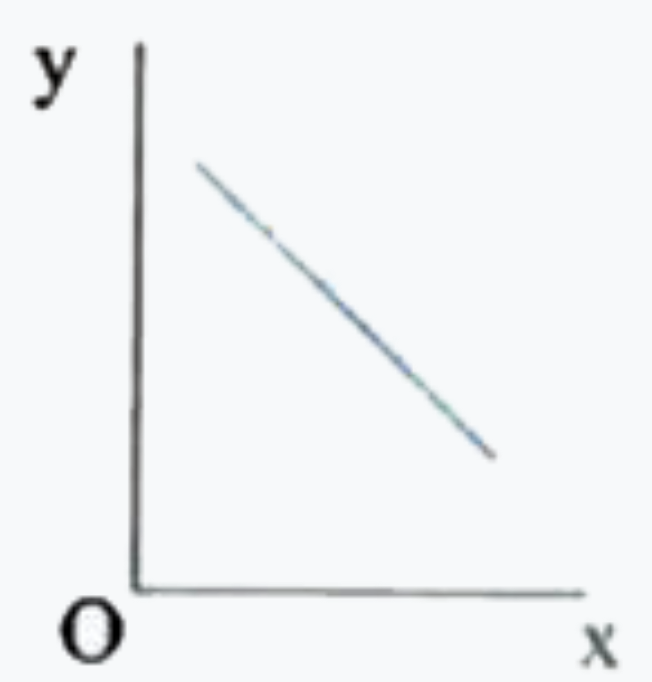
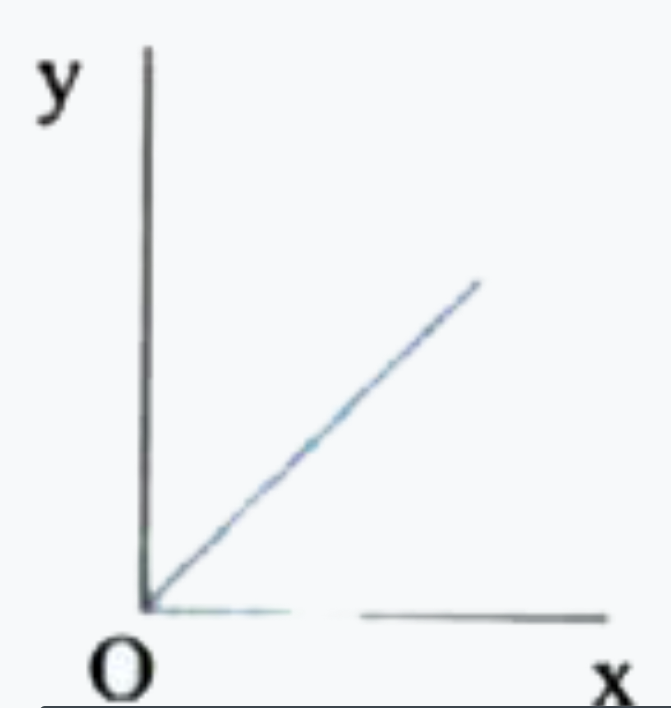
Which of the curve shows, how oxygen is loaded and unloaded due to partial pressure?
O2 curve
CO2 Curve
Bohr's curve
O2 Dissociation curve
The correct Answer is:C
Step by step video, text & image solution for Which of the curve shows, how oxygen is loaded and unloaded due to partial pressure? by Biology experts to help you in doubts & scoring excellent marks in Class 12 exams.
Updated on:21/07/2023Topper's Solved these Questions
Similar Questions
Knowledge Check
Which of these curves represents Henry's law graph between partial pressure on y - axis mole fraction of gas on x - axis
A B
B C
C D
D
A vessel is filled with a mixture of equal masses of oxygen and nitrogen. What is the ratio of partial pressure of oxygen and nitrogen ?
Ap02=0.5pN2Bp02=0.875pN2Cp02=pN2Dp02=1.14pN2A vessel is filled with a mixture of oxygen and nitrogen. At what ratio of partial pressures will the mass of gases be identical?
AP(O2)=0.785P(N2)BP(O2)=8.75P(N2)CP(O2)=11.4P(N2)DP(O2)=0.875P(N2)
Henry's law constant of oxygen is 1.4×10⁻³ mol lit−1atm−1 at 298 K. How much of oxygen is dissolved in 100 mL at 298 K when the partial pressure of oxygen is 0.5 atm?
View SolutionTo which of the following gaseous mixture, the Dalton's law of partial pressures will not apply ?
View SolutionWhich of the following gaseous mixture does not follow Dalton's law of partial pressure?
View SolutionWhich of the following gas mixture is not applicable for Dalton’s law of partial pressure ?
View SolutionEqual weights of methane and oxygen are mixed in a vessel. The partial pressure of oxygen is
View Solution
