The Given figure shows three velocity-substrate concentration curves of an enzyme reaction. What do the curves X Y and Z depict respectively ?
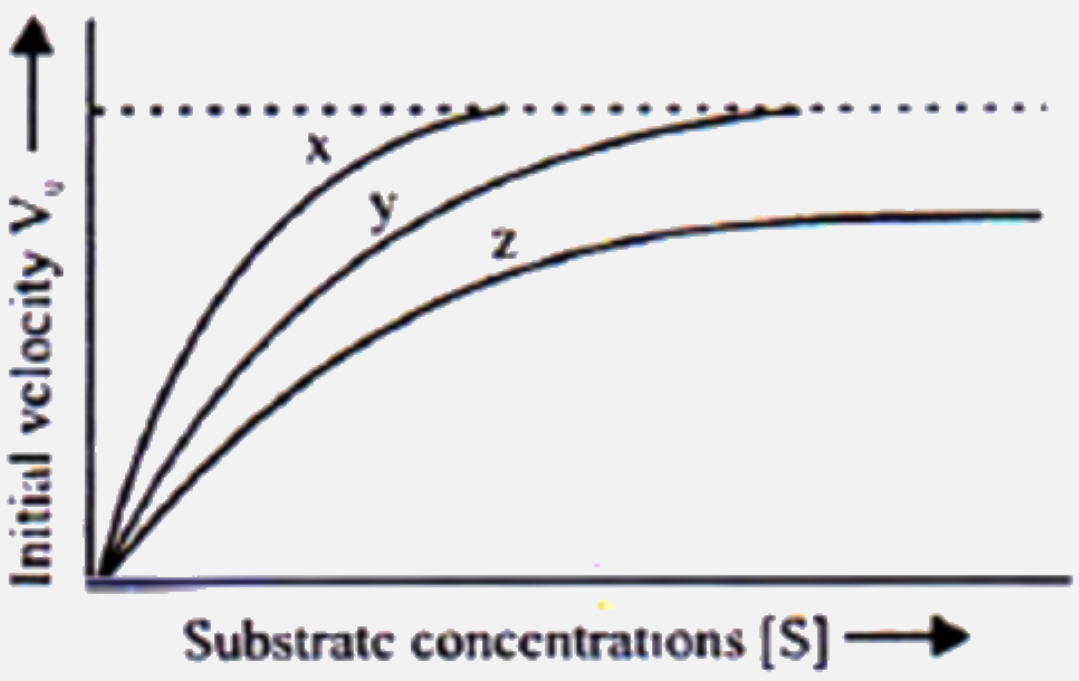
x - Normal enzyme reaction, y - competitive inhibition ,z - Non-competitive inhibition
x - Enzyme with an allosteric modulator added , y - Normal enzyme ,Z- Competitive inhibition
x - Enzyme with an allosteric stimulator , y- Competitive inhibition added , z- Normal enzyme reaction
x - Normal enzyme reaction , y - Non-competitive inhibitior added , z - Allosteric inhibition added
The correct Answer is:A
Step by step video & image solution for The Given figure shows three velocity-substrate concentration curves of an enzyme reaction. What do the curves X Y and Z depict respectively ? by Biology experts to help you in doubts & scoring excellent marks in Class 12 exams.
Updated on:21/07/2023Topper's Solved these Questions
Similar Questions
Knowledge Check
The given figure shows three velocity-substrate concentration curves for an enzyme reaction. What do the curves x, y and z depict respectively?
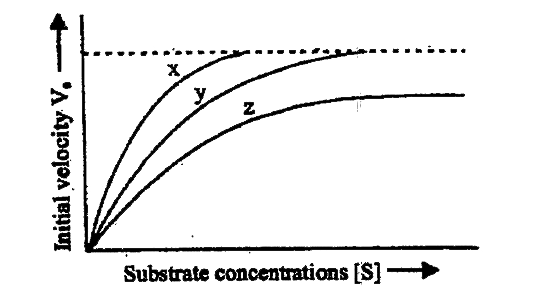 Ax-normal enzyme reaction, y-competitive inhibition, z-non-competitive inhibitionBx-enzyme with an allosteric modulator added, y-normal enzyme activity, 2-competitive inhibitionCX-enzyme with an allosteric stimulator, y-competitive inhibition added z-normal enzyme reactionDx-normal enzyme reaction, y-non-competitive inhibitor added z-allosteric inhibitor added
Figure given below shows three velocity-substrate concentration curves for an enzyme reaxtion. What do the curves for an enzyme reaction. What do the curves depict
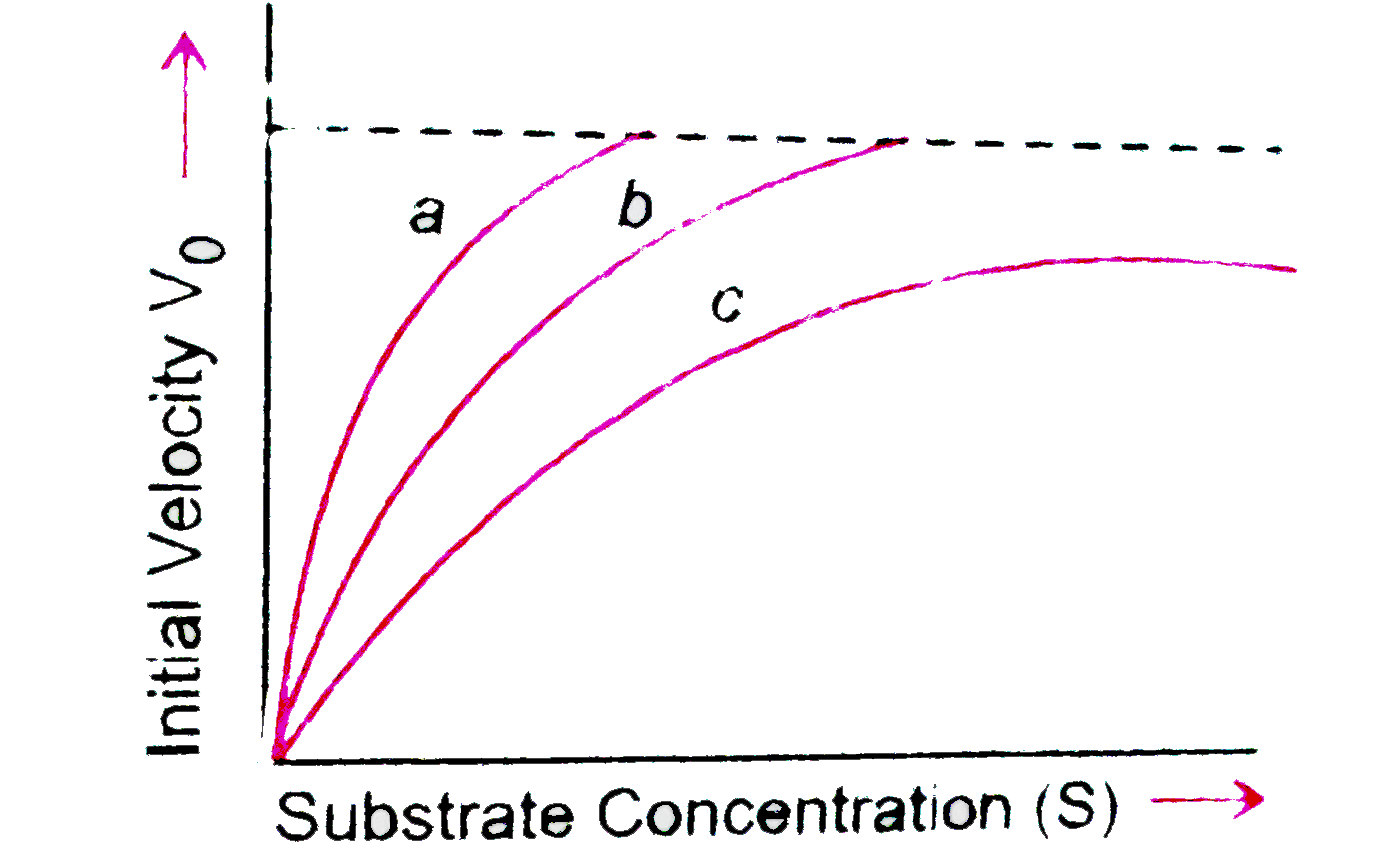 Aa-normal enzymes action, b-competitive inhibition,c-noncompetitive inhibitionBa-enzyme with an allosteric modulator added, b-normal enzyme activity, c-competitive inhibitionCa-enzyme with an allosteric stimulator,b-competitive inhibition added, c-normal enzyme reactionDa-normal enzyme reaction, b-non-competitive enhibition added c-allosteric inhibitor add.
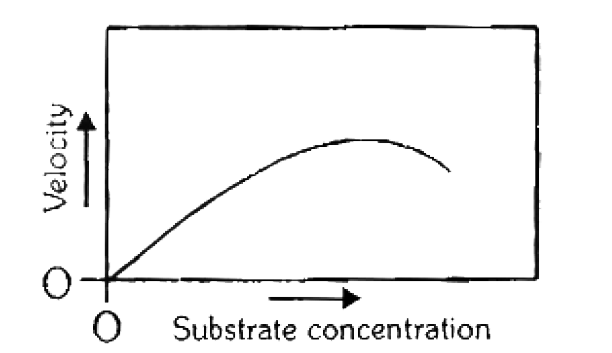
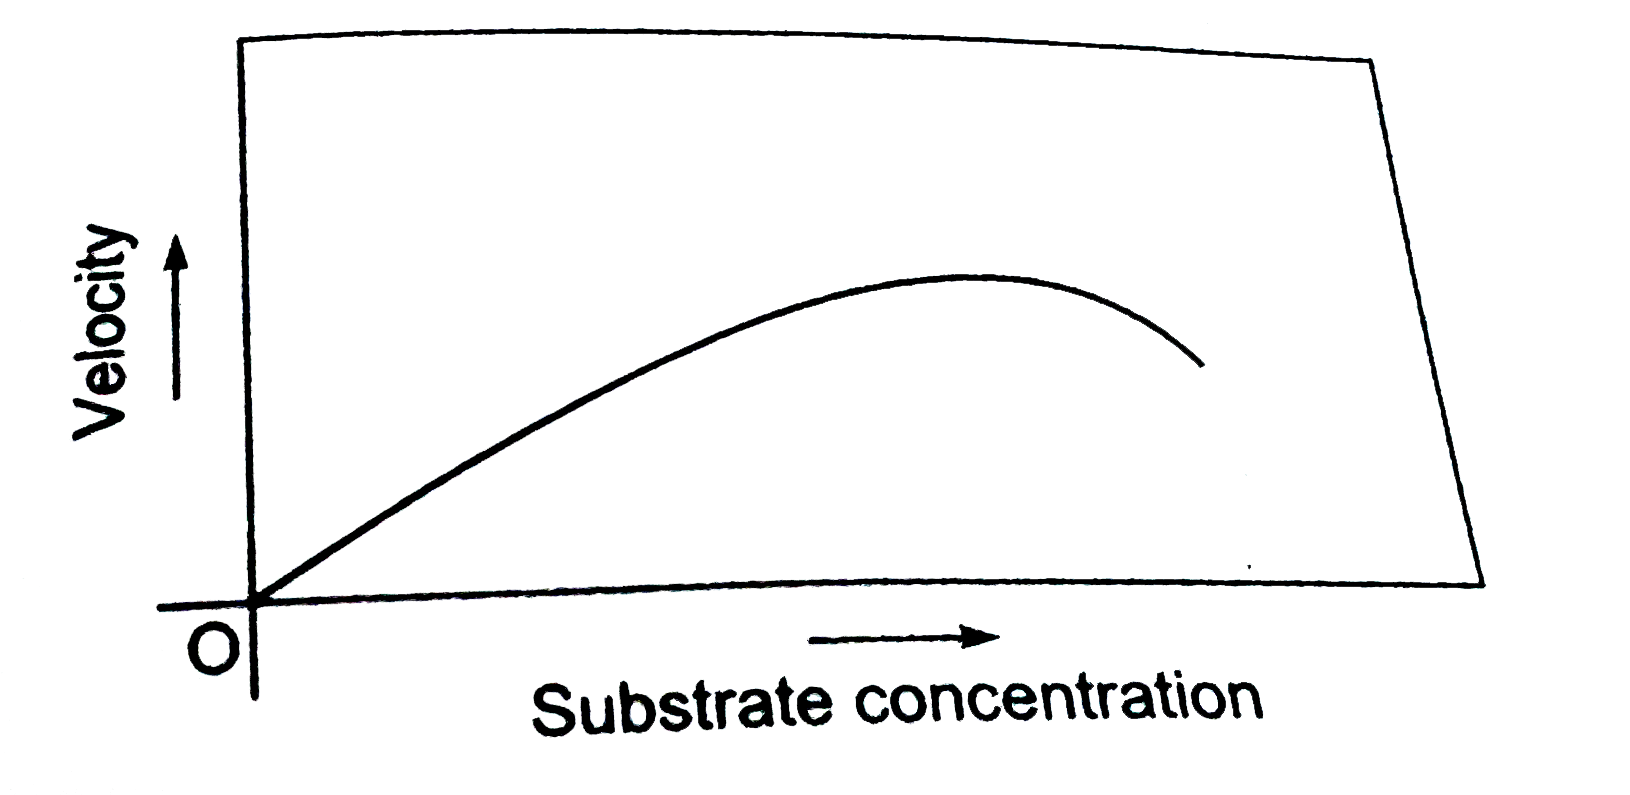
The given graph shows the effect of substrate concentration on the rate of reaction of the enzyme green-gram-phosphatase What does the graph indicate?
AThe rate of enzyme reaction is directly proportional to the substrate concentrationBPresence ofan enzyme inhibitor in the reaction mixtureCFormation of an enzyme-substrate complexDat higher substrate concentration the pH increases.
The given graph shows the effect of substrate concentration on the rate of reaction of the enzyme green gram-phosphatase

What dose the graph indicate
View SolutionThe given graph shows the effect of substrate concentration on the rate of reaction of the enzymes green gram-phosphatase. What does the graph indicate ?
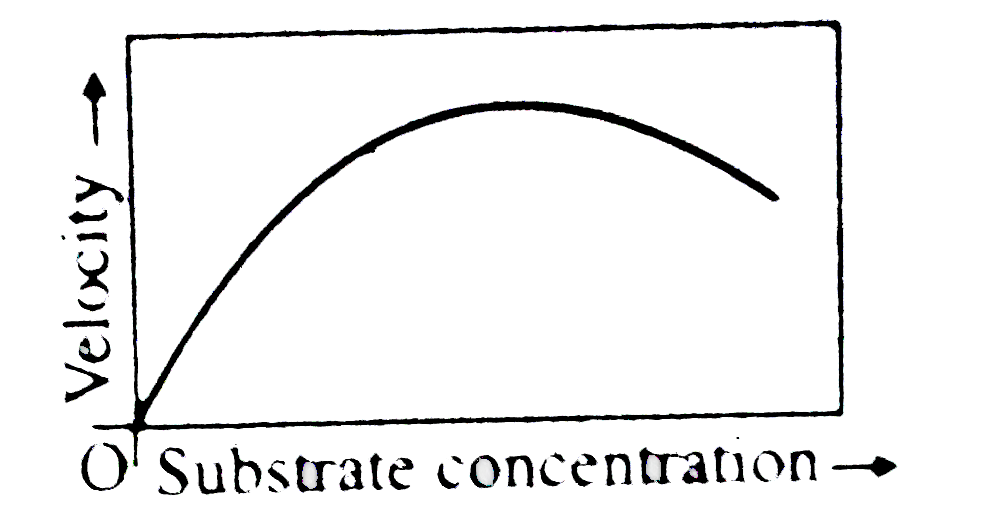
View Solutionthe graph given in Fig.9.36 shows the effect of substrate concentration on the rate of reaction of the enzyme green-gram -phosphatase . What does the graph indicates ?
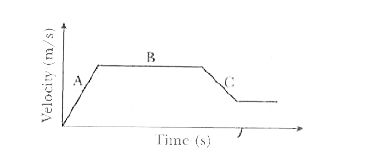
View SolutionThe given figure shows the velocity versus time curve for a car traveling along a straight line. Which of the following statements is false ?
View SolutionAssertion : With the increase in substrate concentration, the velocity of the enzymatic reaction rise at first. The reaction ultimately reaches a maximum velocity which is not exceeded by any further rise in concentration of the substrate.
Reason : The enzyme molecules are fewer than substrate molecules and after saturation of thes molecules, there are no free enzymes to bind with the additional substrate molecules.
View Solution

