The work functions of three metals A, B and C are WA,WBandWC respectively . They are in decreasing order. The correct graph between kinetic energy and frequency V of incident radiation is
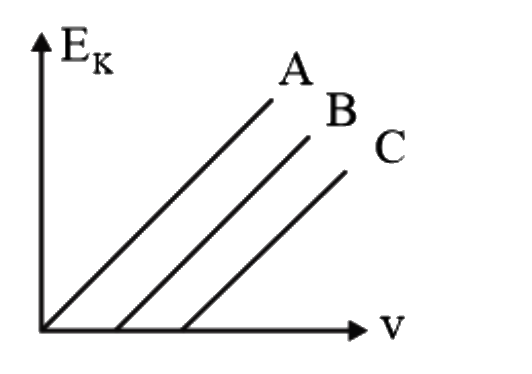
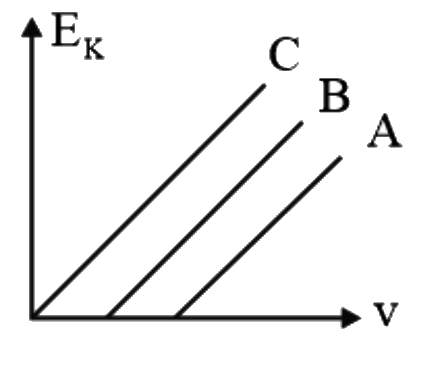
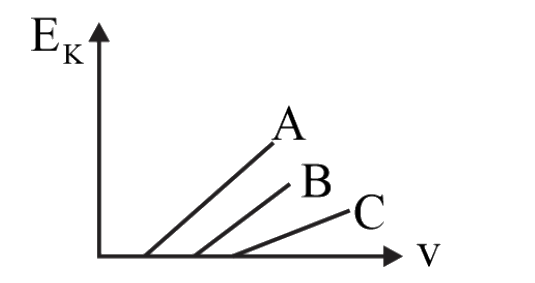
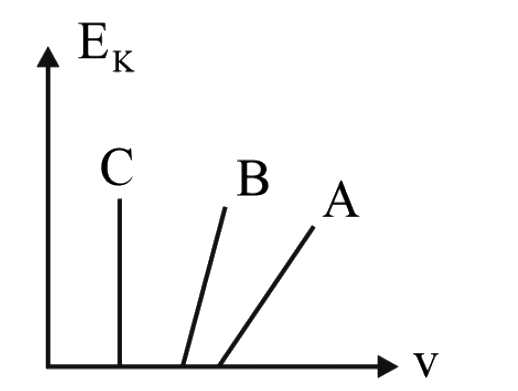
The correct Answer is:B
To solve the problem, we need to analyze the relationship between the kinetic energy (KE) of emitted electrons and the frequency (ν) of incident radiation based on the work functions of the metals A, B, and C.
1. Understanding Work Function:
- The work function (W) is the minimum energy required to remove an electron from the surface of a metal.
- Given that the work functions of metals A, B, and C are in decreasing order:
WA>WB>WC
2. Photoelectric Equation:
- The kinetic energy of the emitted electrons can be described by the photoelectric equation:
KE=hν−W
- Here, h is Planck's constant, ν is the frequency of the incident radiation, and W is the work function of the metal.
3. Graphing Kinetic Energy vs. Frequency:
- Rearranging the photoelectric equation gives:
KE=hν−W
- This equation is linear in the form y=mx+c, where:
- y is the kinetic energy (KE),
- m is the slope (which is h),
- x is the frequency (ν),
- c is the y-intercept (which is −W).
4. Identifying the Slopes and Intercepts:
- The slope h is constant for all three metals since it is a fundamental constant.
- The y-intercept will be −WA, −WB, and −WC for metals A, B, and C respectively.
- Since WA>WB>WC, the intercepts will be:
- Metal A: Most negative (lowest KE at low frequency),
- Metal B: Less negative,
- Metal C: Least negative (highest KE at low frequency).
5. Drawing the Graphs:
- All three lines will have the same slope but different y-intercepts:
- The line for metal A will start the lowest (most negative),
- The line for metal B will be above metal A,
- The line for metal C will be the highest (least negative).
- The graph will look like this:
- Line A (lowest) → Line B (middle) → Line C (highest).
6. Conclusion:
- The correct graph will show three straight lines with the same slope but different y-intercepts, where the line for metal A is the lowest, followed by metal B, and then metal C at the top.
Final Answer:
The correct graph between kinetic energy and frequency of incident radiation is represented by three lines with the same slope but different y-intercepts, where the line for metal A is the lowest, followed by metal B, and then metal C.
- The work function (W) is the minimum energy required to remove an electron from the surface of a metal.
- Given that the work functions of metals A, B, and C are in decreasing order:
WA>WB>WC
- The kinetic energy of the emitted electrons can be described by the photoelectric equation:
KE=hν−W
- Here, h is Planck's constant, ν is the frequency of the incident radiation, and W is the work function of the metal.
- Rearranging the photoelectric equation gives:
KE=hν−W
- This equation is linear in the form y=mx+c, where:
- y is the kinetic energy (KE),
- m is the slope (which is h),
- x is the frequency (ν),
- c is the y-intercept (which is −W).
- The slope h is constant for all three metals since it is a fundamental constant.
- The y-intercept will be −WA, −WB, and −WC for metals A, B, and C respectively.
- Since WA>WB>WC, the intercepts will be:
- Metal A: Most negative (lowest KE at low frequency),
- Metal B: Less negative,
- Metal C: Least negative (highest KE at low frequency).
- All three lines will have the same slope but different y-intercepts:
- The line for metal A will start the lowest (most negative),
- The line for metal B will be above metal A,
- The line for metal C will be the highest (least negative).
- The graph will look like this:
- Line A (lowest) → Line B (middle) → Line C (highest).
- The correct graph will show three straight lines with the same slope but different y-intercepts, where the line for metal A is the lowest, followed by metal B, and then metal C at the top.
The correct graph between kinetic energy and frequency of incident radiation is represented by three lines with the same slope but different y-intercepts, where the line for metal A is the lowest, followed by metal B, and then metal C.
Topper's Solved these Questions
Similar Questions
According to Einstein's photoelectric equation, the graph between kinetic energy of photoelectrons ejected and the frequency of the incident radiation is :
View SolutionIn the system shown, the blocks A,B and C are of weight 4W, W and W respectively. The system set free. The tension in the string connecting the blocks B and C is
View Solution
Knowledge Check
According to Einstein's photoelectric equation, the graph between the kinetic energy of photoelectrons ejected and the frequency of incident radiation is
A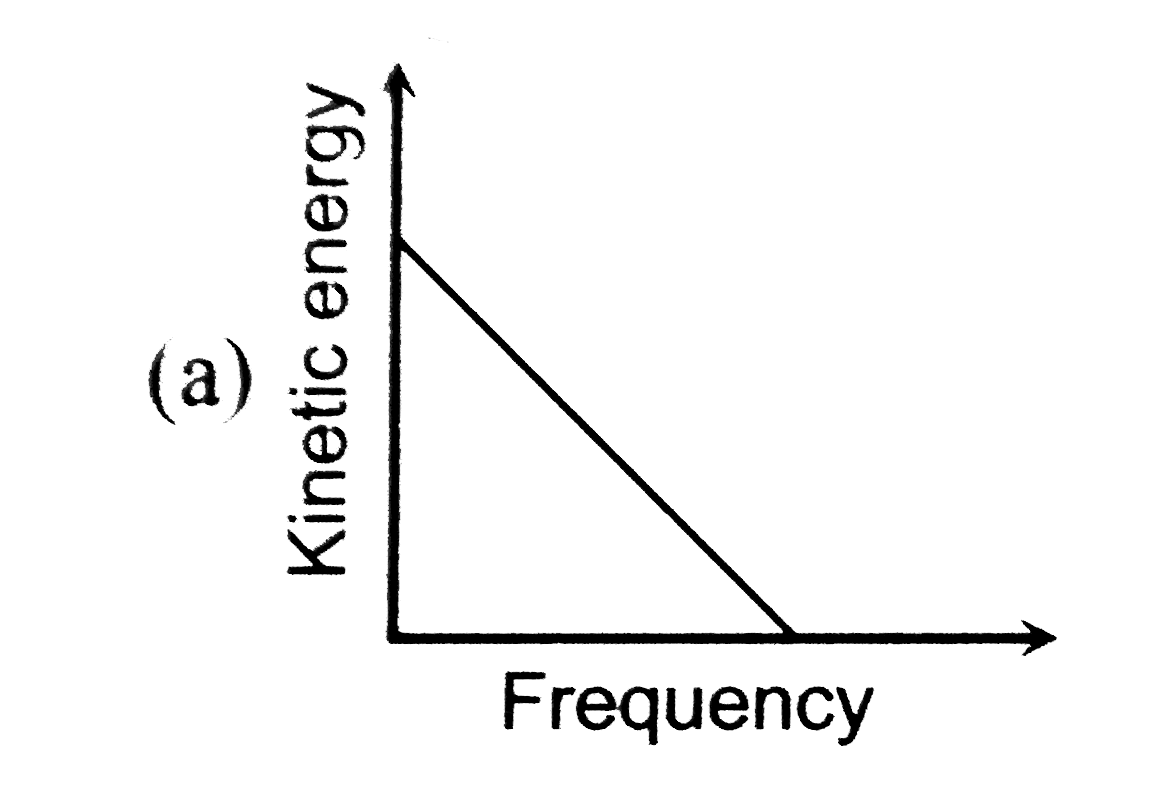 B
B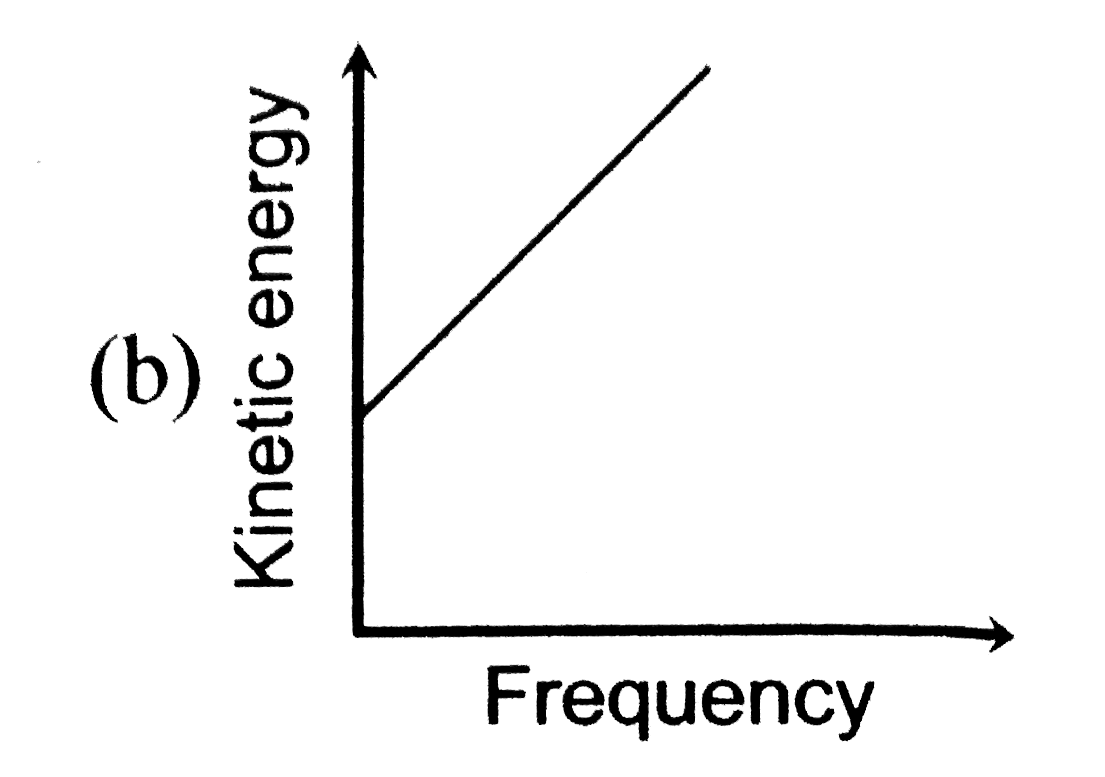 C
C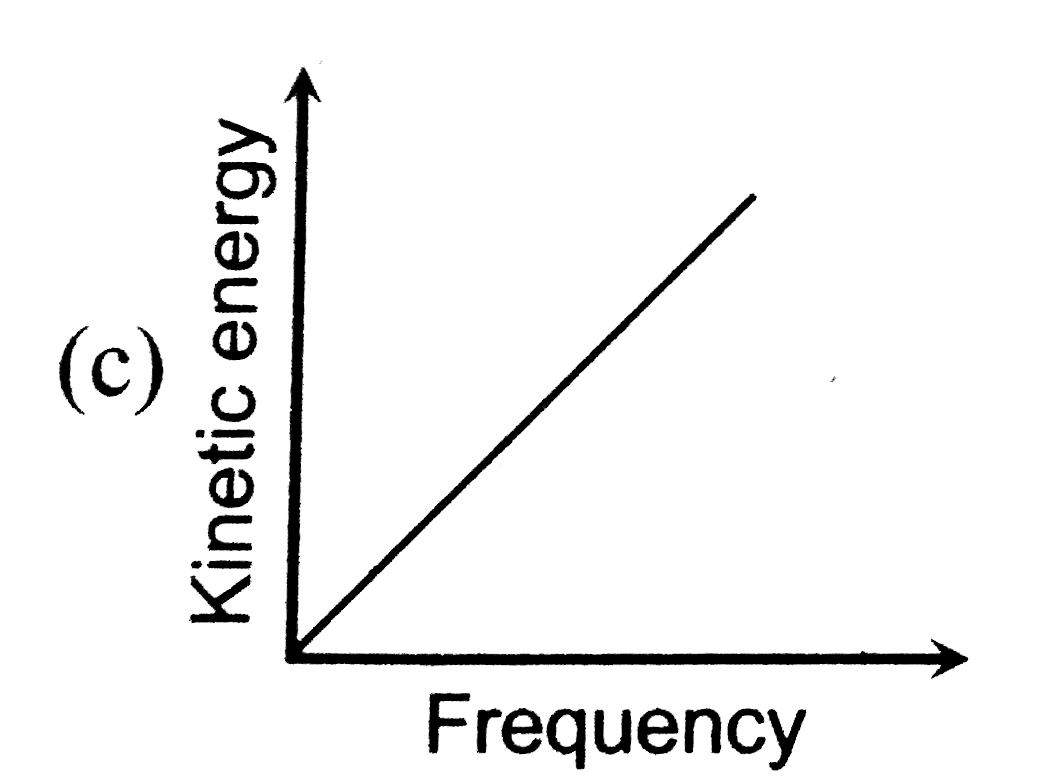 D
D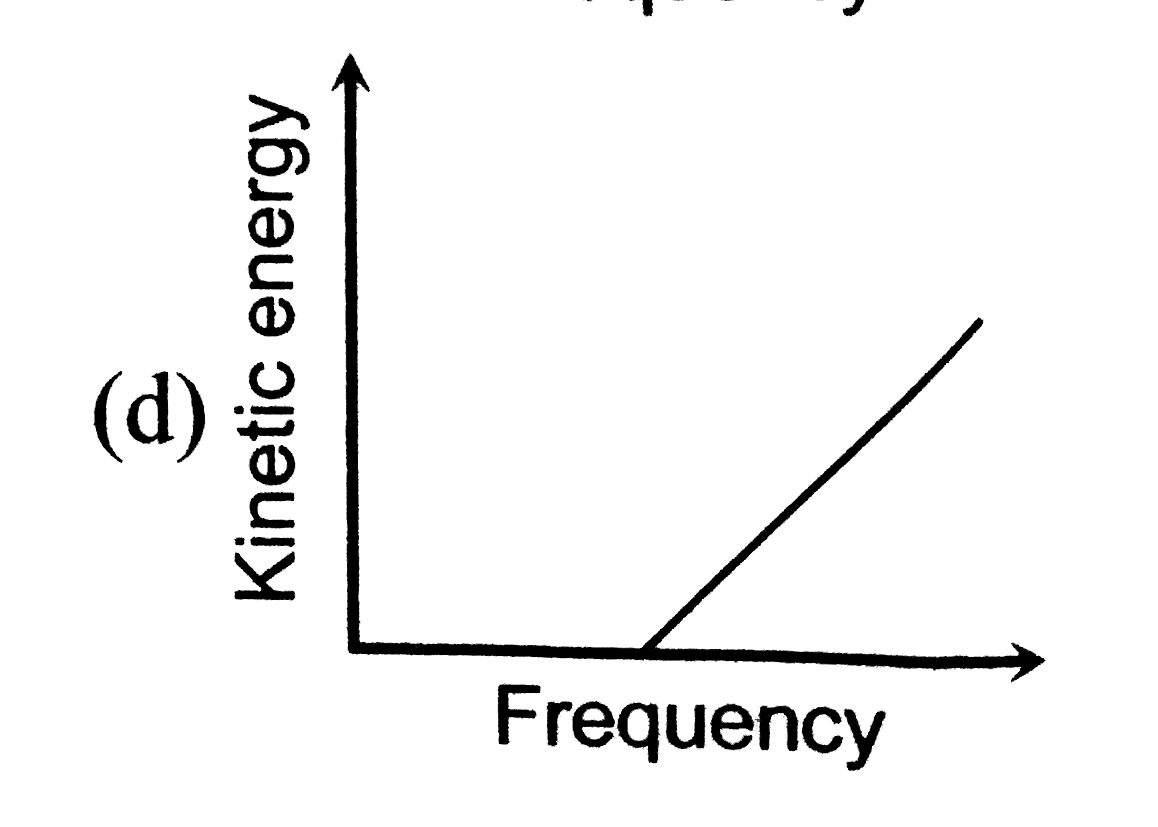
For three different metals A,B,C photoemission is observed one by one. The graph of maximum kinetic energy versus frequency f incident radiation are sketched as:
A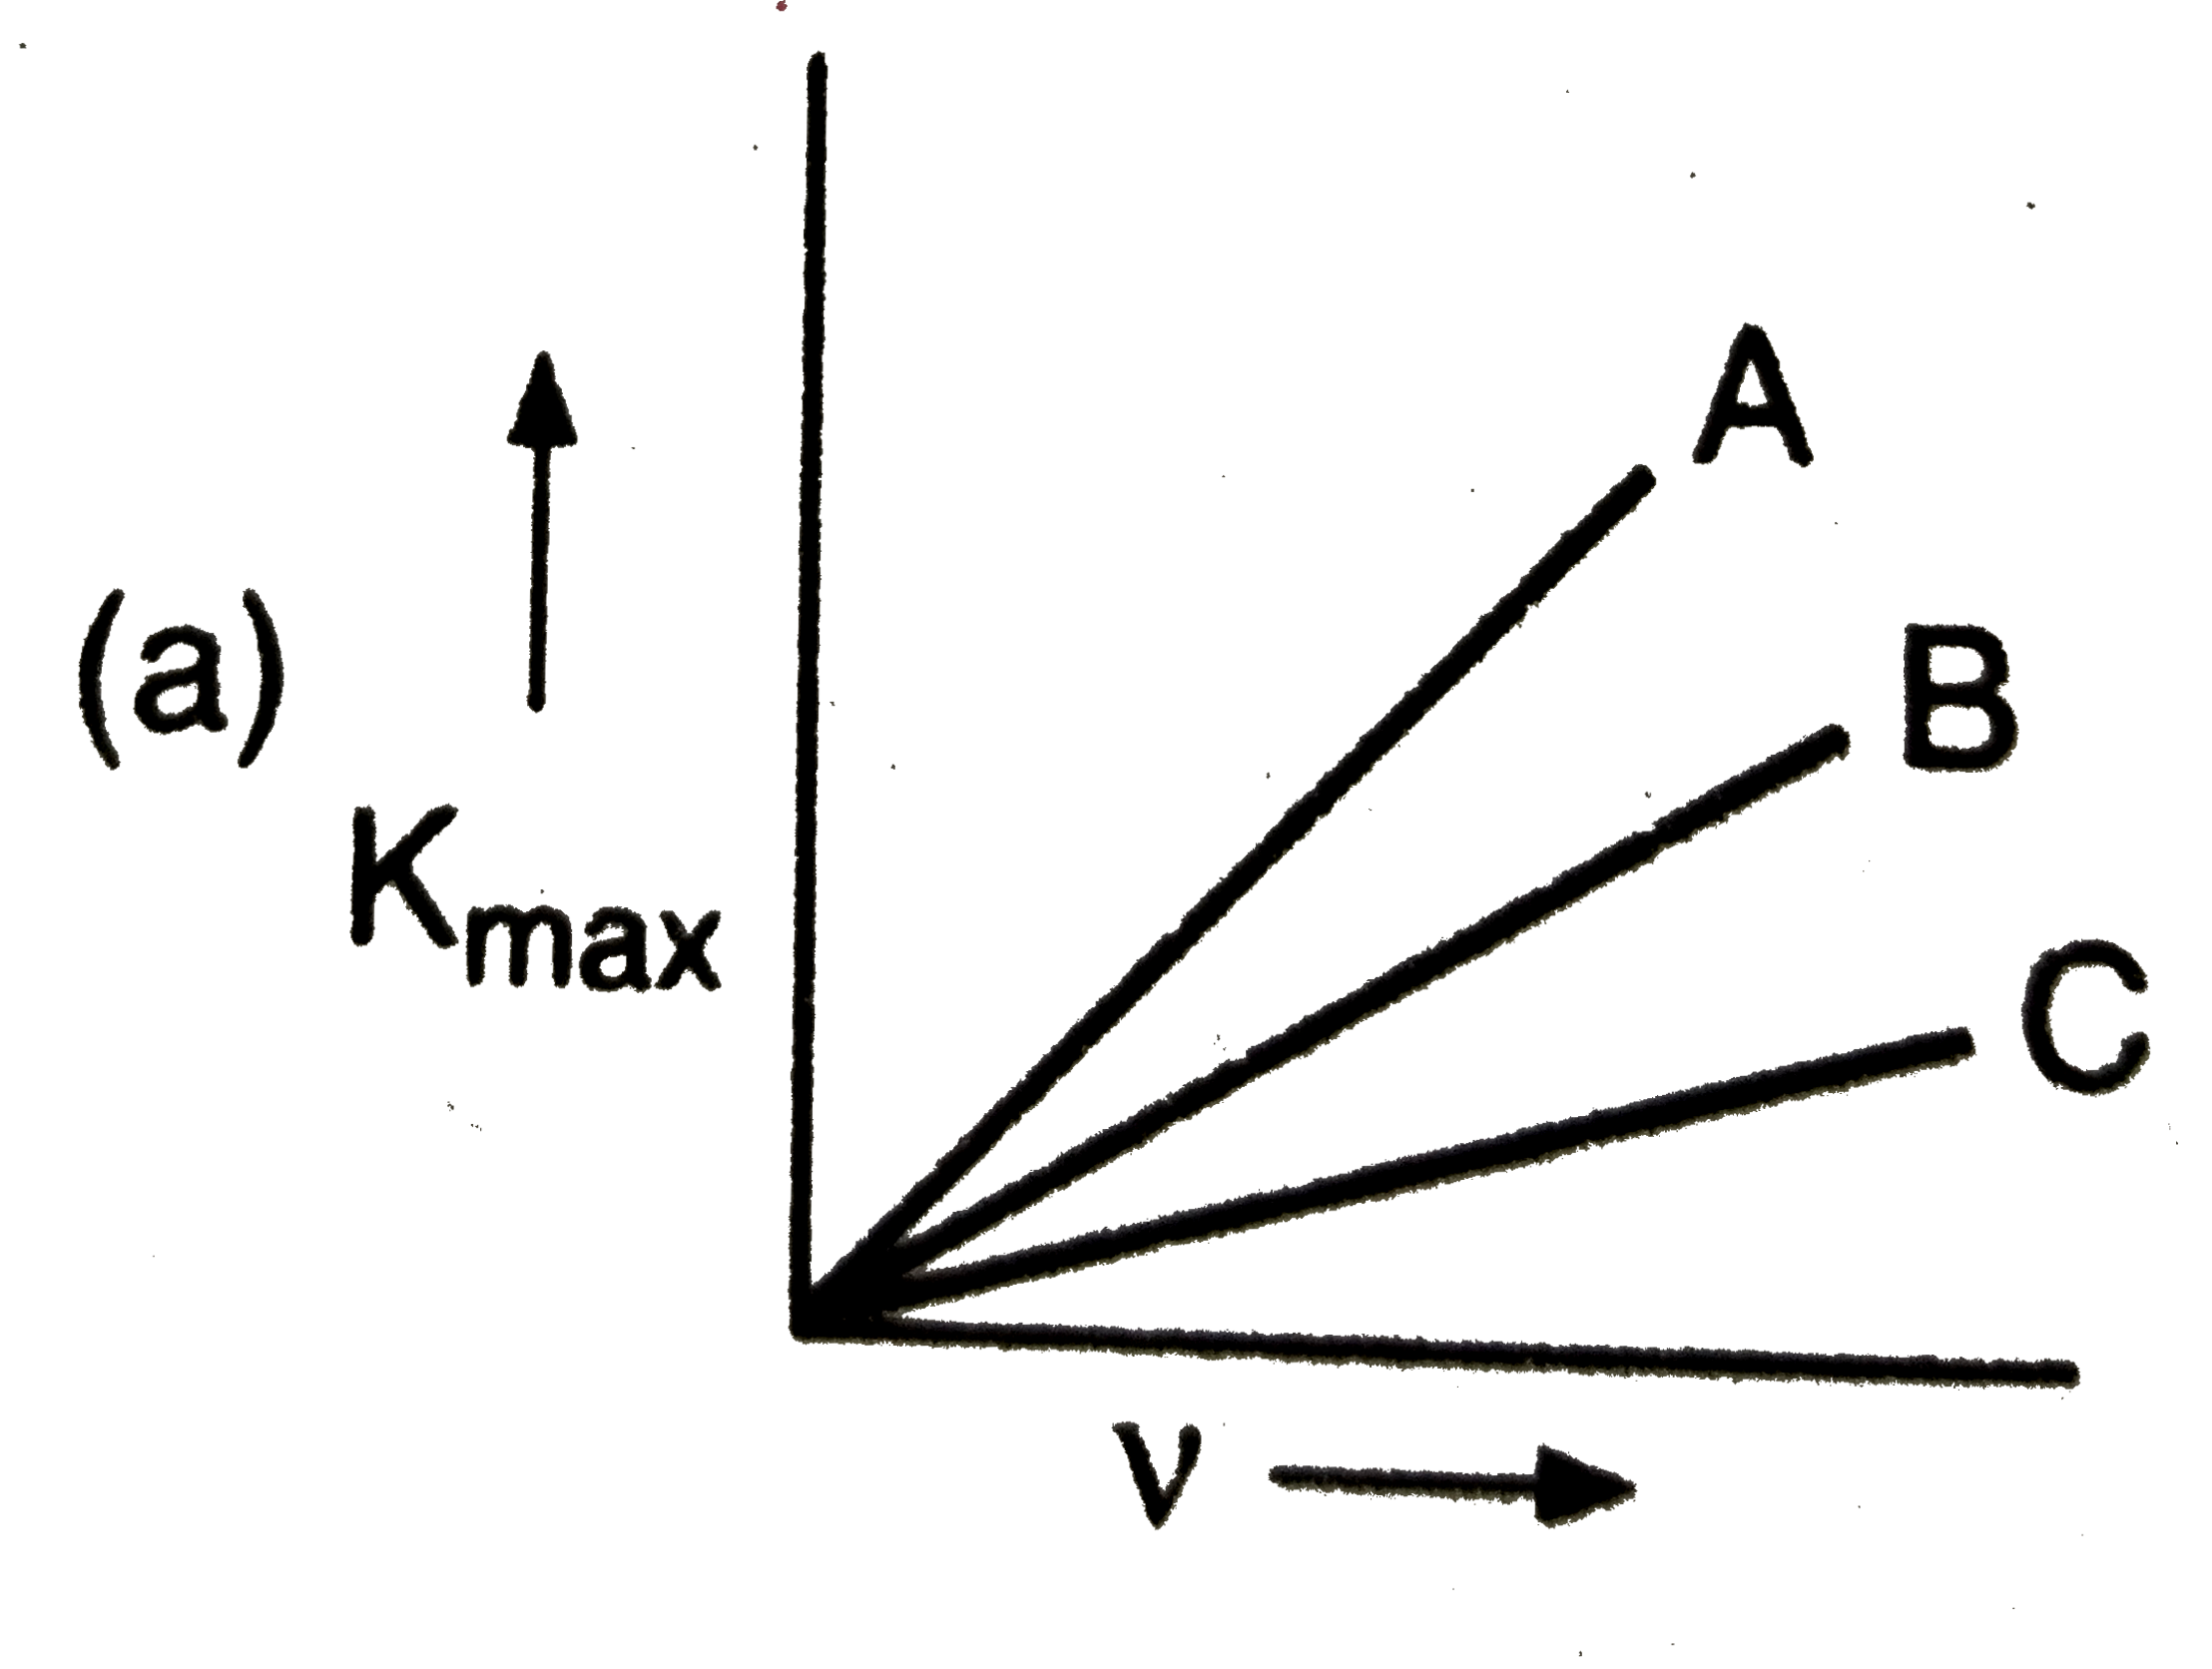 B
B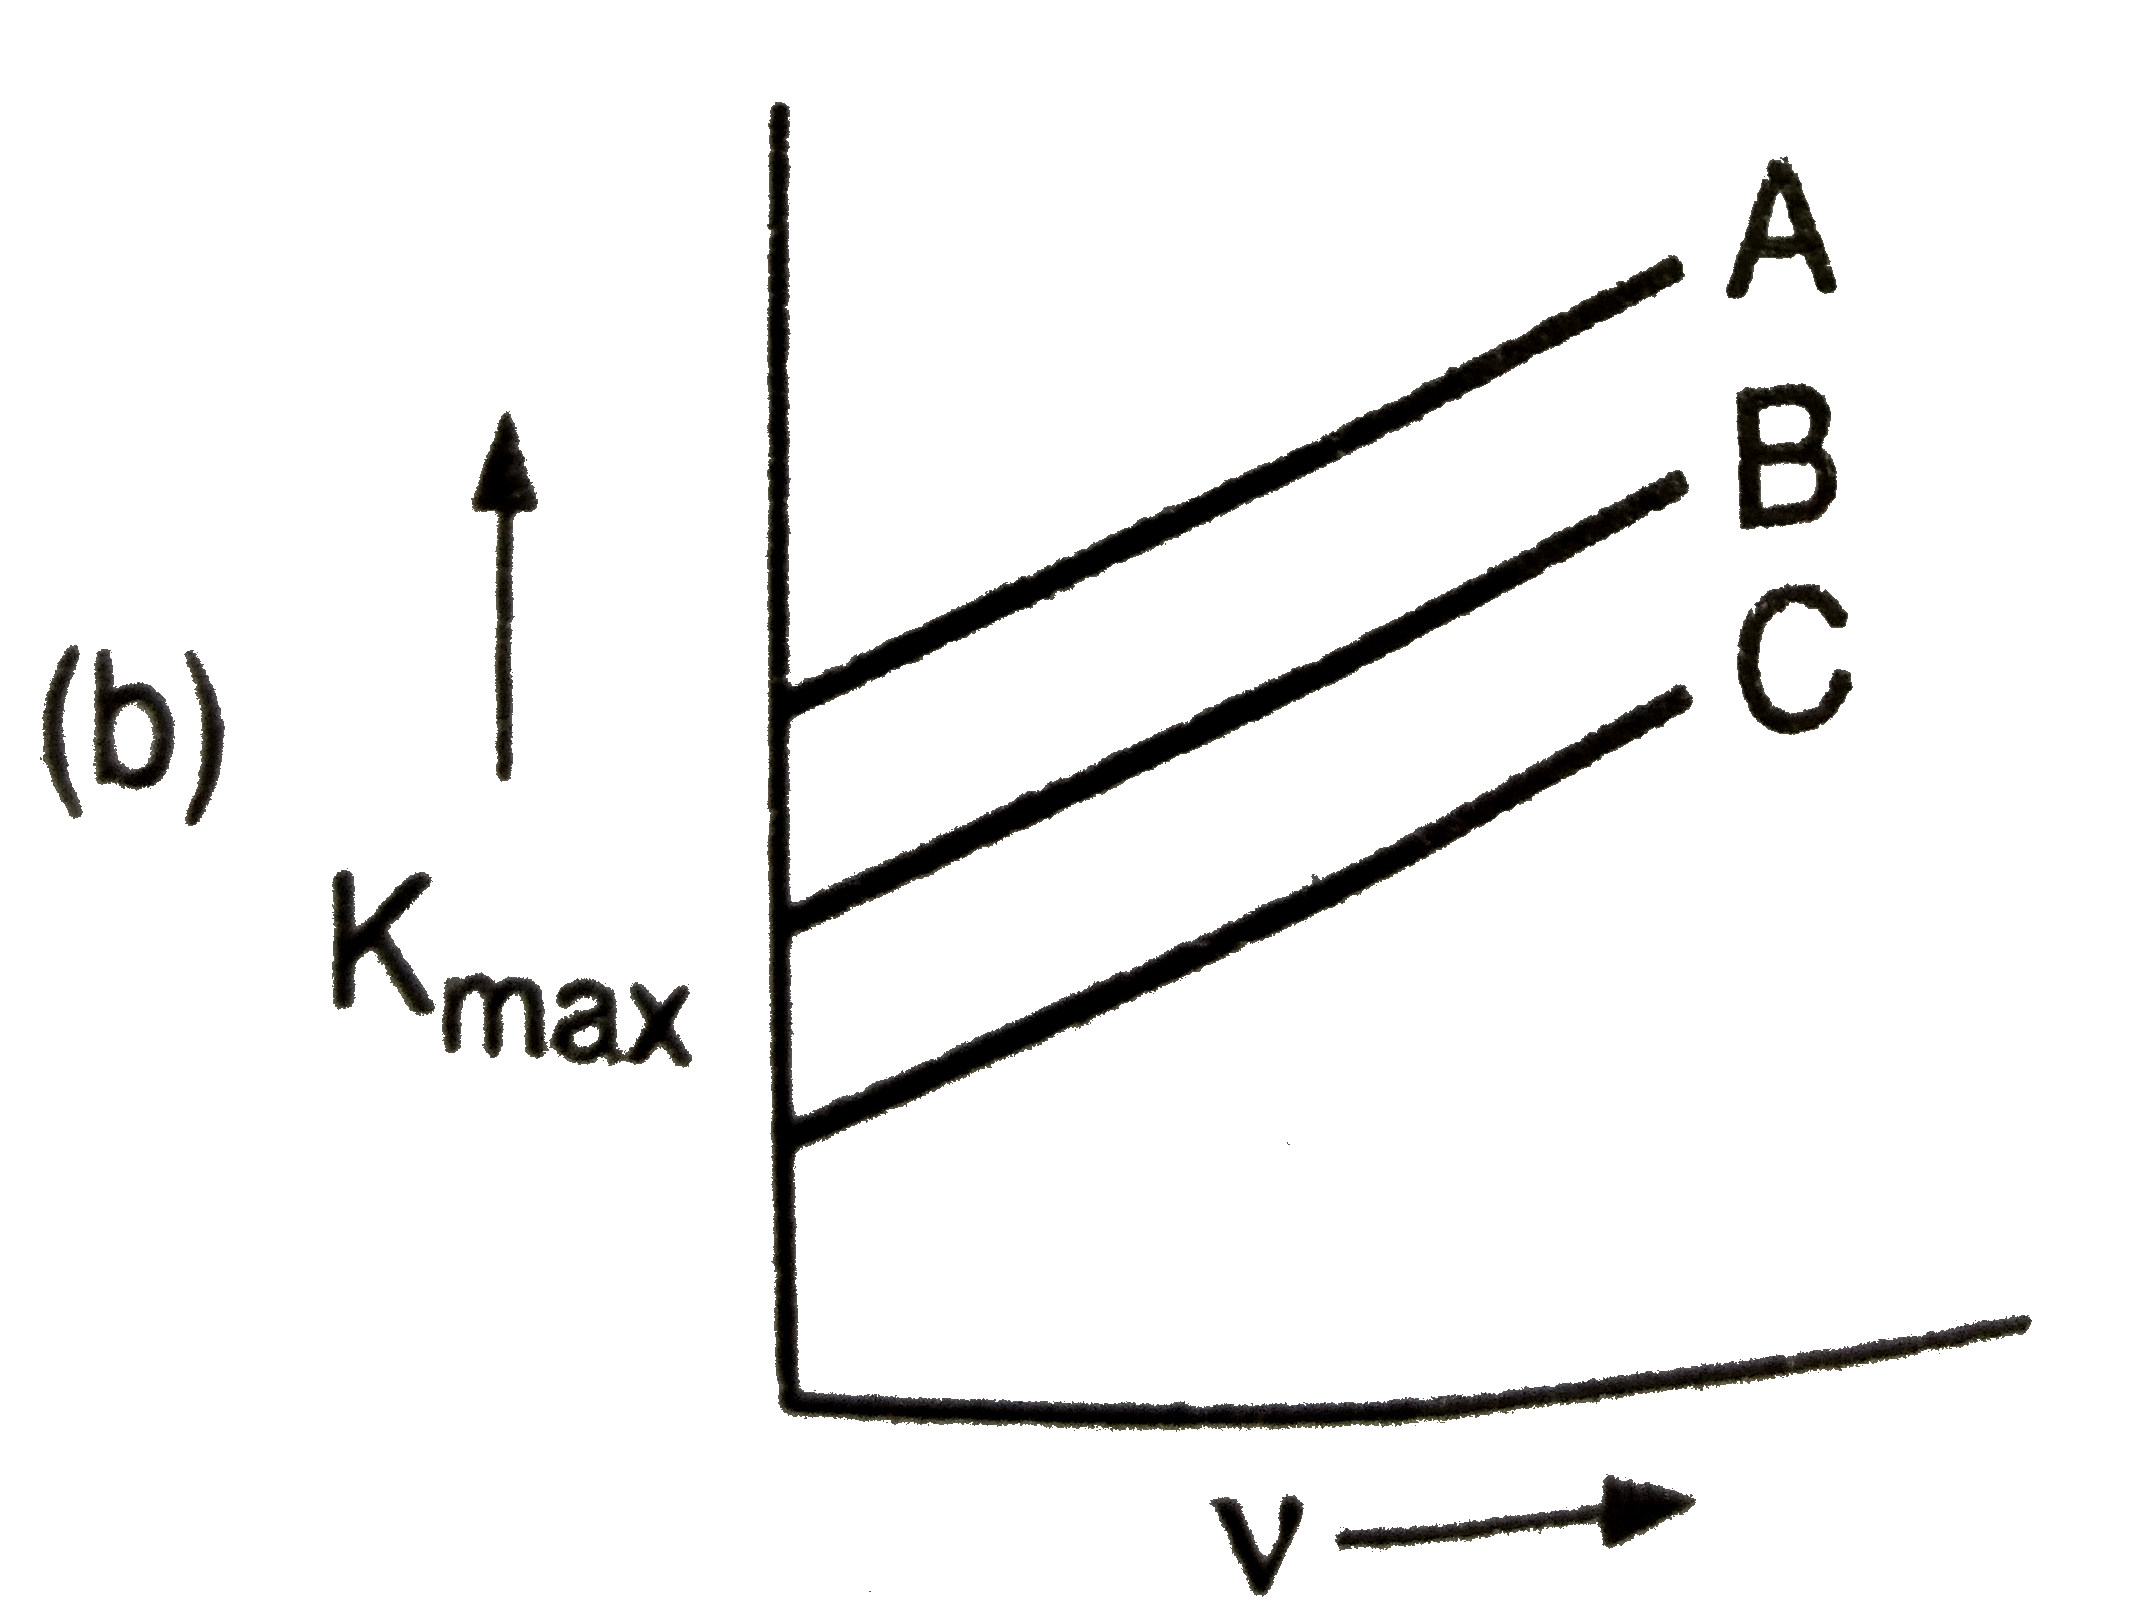 C
C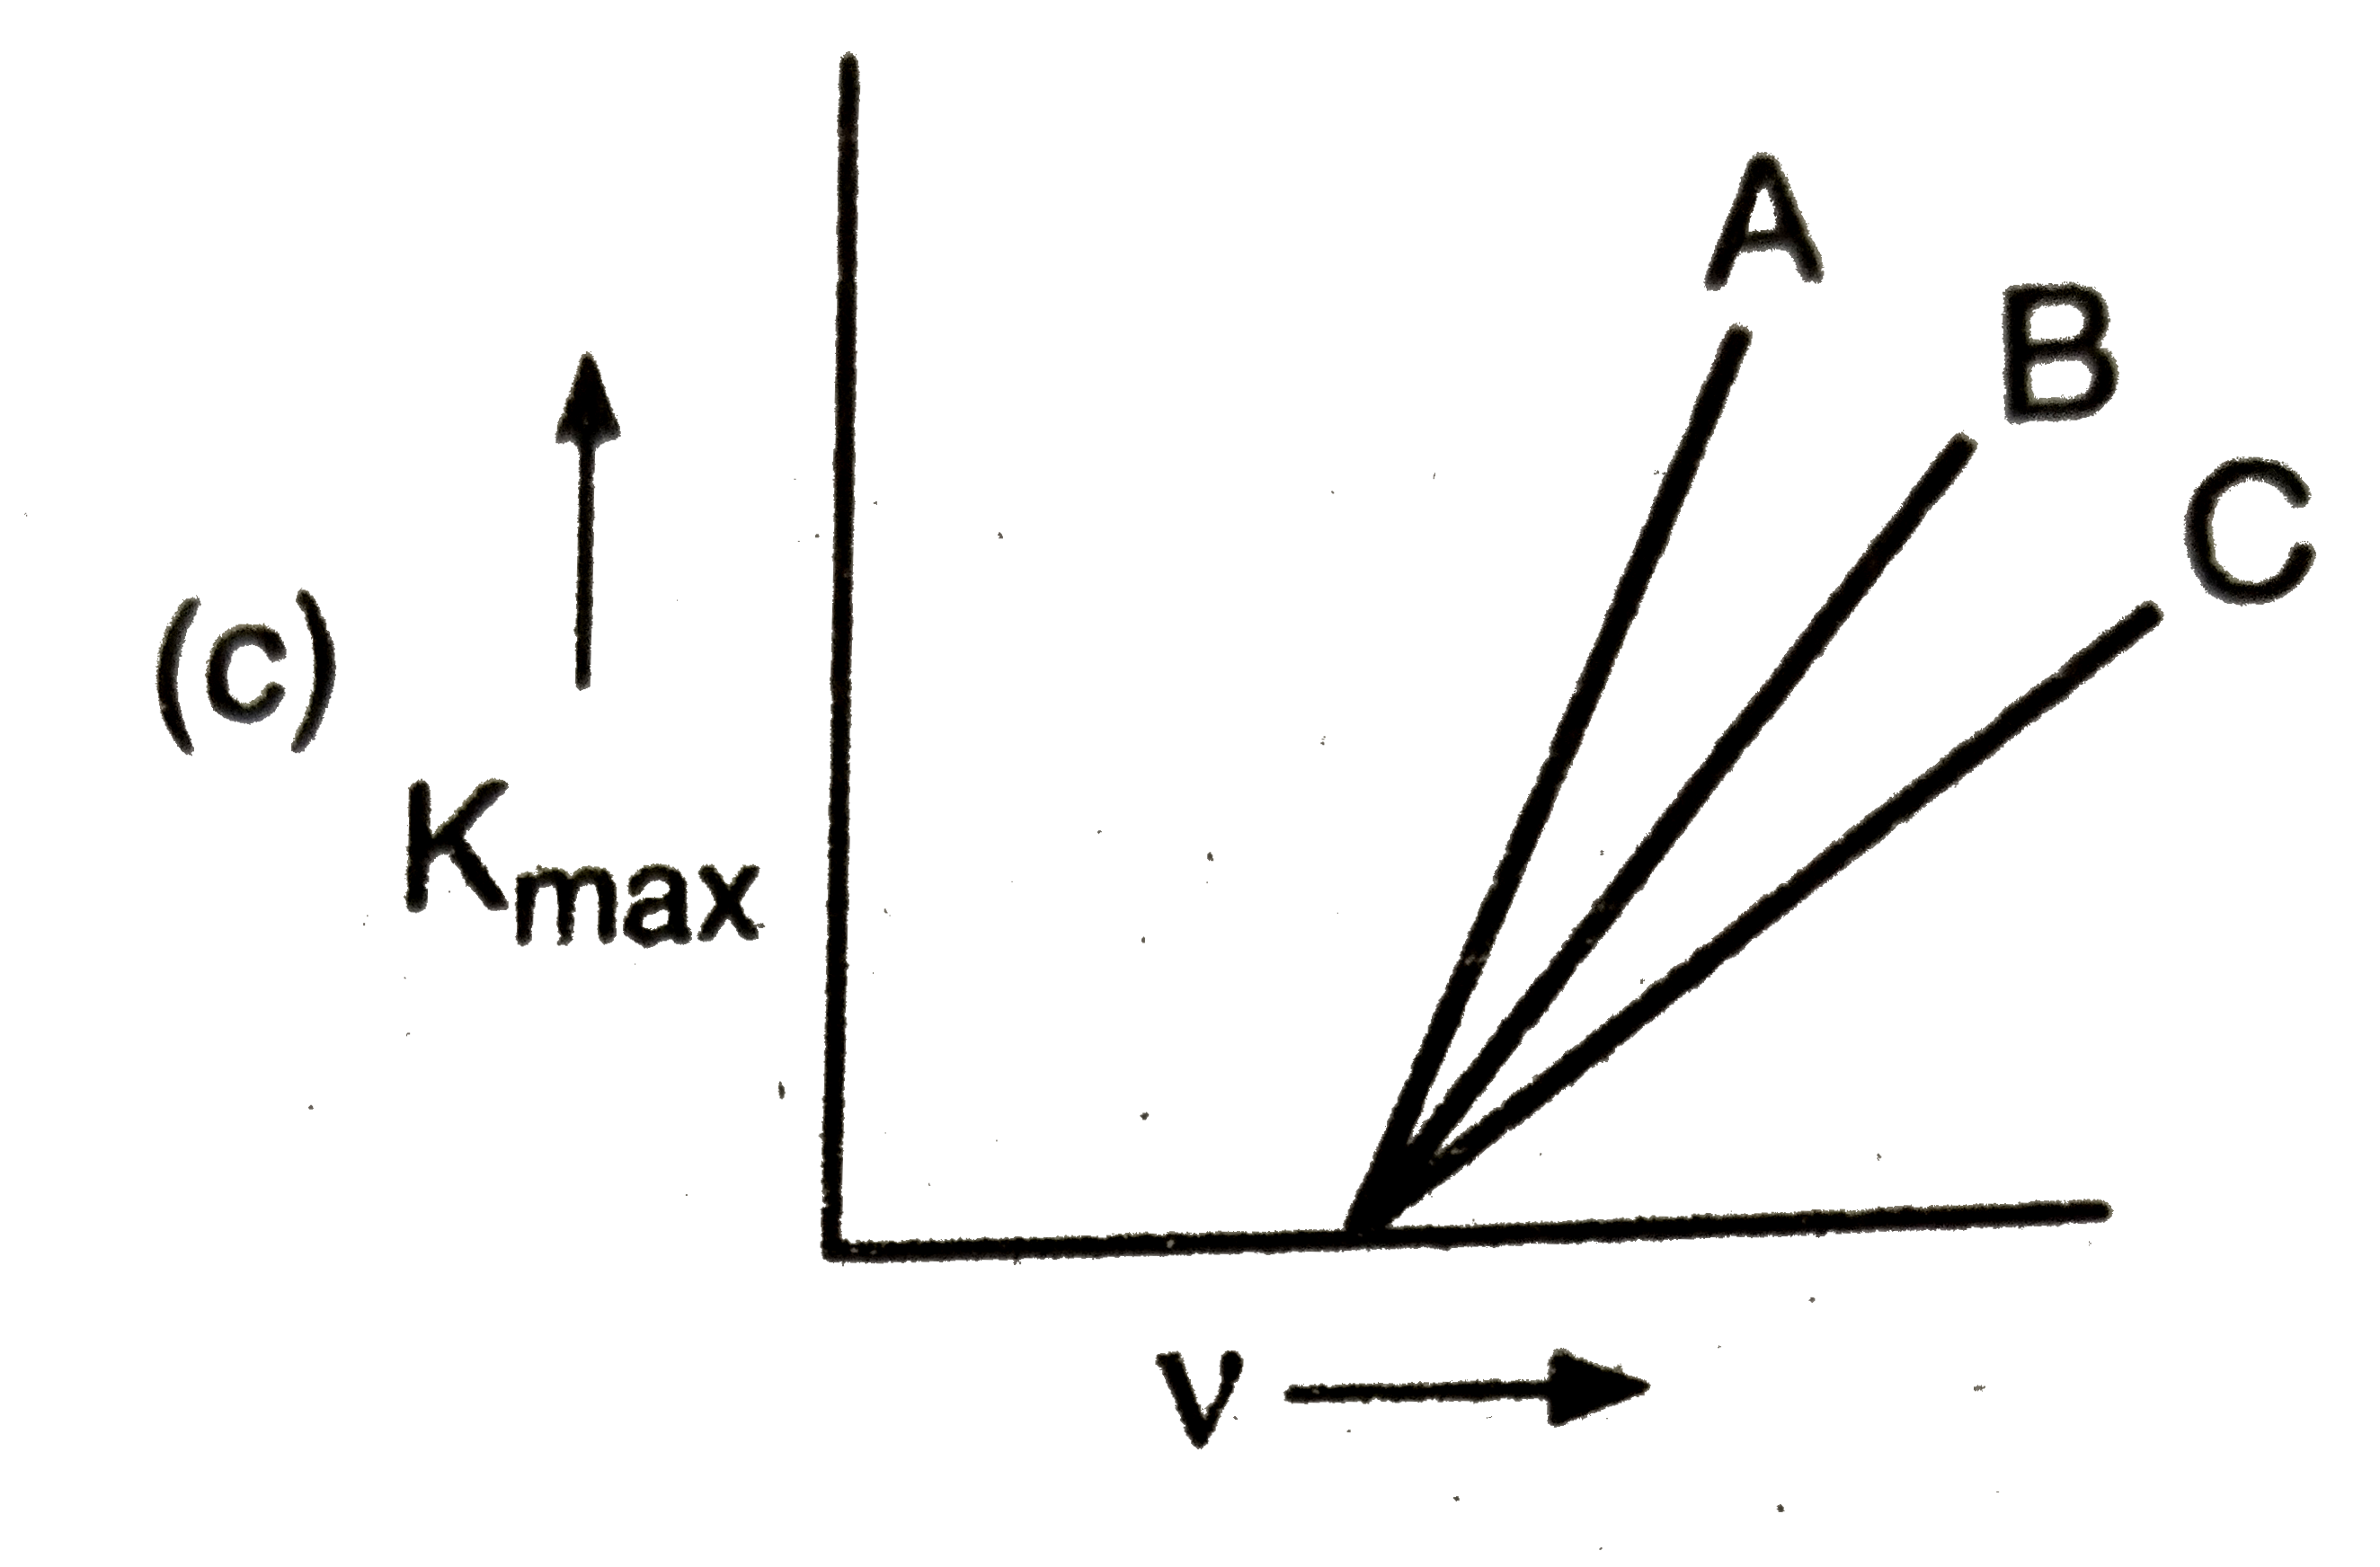 D
D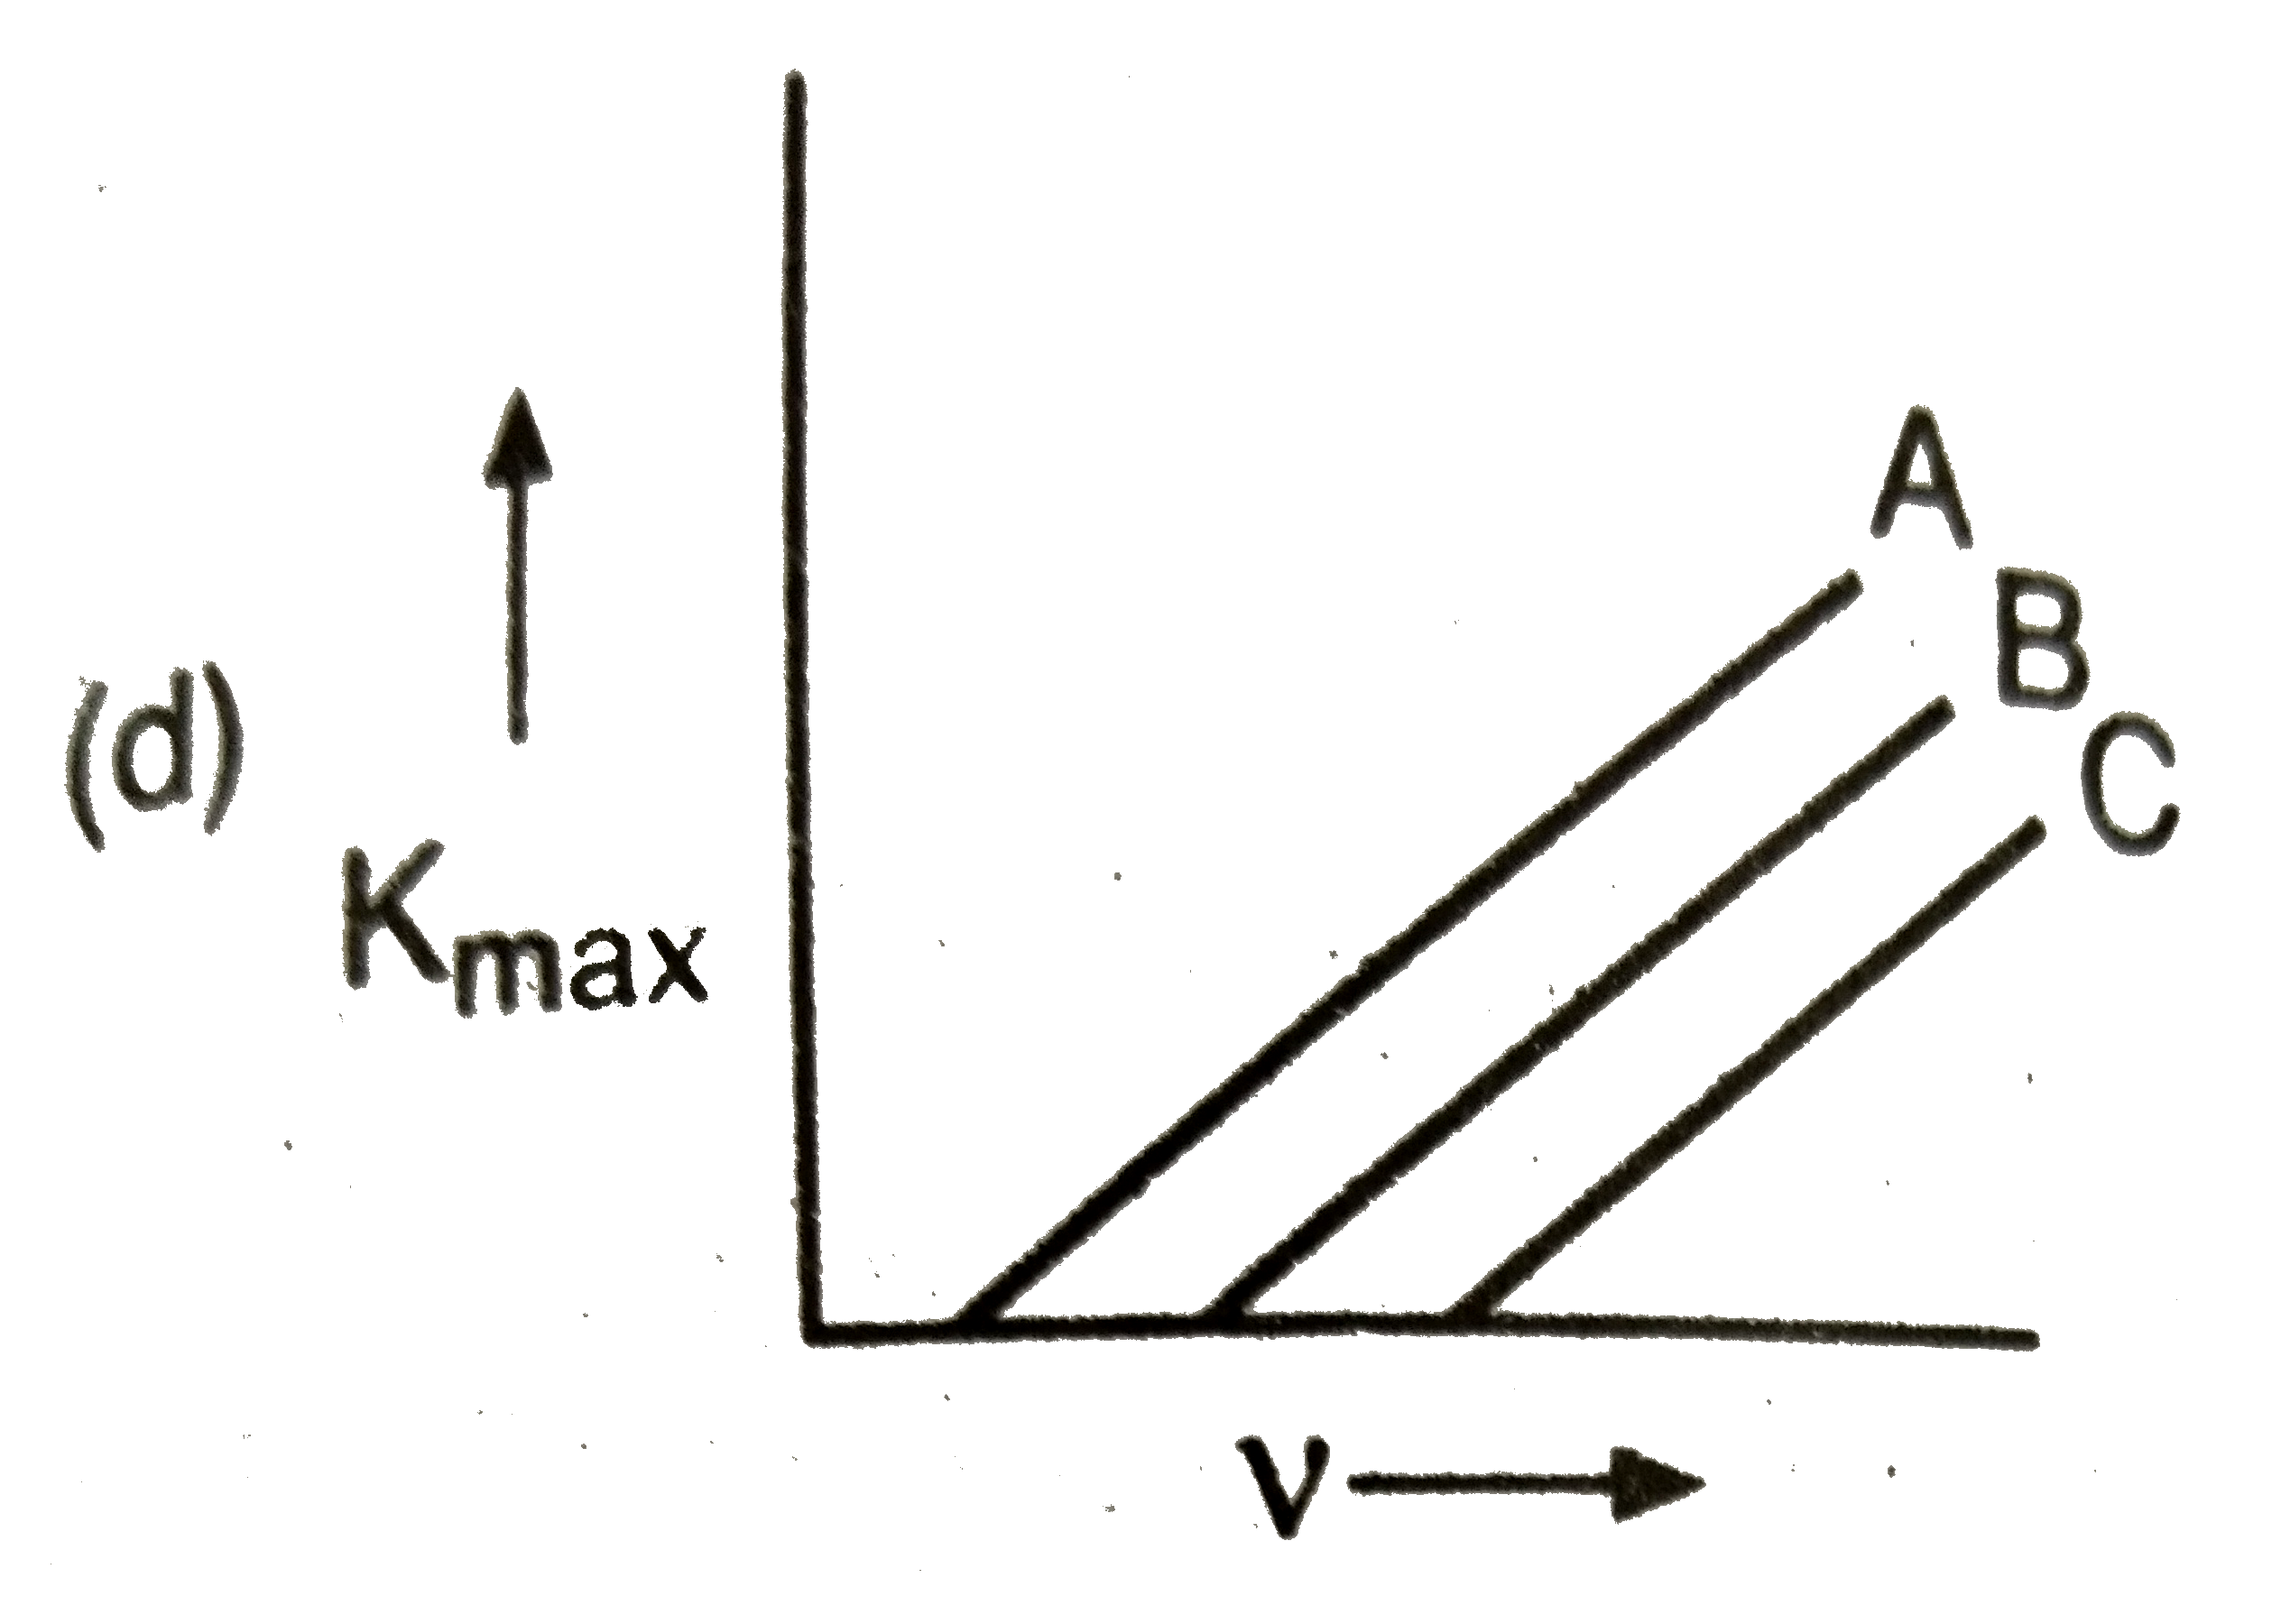
the work function of metal is W and λ is the wavelength of the incident radiation. There is no emission of photoelecrons when
Aλ>hcWBλ=hcWCλ<hcWDλ≤hcW
Ultraviolet radiations of different frequencies v1are incident on two photosensitive materials having work functions W1 and W2(W1>W2) respectively. The kinetic energy of the emitted electrons is same in both the cases. Which one of the two radiations will be of higher frequency?
View SolutionThe resistance of the four arms A, B, C and D of a wheatstone bridge as shown in the figure are 10Ω, 20Ω ,30Ω and 60Ω respectively . The emf and internal resistance of the cell are 15V and 2.5Ω respectively . If the galvanometer resistance is 80Ω then the net current drawn from the cell will be
_PHY_E05_111_Q01.png)
View SolutionWhen photons of energy hv fall on a metal plate, having a work function W, the maximum kinetic energy of the ejected photo electrons is K. What will be the maximum K.E. of the ejected photo electrons, from the same plate if the frequency of incident radiation is doubled ?
View SolutionIn an electrical circuit three incandescent bulbs A,BandC of rating 40W,60Wand100W respectively are connected in parallel to an electric source. Which of the following is likely to happen regarding their brightness ?
View SolutionIf photons of frequency v are incident on the surfaces of metals. A and B of threshold frequencies v2 and v3 respectively, the ratio of the maximum kinetic energy of electrons emitted from A to that from B is
View Solution
