The following table shows the expenditure in percentage incurred on the construction of a house in a city :

Represent the above data by a pie chart.
Step by step video & image solution for The following table shows the expenditure in percentage incurred on the construction of a house in a city : Represent the above data by a pie chart. by Maths experts to help you in doubts & scoring excellent marks in Class 8 exams.
Updated on:21/07/2023Topper's Solved these Questions
- PIE CHARTS BOOK - RS AGGARWALCHAPTER - PIE CHARTS EXERCISE - Exercise 24A
10 Videos
- PIE CHARTS BOOK - RS AGGARWALCHAPTER - PIE CHARTS EXERCISE - Exercise 24B
4 Videos
- PERCENTAGEBOOK - RS AGGARWALCHAPTER - PERCENTAGEEXERCISE - TEST PAPER -9 ( TRUE AND FALSE )
4 Videos
- PLAYING WITH NUMBERSBOOK - RS AGGARWALCHAPTER - PLAYING WITH NUMBERSEXERCISE - Test Paper-5
11 Videos
Similar Questions
The following table shows the percentage of buyers of four different brands of bathing soaps.

Represent the above data by a pie chart.
View SolutionThe following data shows the expenditure of a person on different items during a month. Represent the data by a pie-chart. Items of expenditure, Rent, Education, Food, Clothing, Others Amount (in Rs.), 2700, 1800, 2400, 1500, 2400
View Solution
Knowledge Check
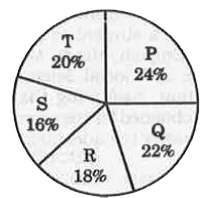
The following pie-chart shows the expenditure (in percentage) of five companies P, Q, R, S and T in the year 2016.

What is the respective ratio between the total expenditure of company P, Q and S together to the total expenditure?A31:60B50:31C60:31D31:50The table shows the production of different types of cars (in thousands).
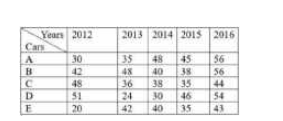
यह तालिका अलग-अलग प्रकार के कारों का उत्पादन ( हज़ार में) दर्शाती है | If the data related to the production of cars of type E is represented by a pie chart, then the central angle of the sector
representing the data of production of cars in 2013 will be:
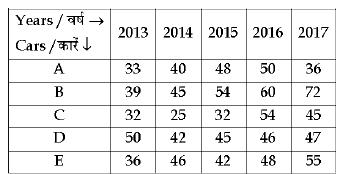
यदि E प्रकार की कारों के उत्पादन से संबंधित आंकड़ों को एक पाई-चार्ट के द्वारा प्रदर्शित किया जाए, तो 2013 में कारों के उत्पादन के आंकड़ों को दर्शाने वाले खंड का केंद्रीय कोण होगा :A102∘B84∘C70∘D80∘The table shows the production of different types of cars

If the data regarding to the production of cars of type B is represented by a pie chart, then the angle of the sector representing the data of production of car in 2016 will be:A80∘B96∘C60∘D72∘
The following table shows the expenditure of a family whose monthly income is * 22,000.Represent the above data by a pie chart.
View SolutionGiven below is the result of an annual examination of a class, showing the percentage of students in each category .

Represent the above data by a pie chart.
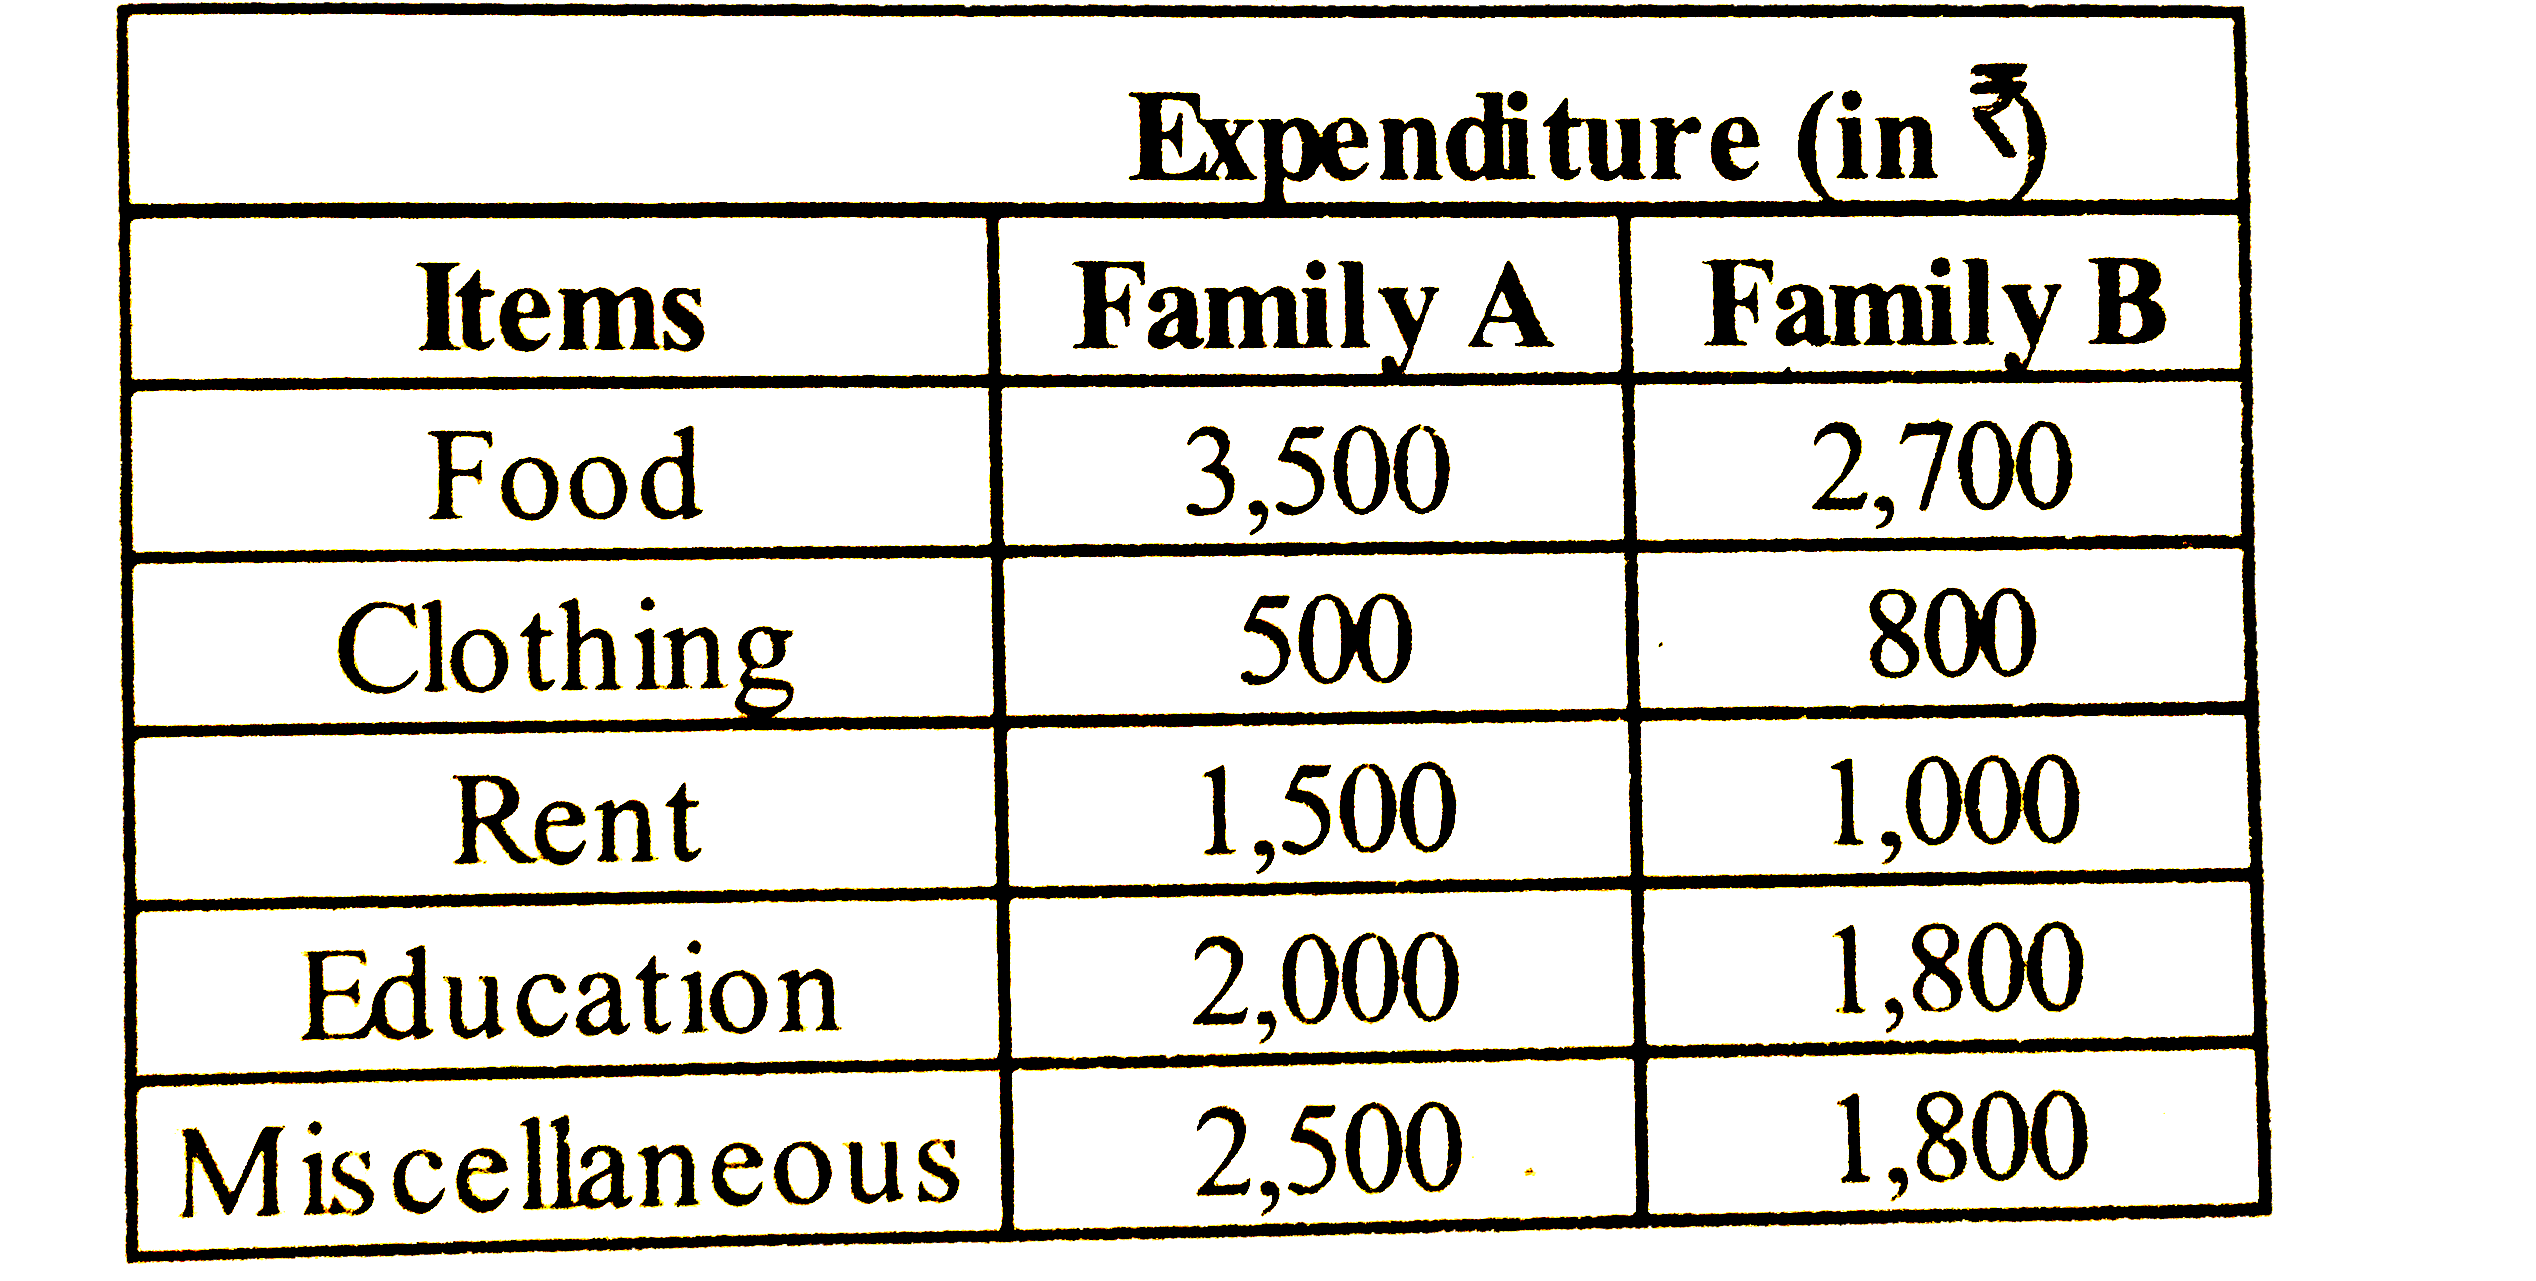
View SolutionThe following table gives the monthly expenditure of two families

In constructing a pie diagram to the above data, the radi of the circles are to be chosen by which one of the following ration?
View SolutionThe following table gives the monthly expenditure of two families:

In constructing a pie diagram to the above data, the radii of the circles are to be chosen by which one of the following ratios?
View SolutionThe following table shows the household expenditure of family on different items. Draw a pie chart to represent the given data.
ItemRentFoodClotingEducationOthersExpenditure25%30%10%15%20%
View Solution
