Total Product
Step by step video & image solution for Total Product by Economics experts to help you in doubts & scoring excellent marks in Class 11 exams.
Updated on:21/07/2023Similar Questions
Explain the relationship between the marginal products and the total product of an input.
OR
Explain the law of variable proportion with the help of total product and marginal product curves.
OR
Explain the likely behaviour of Total Product and Marginal Product when for increasing production only one input is increased while all other inputs are kept constant.
OR
State the different phases of changes in Total Product and Marginal Product in the Law of Variable Proportions. Also show the same in a single diagram.
View SolutionGiving reasons , state whether the following statements are true or false :
(i)When there are diminishing returns to a factor, total product always decreases
(ii)Total product will increase only when marginal product increases
(iii)Increase in total product always indicates that there are increasing returns to a factor
(iv)When there are diminishing returns to a factor, marginal and total product both always fall
(vi)AP rises only when MP rises
View Solution
Knowledge Check
The table shows the production of different types of cars ( in thousands).
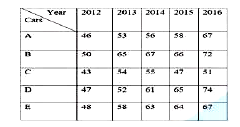
What is the ratio of the total production of type C and D cars in 2012 to the total production of type A cars in 2014 and type E cars in 2015?AA) 5:6BB) 9:11CC) 3:4DD) 11:12The table shows the production of different types of cars (in thousands)
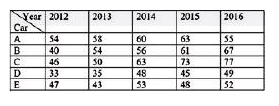
The total production of all types of cars , except type B, in 2012 is what percent less than the total production of all types of cars in 2016?A40B25.8C26.7D42The table shows the production (in thousands) of different types of cars.
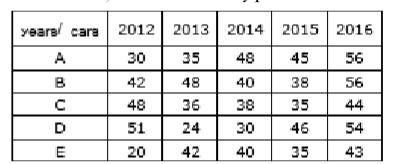
What is the ratio of total production of C type cars in year 2013 & A in year 2014 and the total production of B in year 2016 & E type cars in 2015?A11 : 12B12 : 11C10 : 11D12 : 13
Study the bar graph and answer the question that follows.
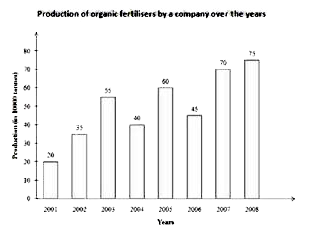
The ratio of the total production of organic fertilizers by the company in the years 2005. 2006 and 2008 to the total production in the years 2001, 2002, 2003 and 2004. is:
View SolutionThe table given below shows the production of maize by 5 different states as a percenatge of total production. Each state produces only maizw and rice. There are three types of rice - R1,R2andR3. The table also shows the R1 type of rice produced as a percentage of total rice production and the ratio of R2andR3 type of rice. Total production by each state is 625000 tonnes.
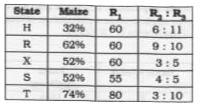
F = Total production of R2 type of rice by all the states.
K = Average of the total production of R1 type of rice by all the states.
What is the value of KF?
View SolutionThe table given below shows the production of maize by 5 different states as a percenatge of total production. Each state produces only maizw and rice. There are three types of rice - R1,R2andR3. The table also shows the R1 type of rice produced as a percentage of total rice production and the ratio of R2andR3 type of rice. Total production by each state is 625000 tonnes.
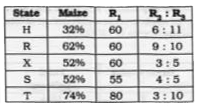
What is the sum of the total production of maize by state X and T and total production of R2 type of rice by state S and R?
View SolutionJharkhand's contribution in the total coal production in India is
View SolutionTotal ATP production durig EMP pathway is
View Solution