Average Product
Step by step video & image solution for Average Product by Economics experts to help you in doubts & scoring excellent marks in Class 11 exams.
Updated on:21/07/2023Similar Questions
The bar graph given below shows the data of the production of paper (in lakh tonnes) by three different companies P, Q and R over the years.
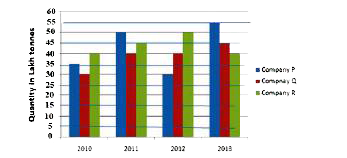
What is the ratio of the average production by company P during the period 2010 to 2013 to the average production by company R during the same period?
View SolutionThe following graph shows the production of wheat flour (in 1000 tonnes) by three companies X, Y and Z over the years. Study the graph and answer the questions.
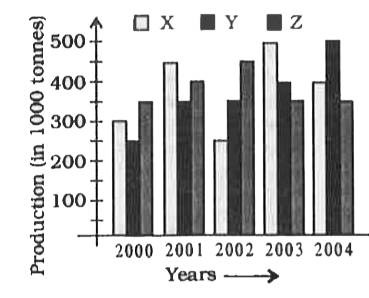
What is the ratio of the average production of company X in the period 2002-2004 to the average production of company Y in the same period ?
View Solution
Knowledge Check
Read the following graph carefully and answer the questions given below.
Production of sugar in three different factories over years (in thousand tonnes)
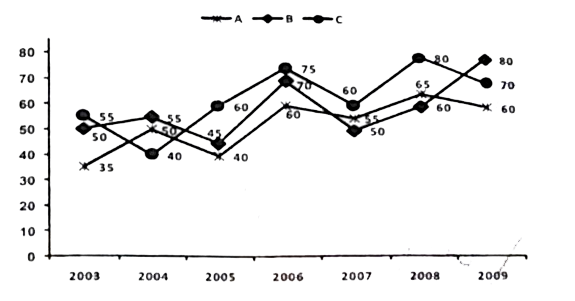
The average production of company A is approximately what percent of average production of company C ?A86B83C77D90Study the given and answer the question that follows.
Production of Fertilizers by a Company (in 10,000 tonnes) Over the Years
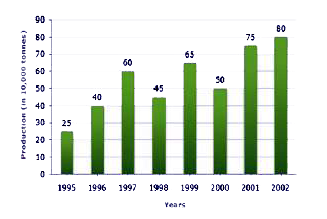
The average production in 2000 and 2001 was less than the average production of which of the following pairs of years ?A2001 and 2002B1997 and 1998C1999 and 2000D1996 and 1997Study the given and answer the question that follows.
Production of Fertilizers by a Company (in 10,000 tonnes ) Over the Years
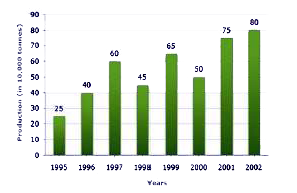
The average production in 2000 and 2001 was less than the average production of which of the following paris of years ?A2001 and 2002B1997 and 1998C1999 and 2000D1996 and 1997
Production of three different flavours soft drinks X, Y and Z over a period of six years has been expressed in the following graph. Study the graph and answer the questions
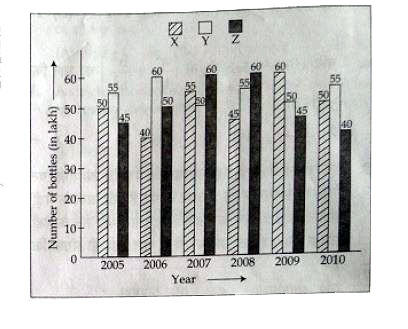
The difference (in lakh bottles) between the average production of flavour X in 2005, 2006 2007 and the average production of flavour Y in 2008, 2009 and 2010 is
View SolutionThe following graph shows the production of cement (in lakh tons) of four factories A, B, C and D over the years
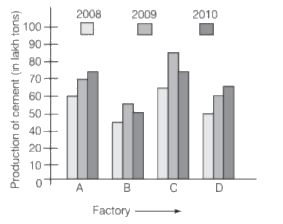
The defference (in lakh tons) between the average production of cement by four factories in 2009 and average production by the same factories in 2008 is
View SolutionStudy the following graph carefully to answer the questions that follows
Production of Alluminium by different companies in three consecutive years (in lakh tonne)
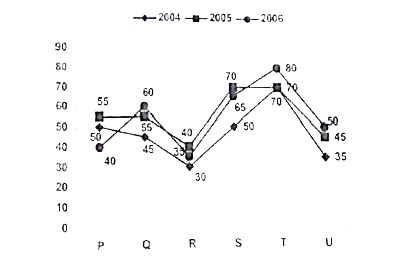
What is the difference between average production of the six companies in 2005 and average production of the same companies in 2004?
View SolutionThe following graph shows the production of wheat flour (in 1000 tonnes) by three companies X, Y and Z over the years. Study the graph and answer the questions.
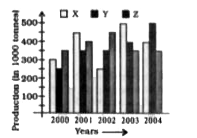
What is the ratio of the average production of company X in the period 2002-2004 to the average production of company Y in the same period ?
View SolutionProduction of steel in different companies in three consecutive years (in lakh tonnes)
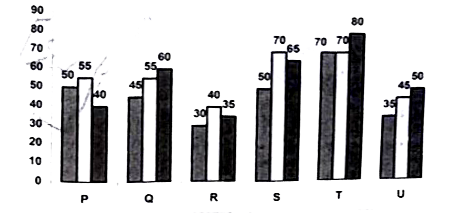
In which of the following pairs of companies the difference between average production for the three years is maximum?
View Solution
