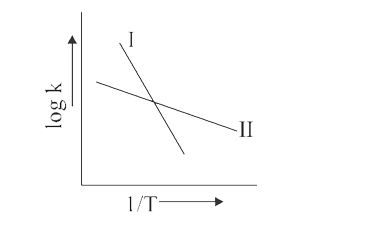
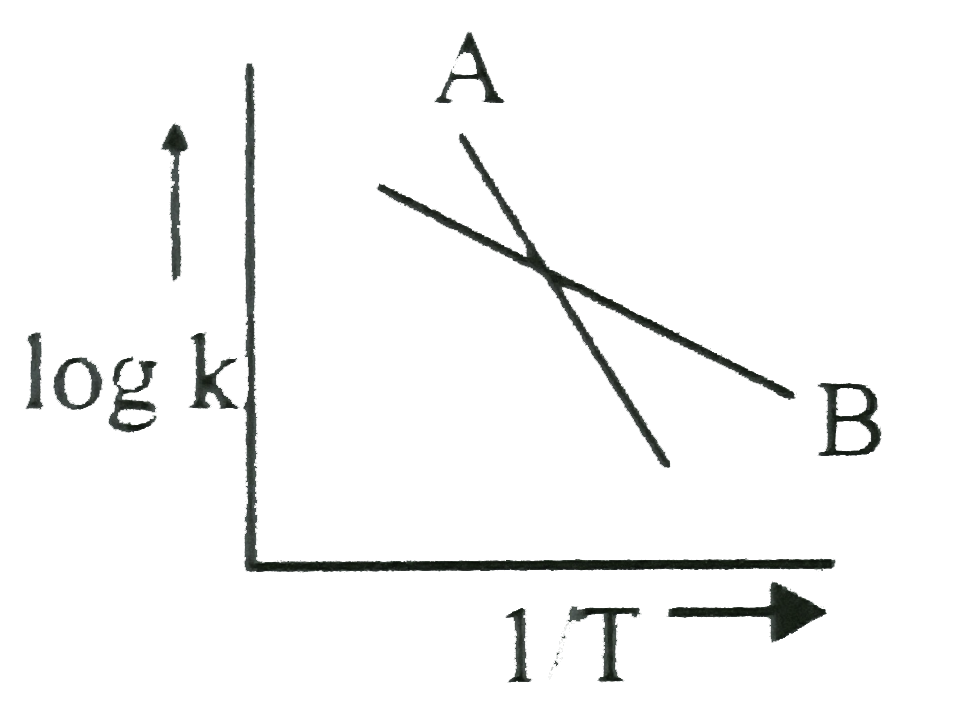
The Arrhenius plots of two reactions, I and II are shown graphically-
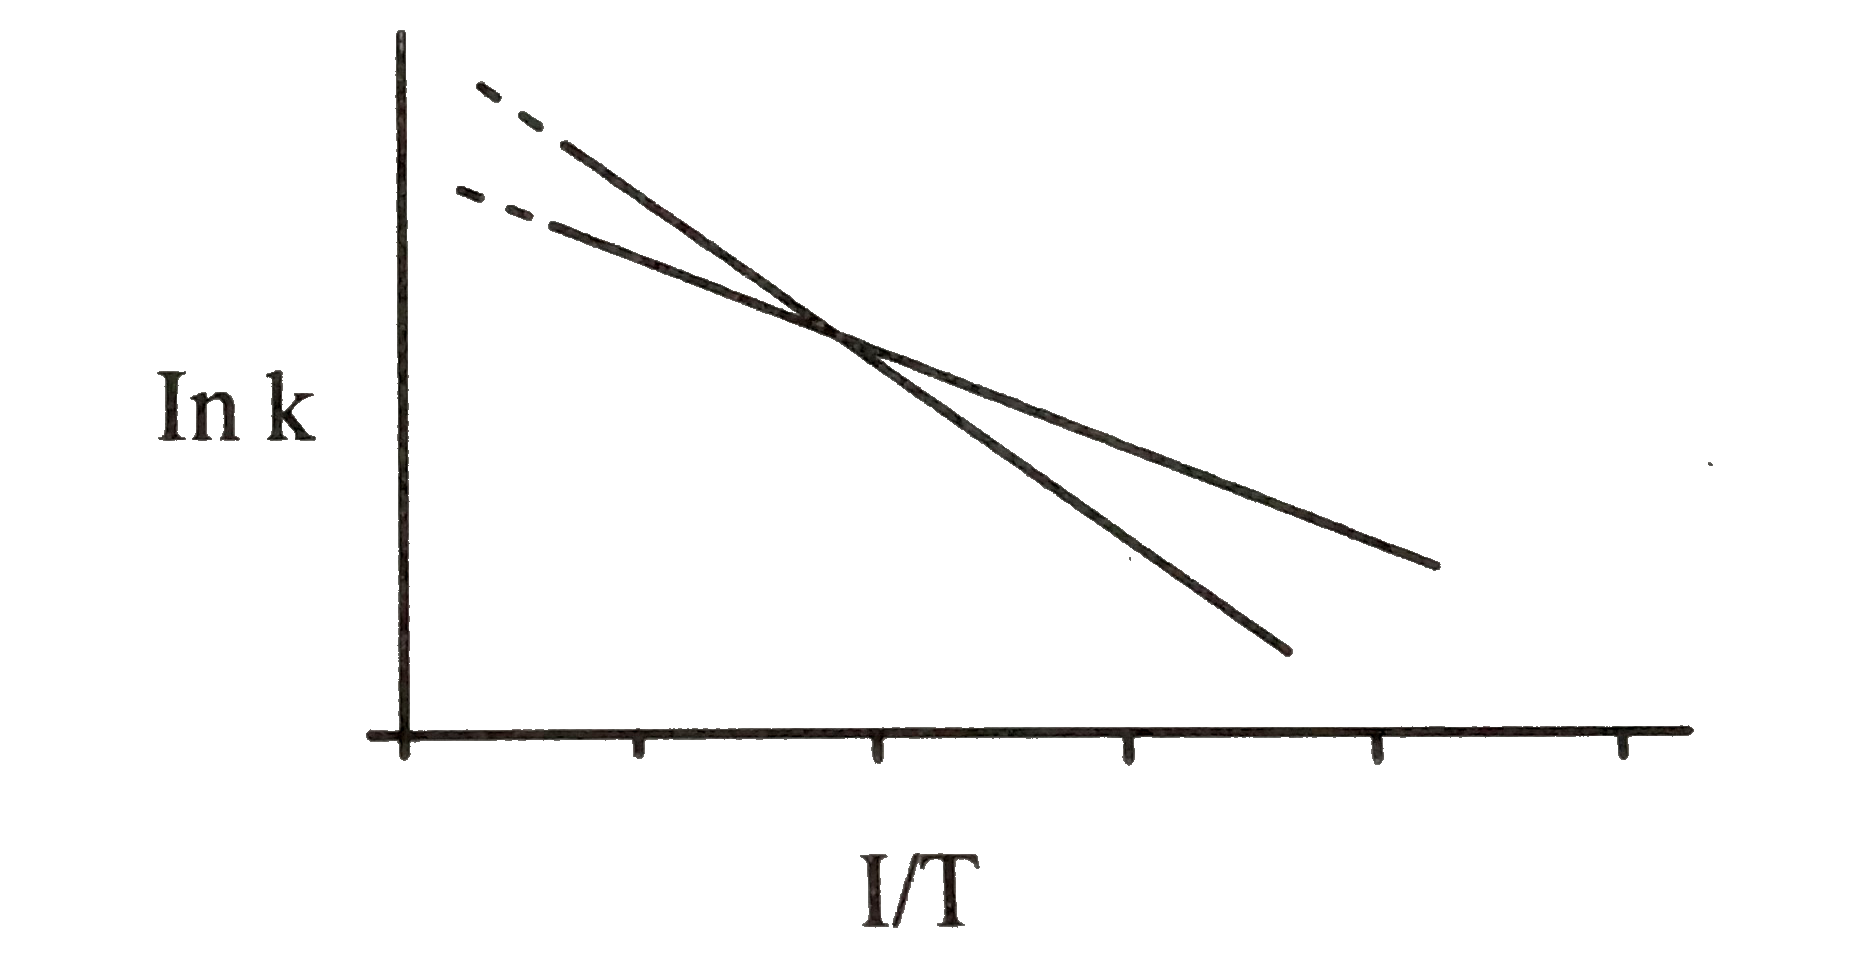
The graph suggest that-
EI>EIIandAI>AII
EII>EIandAII>AI
EI>EIIandAII>AI
EII>E1andAI>AII
The correct Answer is:A
For plot between In k v/s I/T y-intrercept in In A
& slope is −EaR
therefore, EII<E1andAI>AII
Topper's Solved these Questions
- BOOK - KVPY PREVIOUS YEARCHAPTER - KVPYEXERCISE - PART-I BIOLOGY1videos
KVPY
- BOOK - KVPY PREVIOUS YEARCHAPTER - KVPYEXERCISE - PART-2 CHEMISTRY15videos
KVPY
- BOOK - KVPY PREVIOUS YEARCHAPTER - KVPYEXERCISE - Mathematics10videos
KVPY
- BOOK - KVPY PREVIOUS YEARCHAPTER - KVPY 2021EXERCISE - PART II CHEMISTRY10videos
KVPY 2021
Similar Questions
Knowledge Check
- Question 1 - Select One
The Arrhenius relationship of two different reactions is shown below. Which reaction is faster at a lower temperature and which is more sensitive to changes of temperature ?
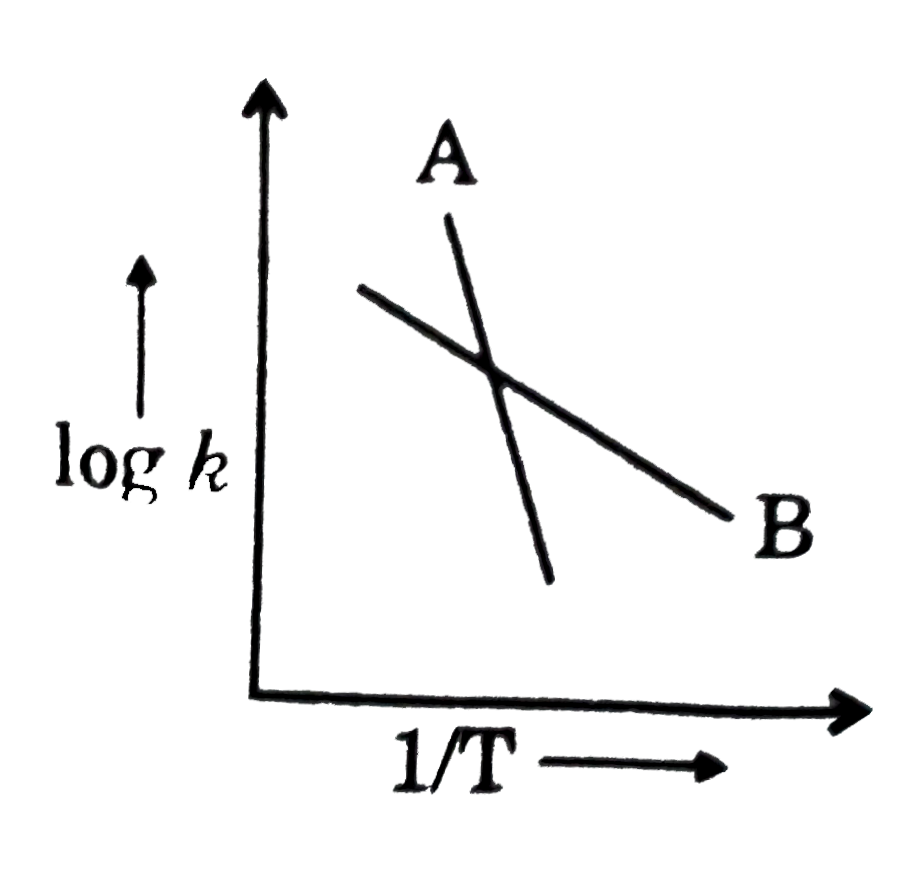 AB faster, A more sensitiveBB in both casesCA in both casesDA is faser, B more sensitive
 - Question 2 - Select One
The Arrhenius relationship of two different reactions is shown below. Which reaction is faster at a lower temperature and which is more sensitive to changes of temperature ?
 AB faster, A more sensitiveBB in both casesCA in both casesDA faster, B more sensitive
 - Question 3 - Select One
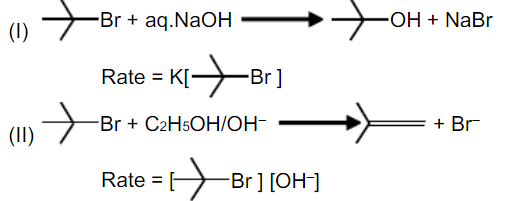
Correct statement regarding these two reaction I and IIARate of I reaction remain unchanged if concentration of OH− increases.BRate of II reaction remain unchanged if concentration of OH− increases.CRate of both reactions become double if concentration of OH− become doubleDRate of both reactions donot depend upon concentration of OH−
Consider the reaction A→P. The change in concentration of A with time has been shown graphically.
i) Predict the order of the reaction.
ii) Derive an expression for the time required for the completion of the reaction.
 View Solution
The slope of Arrhenius Plot (lnK v/s 1/T) of 1st order reaction is -5x10³K. The value of Ea of the reaction is.
View Solutioni) Write the mathematics expressions relating the variation of the rate constant of a reaction with temperatures.
ii) How can you graphically find the activation energy of the reaction from the above expression?
iii) The slope of the line in the graph of log k(k=rate constant) versus 1/T is −5841. Calculate the activation energy of the reaction.View Solution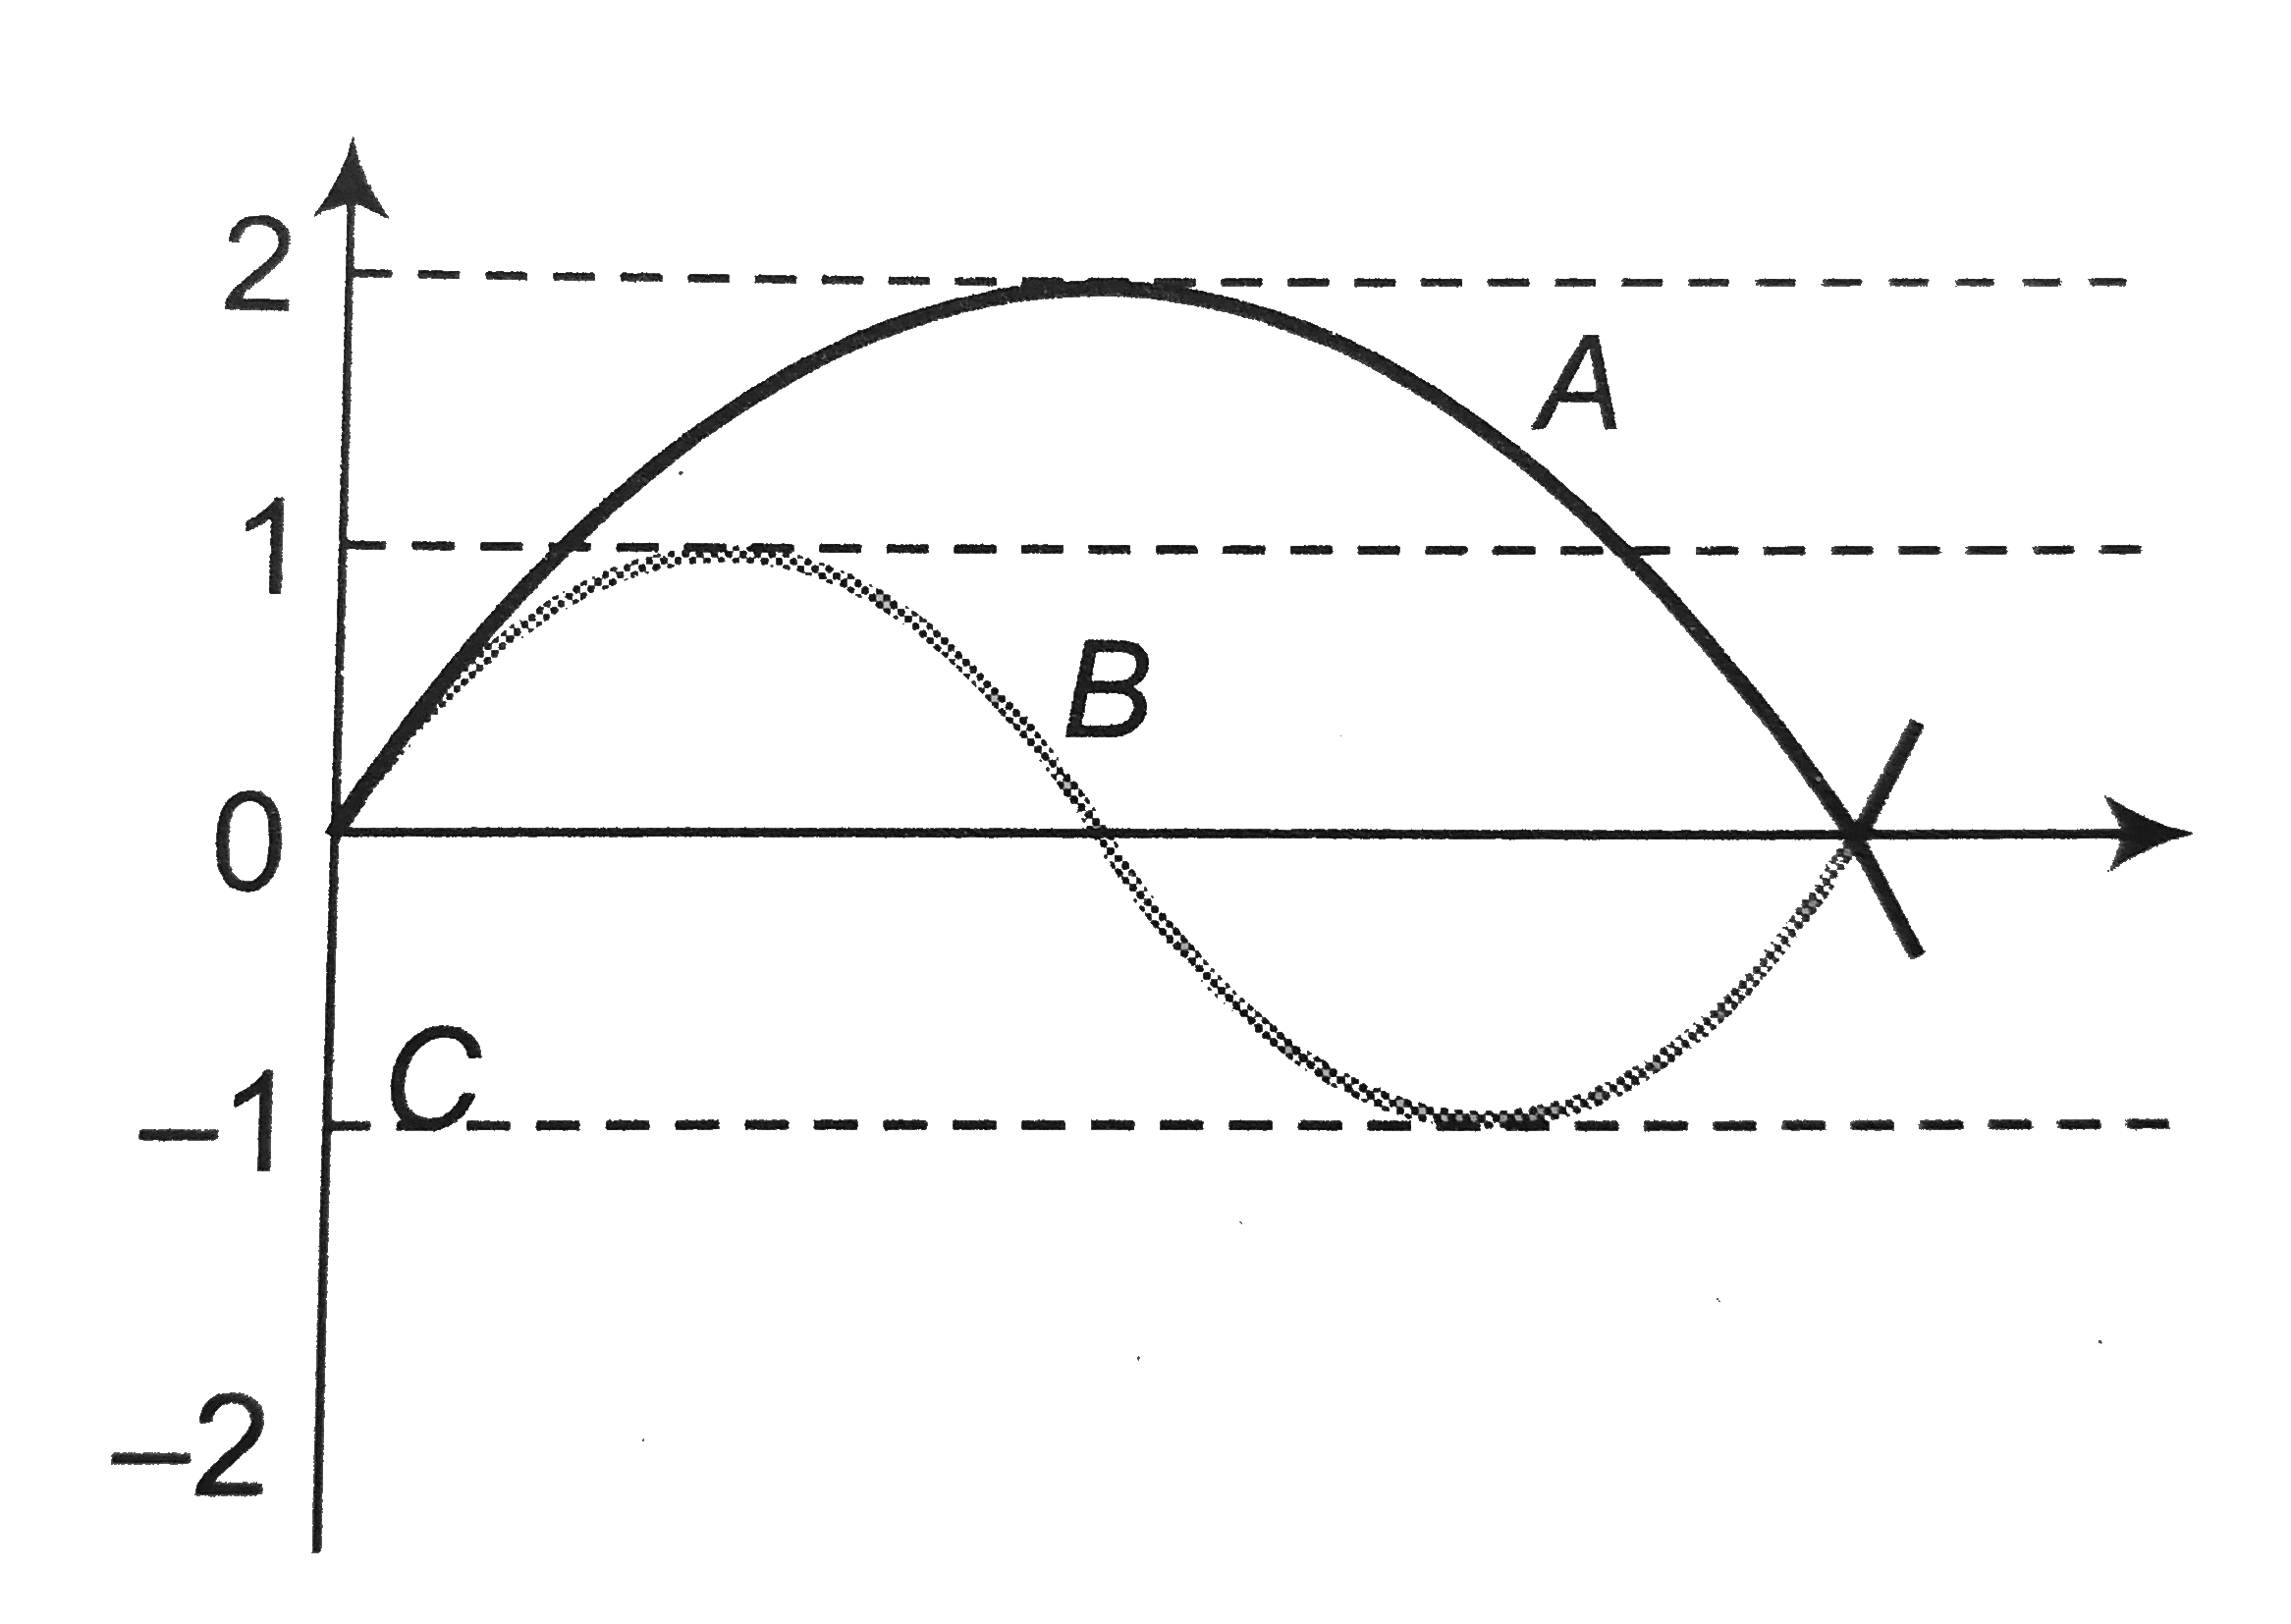
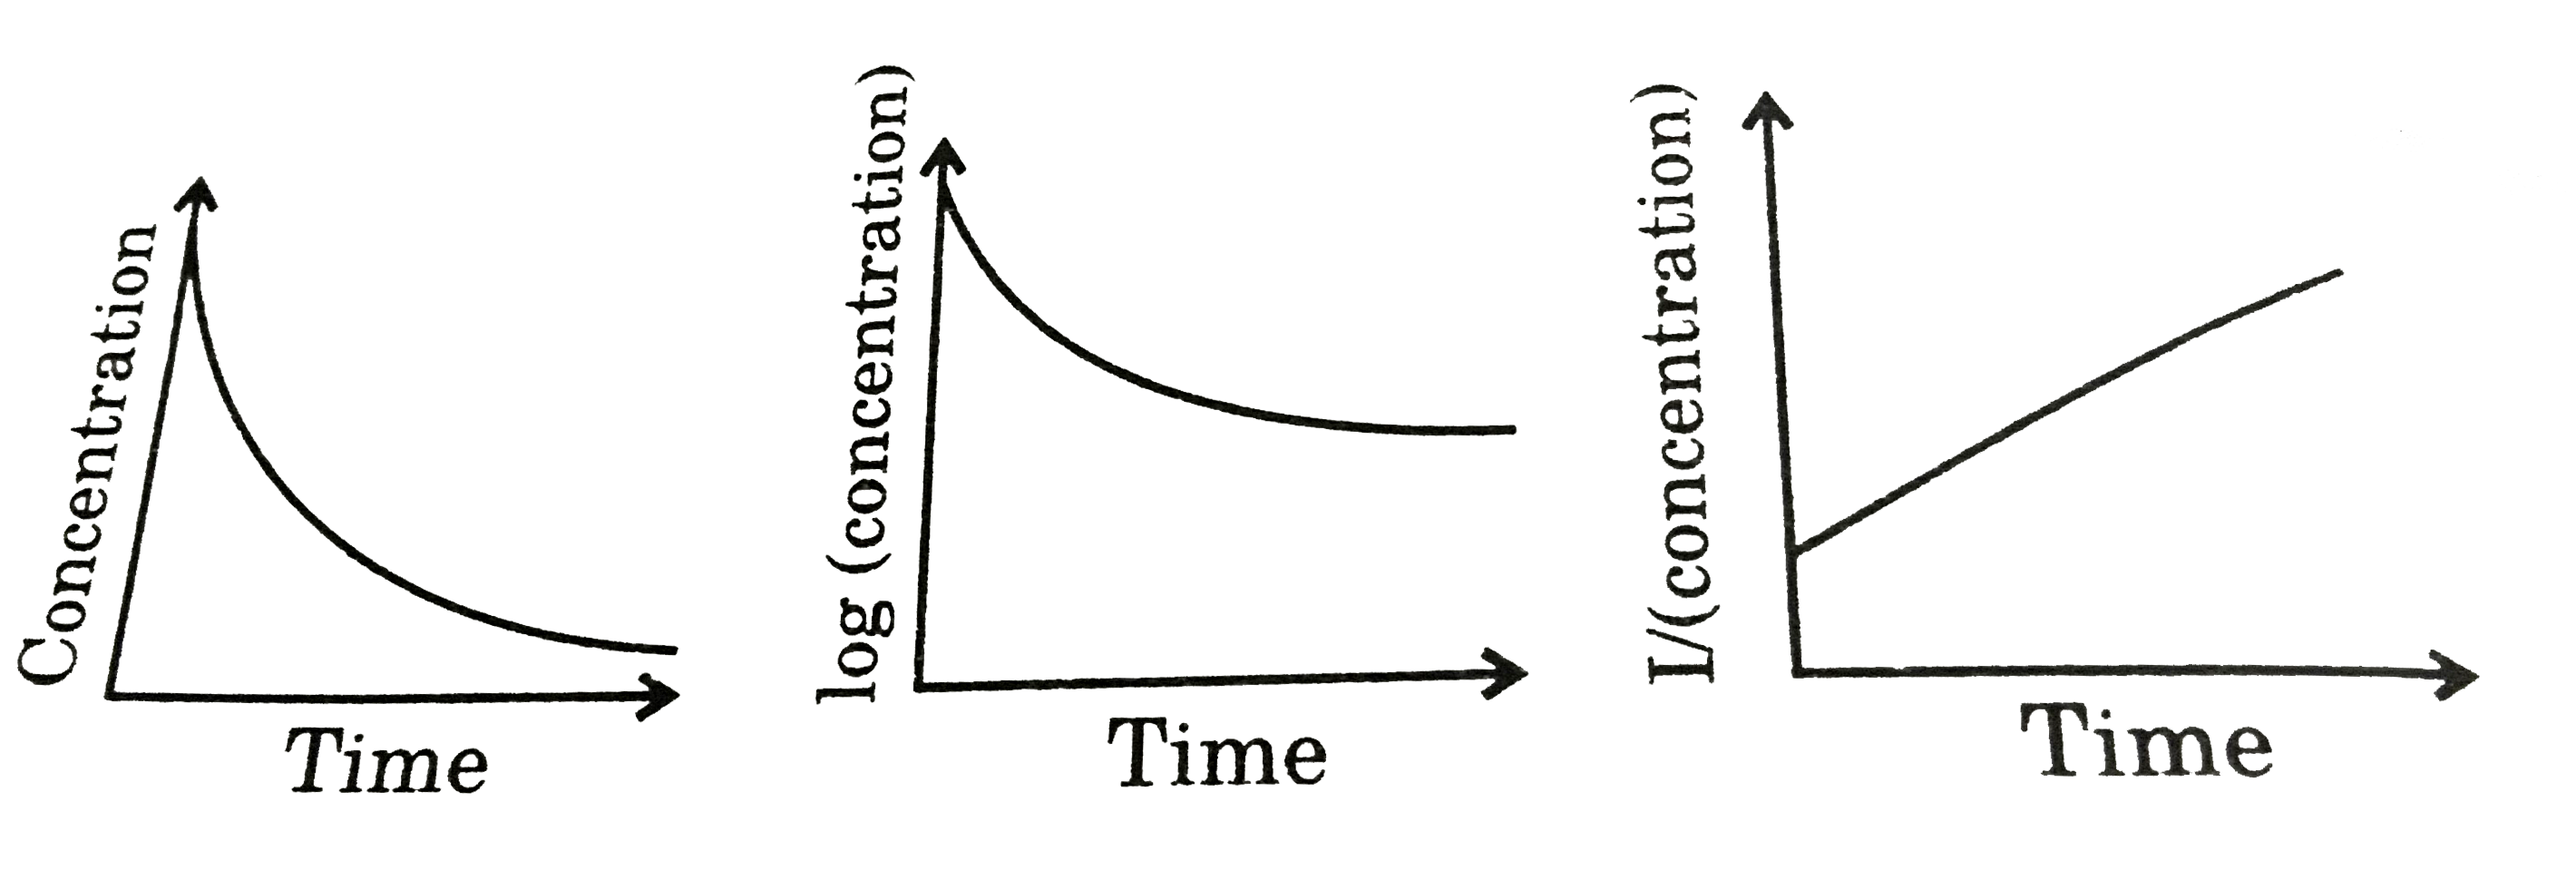
The displacement time graph for two sound waves A and B are shown in the figure. Then the ratio of their intensities IA/IB is equal toView SolutionWhat is the order of a reaction that produces the graphs shown ?
 View Solution

