Km value of enzyme is substrate concentration at
1/4 V max
2 V max
1/2 V max
4 V max
The correct Answer is:C
(C) Km value of enzyme is substrate concentrationat 1/2 V max
Topper's Solved these Questions
- BIOMOLECULESBOOK - A2ZCHAPTER - BIOMOLECULESEXERCISE - Section -b Assertion And Reason Question
11 Videos
- BIOMOLECULESBOOK - A2ZCHAPTER - BIOMOLECULESEXERCISE - Section -c Previous Years Examination Questions (neet/aipmt Questions)
116 Videos
- BIOMOLECULESBOOK - A2ZCHAPTER - BIOMOLECULESEXERCISE - Section A : Topicwise Questions Topic 3: Polysaccharide, Nucleic Acids, Bonding And Living State
43 Videos
- BIOLOGICAL CLASSIFICATIONBOOK - A2ZCHAPTER - BIOLOGICAL CLASSIFICATIONEXERCISE - Mock Test Assertion - Reasoning Question
5 Videos
- BODY FLUIDS AND CIRCULATION BOOK - A2ZCHAPTER - BODY FLUIDS AND CIRCULATION EXERCISE - Section D: Chapter-end Test
50 Videos
Similar Questions
In an enzyme catalyzed reaction, it is possible to reverse the inhibition of a reaction by increasing substrate concentration in which of the following case?
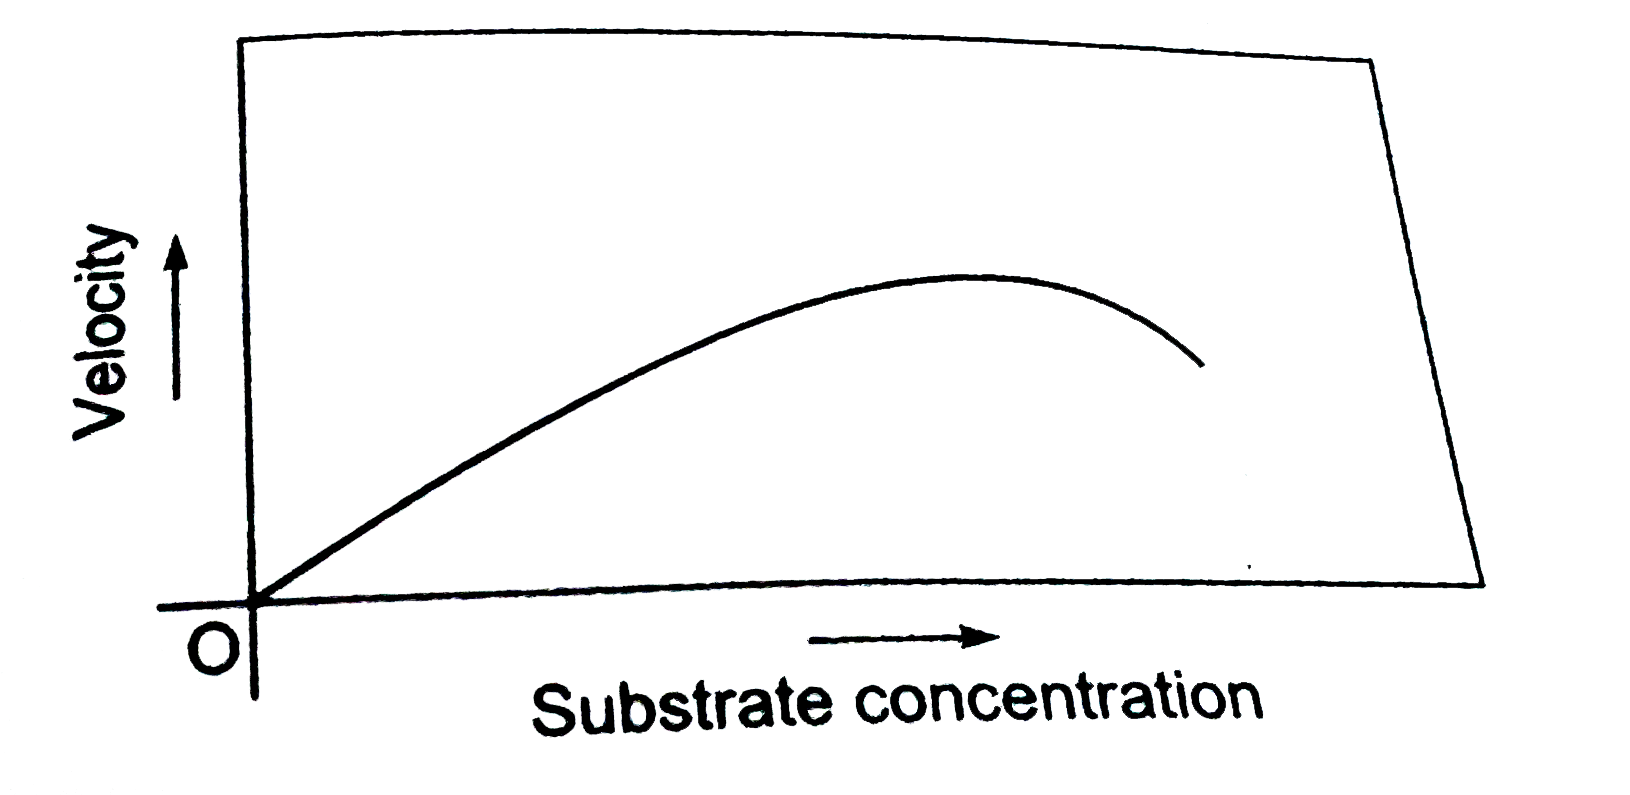
View SolutionThe graph given below shows the effect of substrate concentration on the rate of reaction of the enzyme green-gram-phosphatase What does the graph indicates?
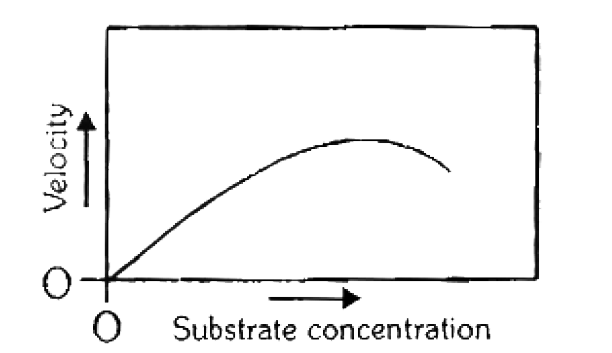
View Solution
Knowledge Check
An enzyme [E] is combined with the substrate [S] as follows:
E+SK1⇐⇒K−1ES
ESK2−−→P+E
The overall reaction rate is given by:
Rate =Vmax[S]Km+[S] and the rate of reaction varies with substrate concentration as:
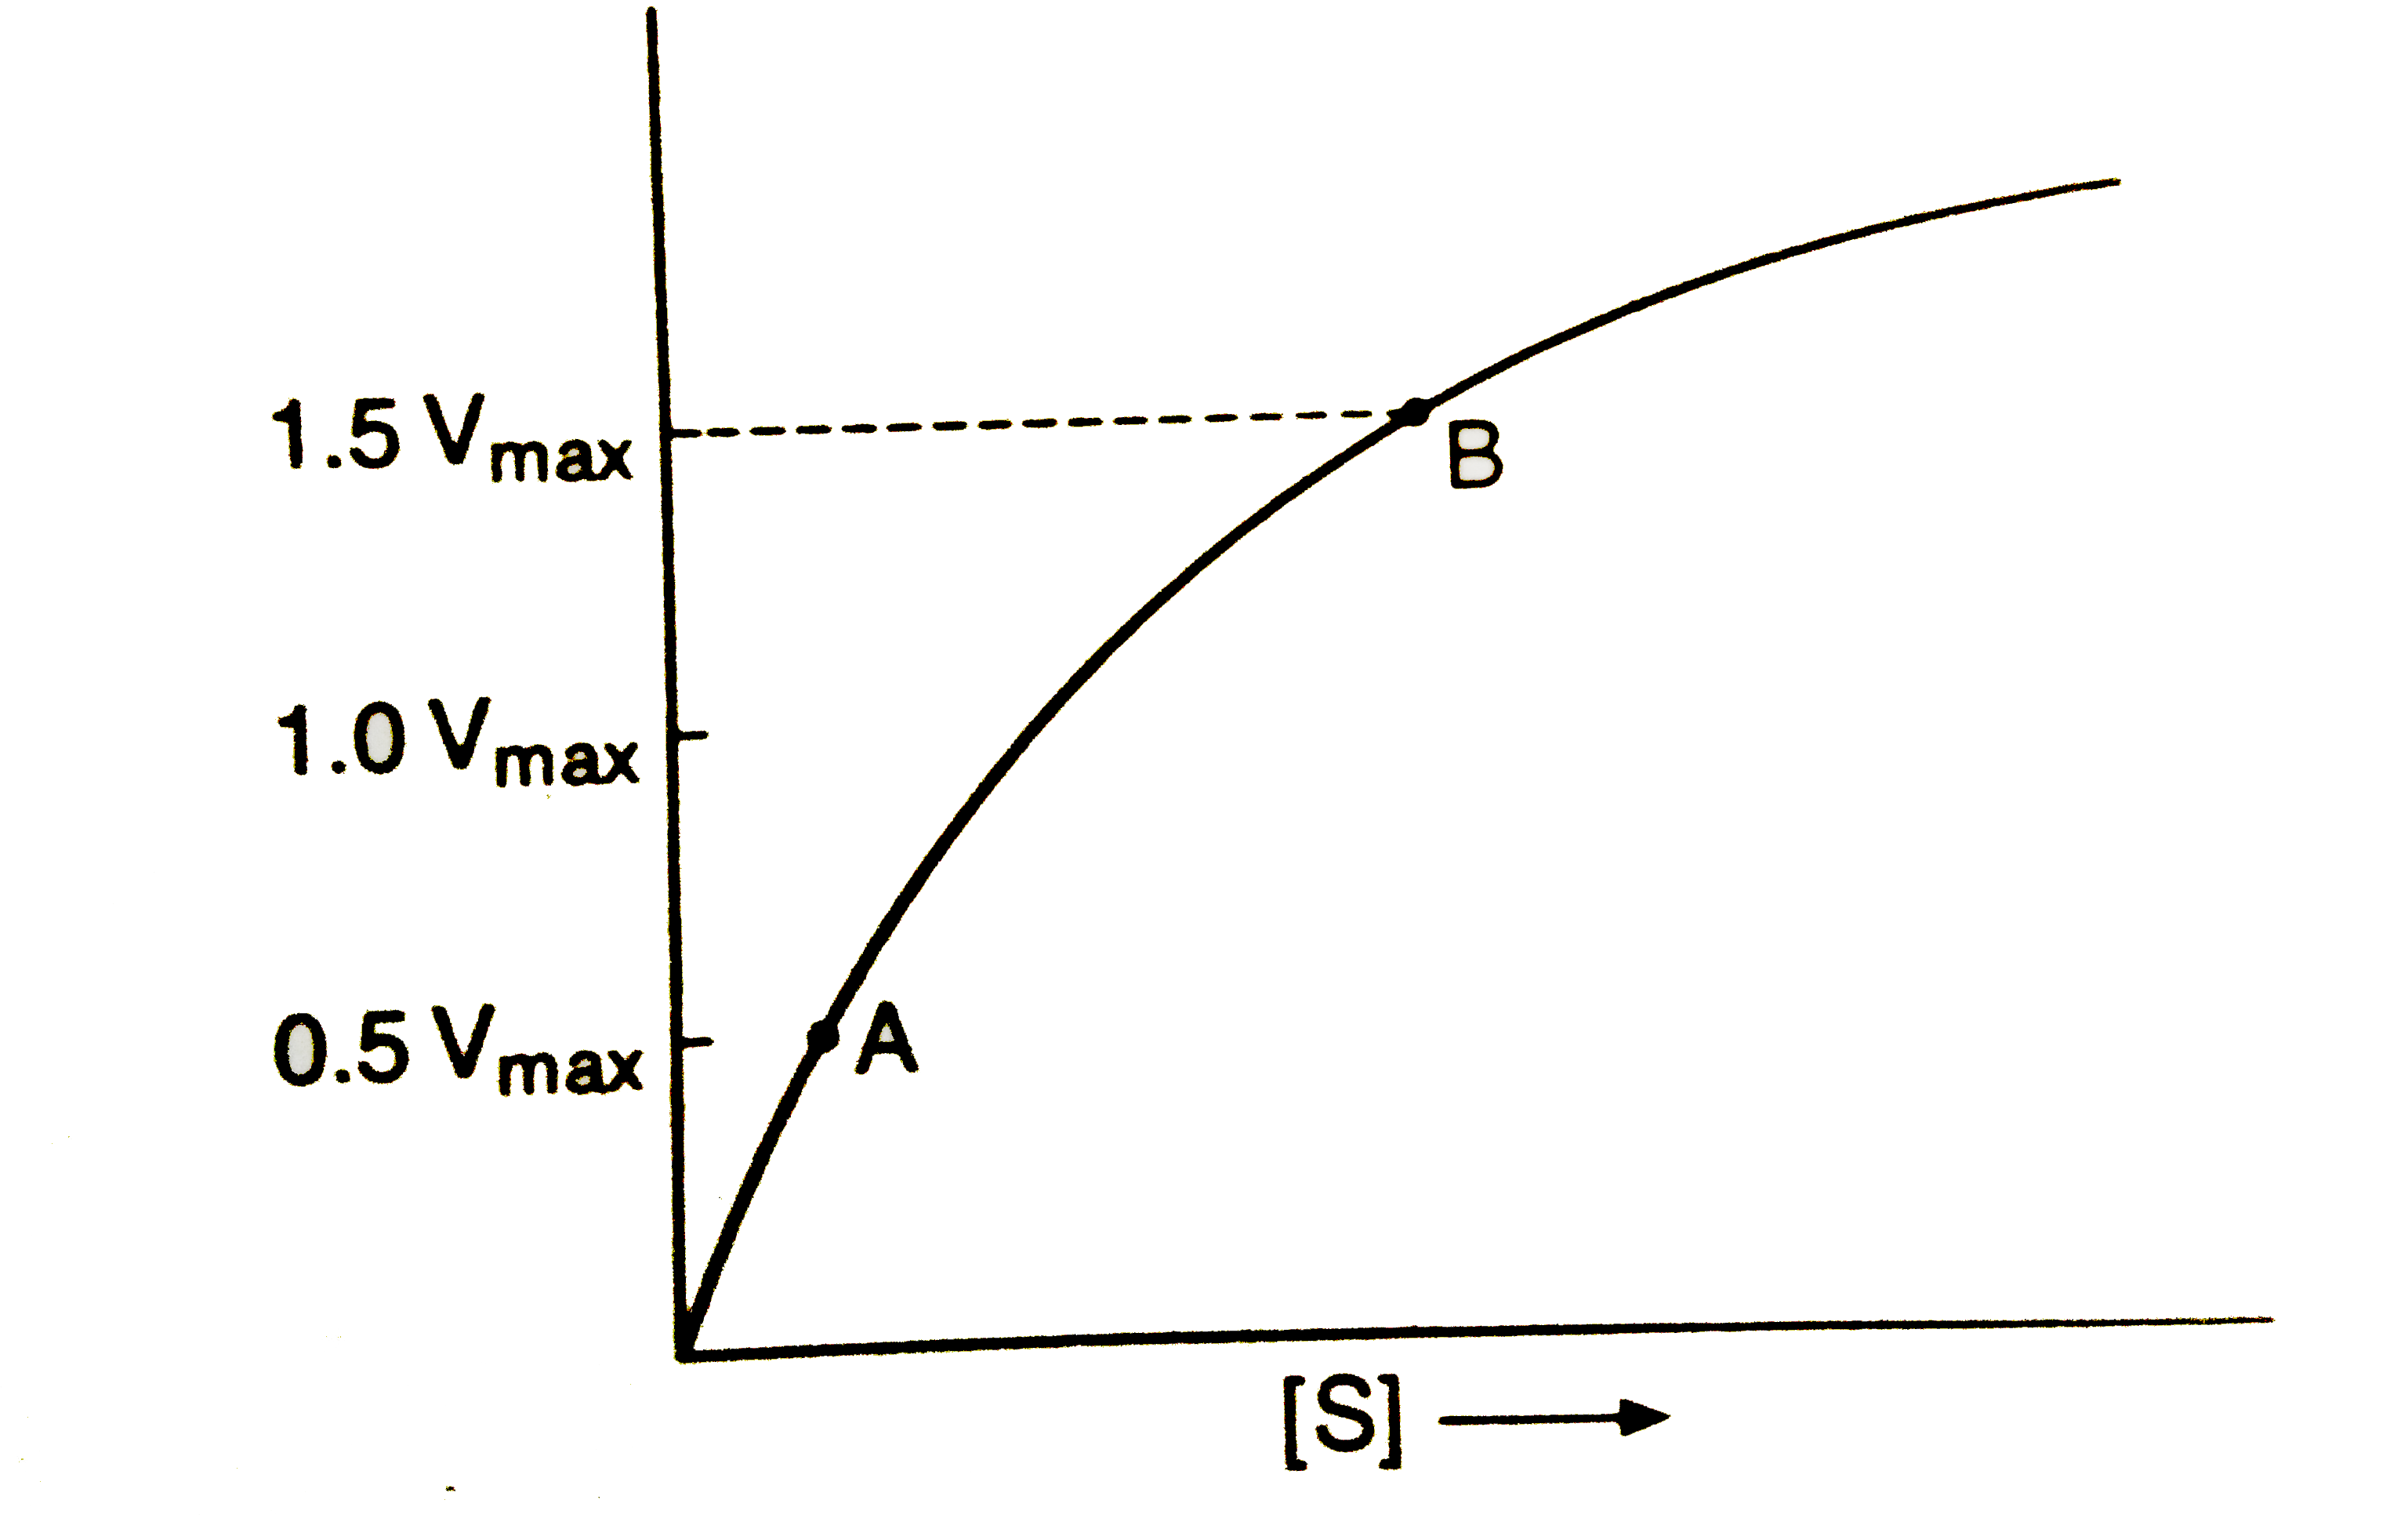
The order of reaction at point A is :A1B2C0D3At optimum temperature and pH, time required to reach maximum velocity of a reaction is 8 seconds, then what will be the time when substrate concentration is Km ?
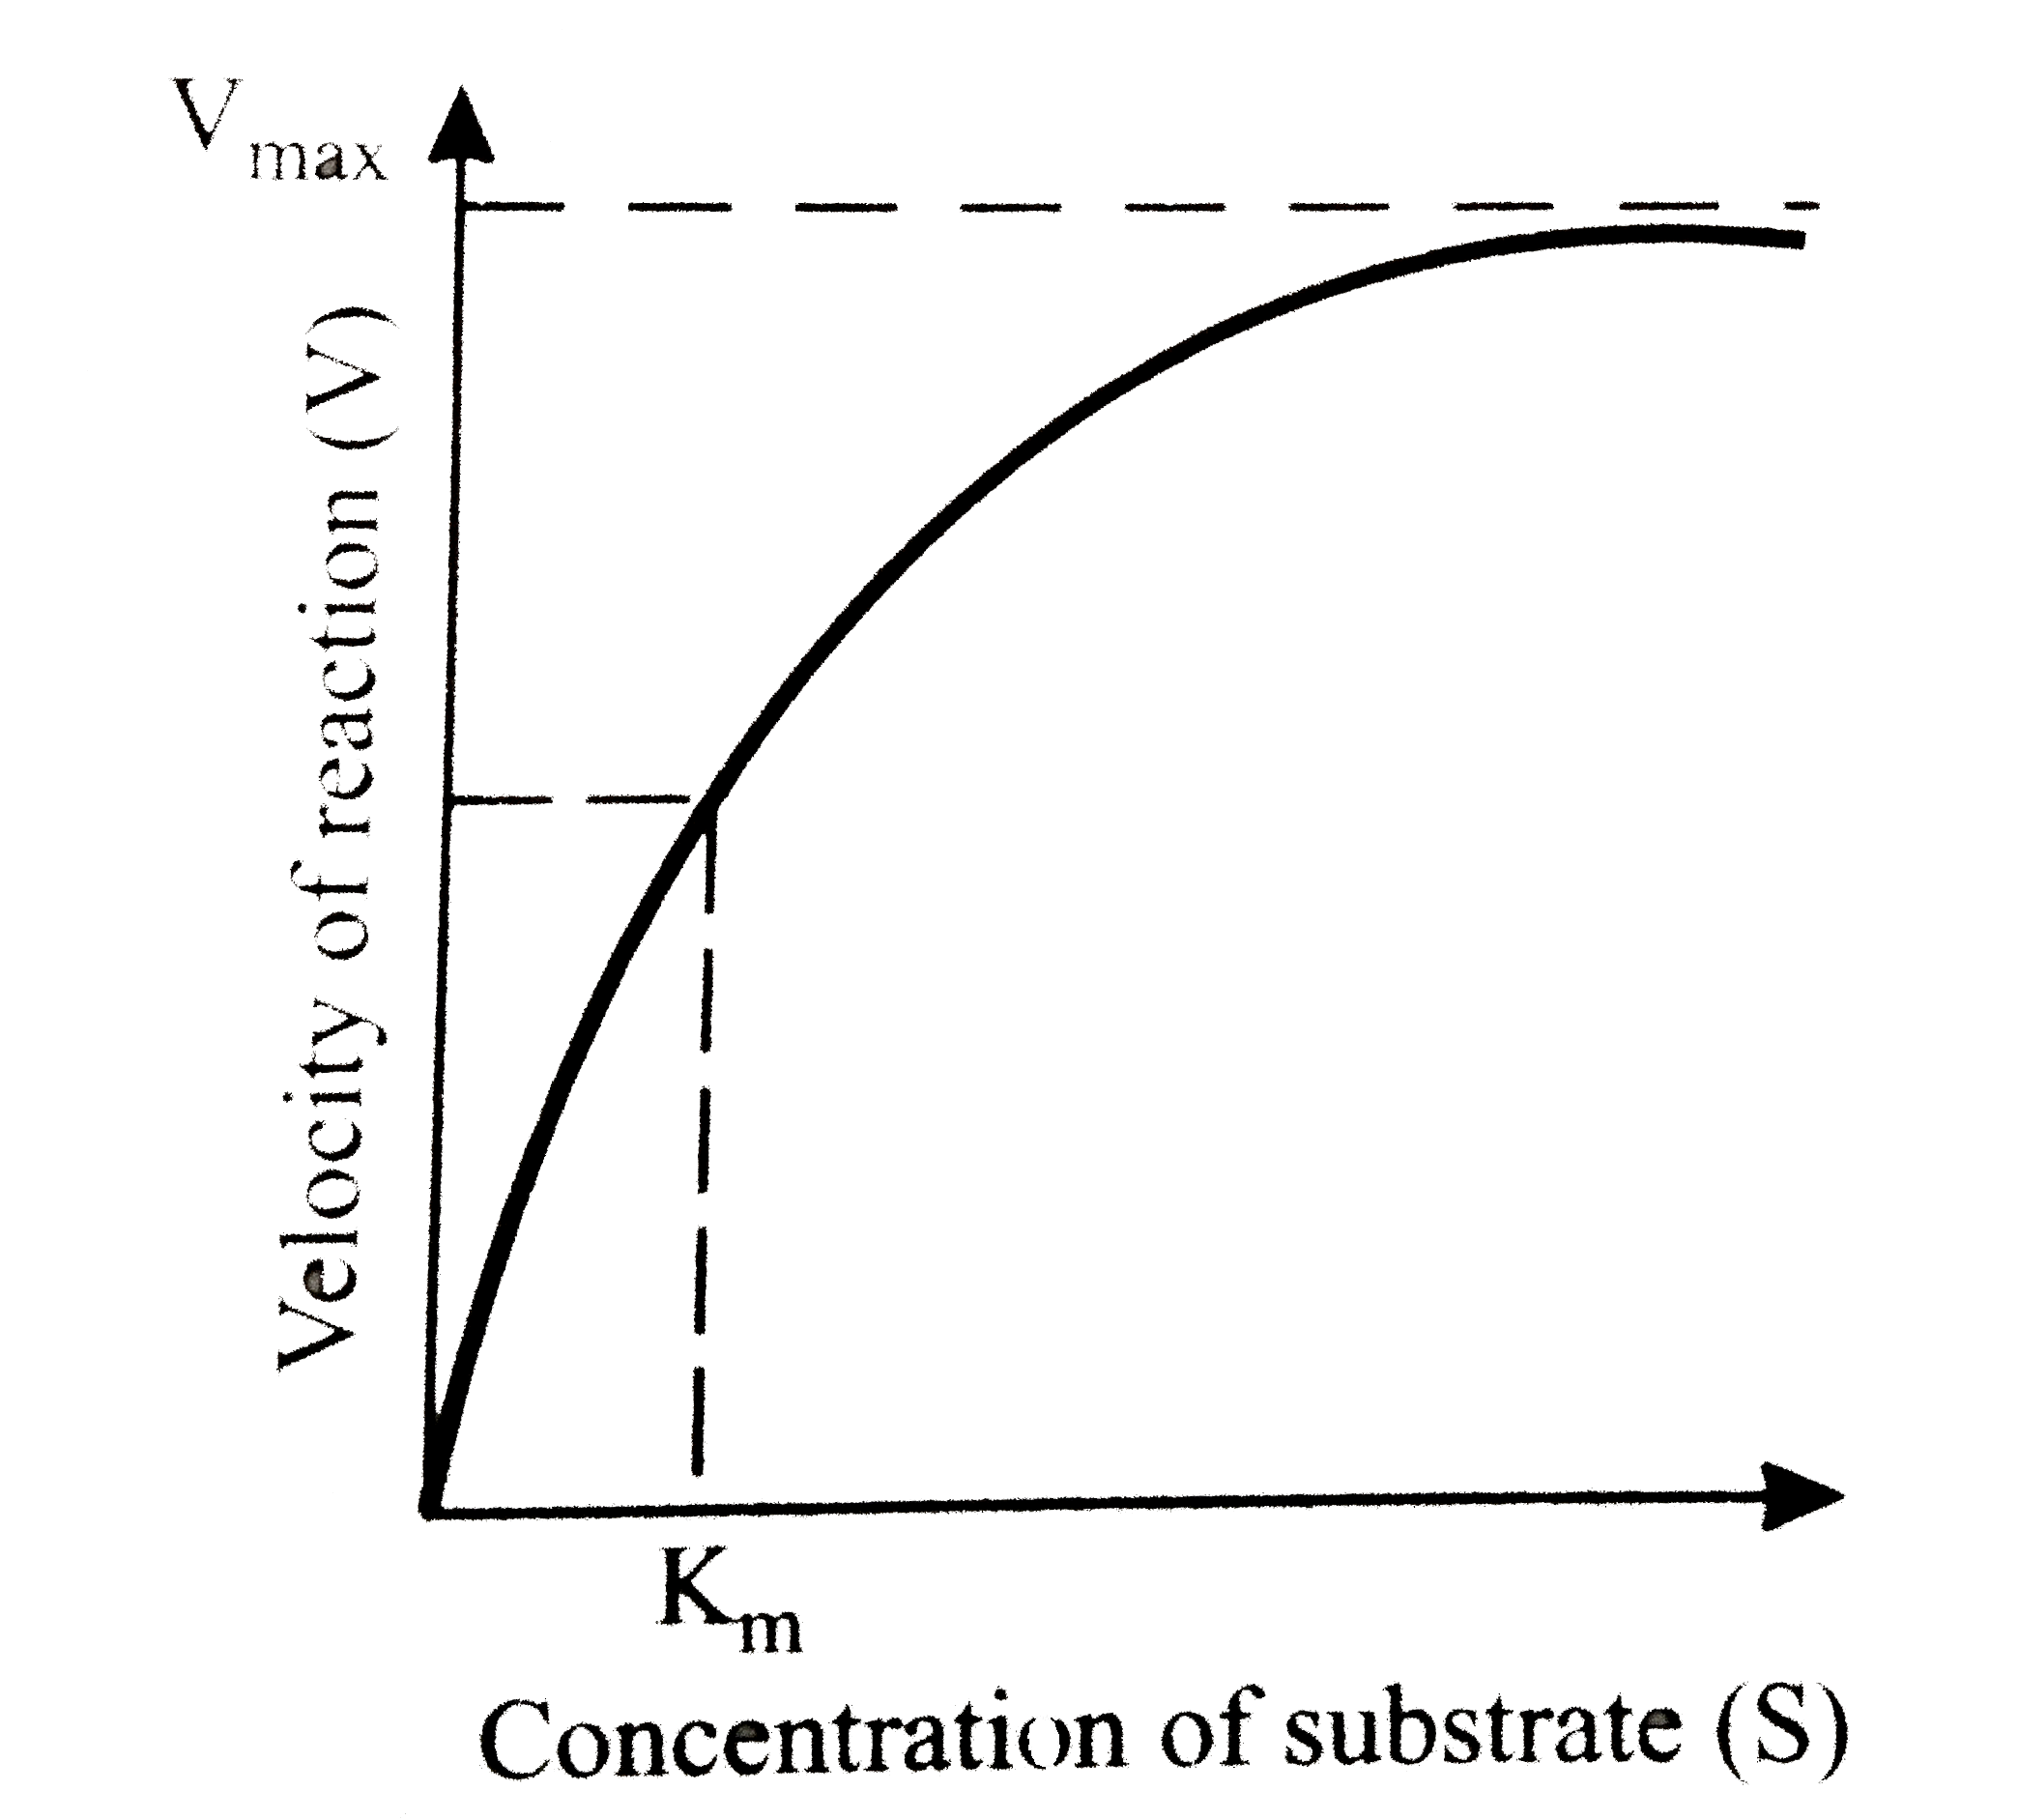 A4 secB16 secC1 secD2 sec
The given graph shows the effect of substrate concentration on the rate of reaction of the enzyme green-gram-phosphatase What does the graph indicate?
AThe rate of enzyme reaction is directly proportional to the substrate concentrationBPresence ofan enzyme inhibitor in the reaction mixtureCFormation of an enzyme-substrate complexDat higher substrate concentration the pH increases.
Explain the effect of substrate concentration on enzyme activity
View SolutionThe given graph shows the effect of substrate concentration on the rate of reaction of the enzymes green gram-phosphatase. What does the graph indicate ?
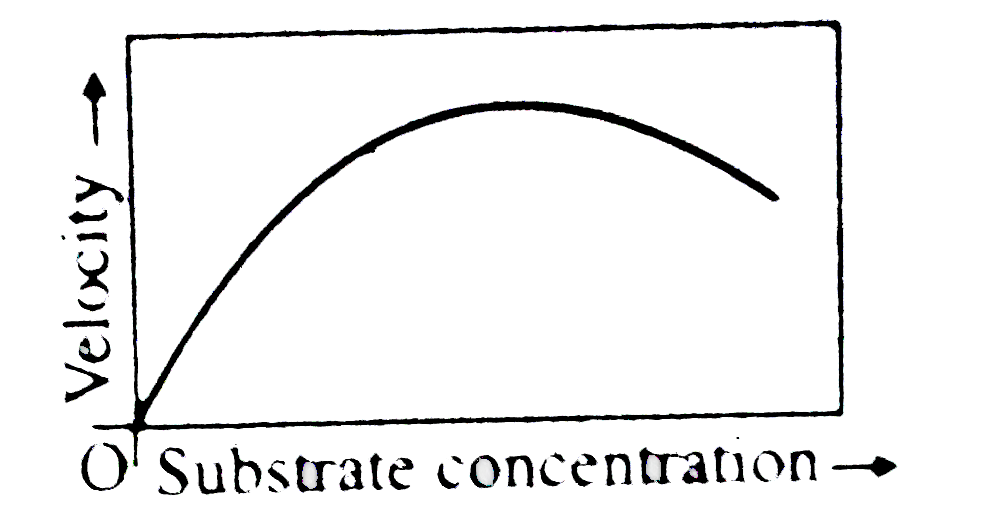
View SolutionThe given graph shows the effect of substrate concentration on the rate of reaction of the enzyme green gram-phosphatase

What dose the graph indicate
View Solutionthe graph given in Fig.9.36 shows the effect of substrate concentration on the rate of reaction of the enzyme green-gram -phosphatase . What does the graph indicates ?
View SolutionEnergy relesed from enzymes-substrate interaction is
View Solution
