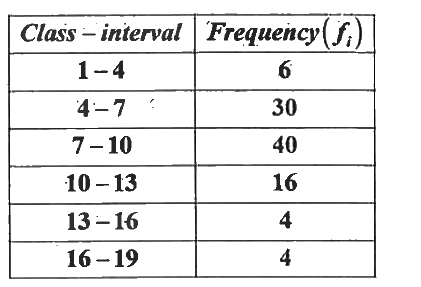
Calculate the median of the following frequency distribution tabel :
 Solution in Kannada
The correct Answer is:Median =8.05
(OR)
52
Step by step video & text solution for Calculate the median of the following frequency distribution tabel : by Maths experts to help you in doubts & scoring excellent marks in Class 10 exams.
Updated on:21/07/2023Topper's Solved these Questions
- ARITHMETIC PROGRESSIONSBOOK - CPC CAMBRIDGE PUBLICATIONCHAPTER - ARITHMETIC PROGRESSIONSEXERCISE - EXERCISE 1.2
13 Videos
- ARITHMETIC PROGRESSIONSBOOK - CPC CAMBRIDGE PUBLICATIONCHAPTER - ARITHMETIC PROGRESSIONSEXERCISE - EXERCISE 1.3
27 Videos
- CIRCLES BOOK - CPC CAMBRIDGE PUBLICATIONCHAPTER - CIRCLES EXERCISE - EXERCISE 4.2
13 Videos
Similar Questions
Fill in the blanks in the following table , given that a is the first term, d the common difference and an the nth term of the A.P:
(i) a=7,d=3,n=8,an=?
(ii) a=−18,n=10,an=0,d=?
0=−18+(10−1)d⇒10d−d=18
9d=18⇒d=189=2
d=2
(iii) a=?,d=−3,n=18,an=−5
(iv) a=−18.9,d=2.5,n=?,an=3.6
View SolutionHow many multiples of 4 lie between 10 and 250 ?
View SolutionFrom a point Q ,the length of the tangent to a circle is 24 cm and the distance of Q from the centre is 25 cm . The radius of the circle is
View SolutionMatch the following lists:

View SolutionHow many lines of symmetry does the above figure have ?
View SolutionWhich of the following are correct chain isomers of butane ? (i)
View SolutionDetermine the point of symmetry of a regular hexagon.
View SolutionDtermine the images of the following figure about the given line :
View SolutionMatch the following Column A to Column B

View SolutionMatch the following Column A to Column B

View SolutionMatch the following Column A to Column B

View SolutionCalculate the volume of the given solid.
ltimg src="https://d10lpgp6xz60nq.cloudfront.net/physics_images/PS_MATH_VII_C06_E03_002_Q01.png" width="80%"gt
View SolutionThe inequation represented by the graph given below is :
View SolutionThe inequation that best describes the graph given below is _________
View SolutionThe inequation that best describes the following graph is _________
View SolutionWhich inequations represent the shaded region in the given figure
View Solution
