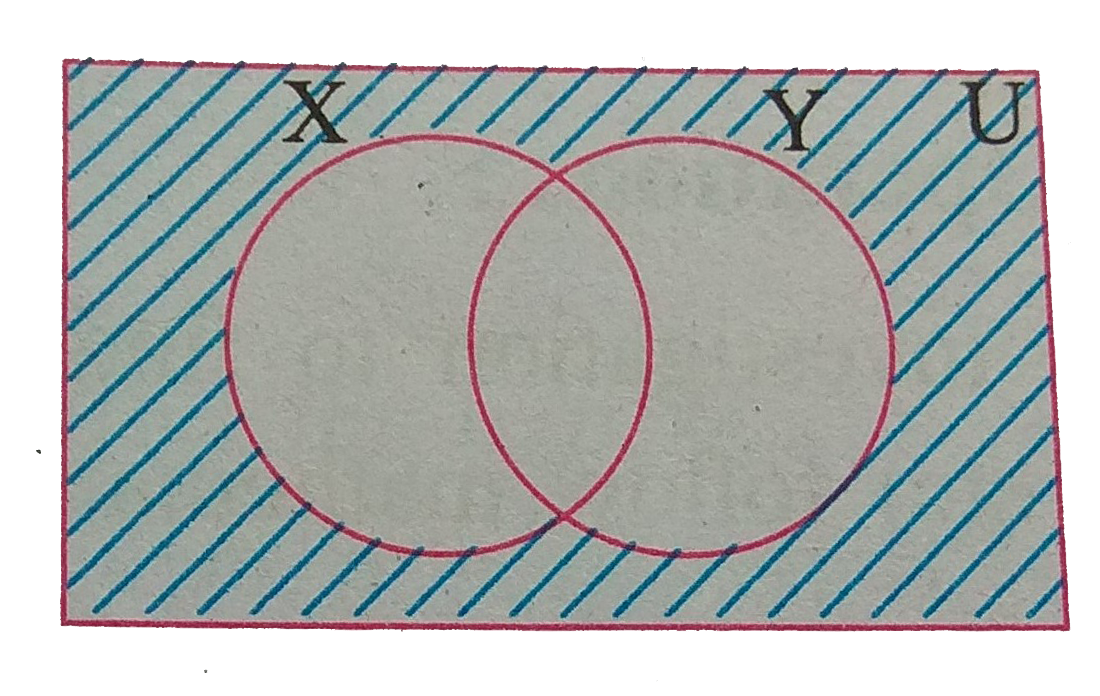
Using the set symbols, write down the expressions for the shaded region in the following
 Solution in Tamil
Step by step video & image solution for Using the set symbols, write down the expressions for the shaded region in the following by Maths experts to help you in doubts & scoring excellent marks in Class 9 exams.
Updated on:21/07/2023Topper's Solved these Questions
- SET LANGUAGEBOOK - SURA PUBLICATIONCHAPTER - SET LANGUAGEEXERCISE - EXERCISE 1.4
12 Videos
- SET LANGUAGEBOOK - SURA PUBLICATIONCHAPTER - SET LANGUAGEEXERCISE - EXERCISE 1.5
19 Videos
- SET LANGUAGEBOOK - SURA PUBLICATIONCHAPTER - SET LANGUAGEEXERCISE - EXERCISE 1.2
47 Videos
- REAL NUMBERS BOOK - SURA PUBLICATIONCHAPTER - REAL NUMBERS EXERCISE - UNIT TEST
19 Videos
- STATISTICSBOOK - SURA PUBLICATIONCHAPTER - STATISTICSEXERCISE - Section -C
2 Videos
Similar Questions
If P = {1, 2, 5, 7, 9}, Q = {2, 3, 5, 9, 11}, R = {3, 4, 5, 7, 9} and S = {2, 3, 4, 5, 8}, then find
(P∪Q)∪R
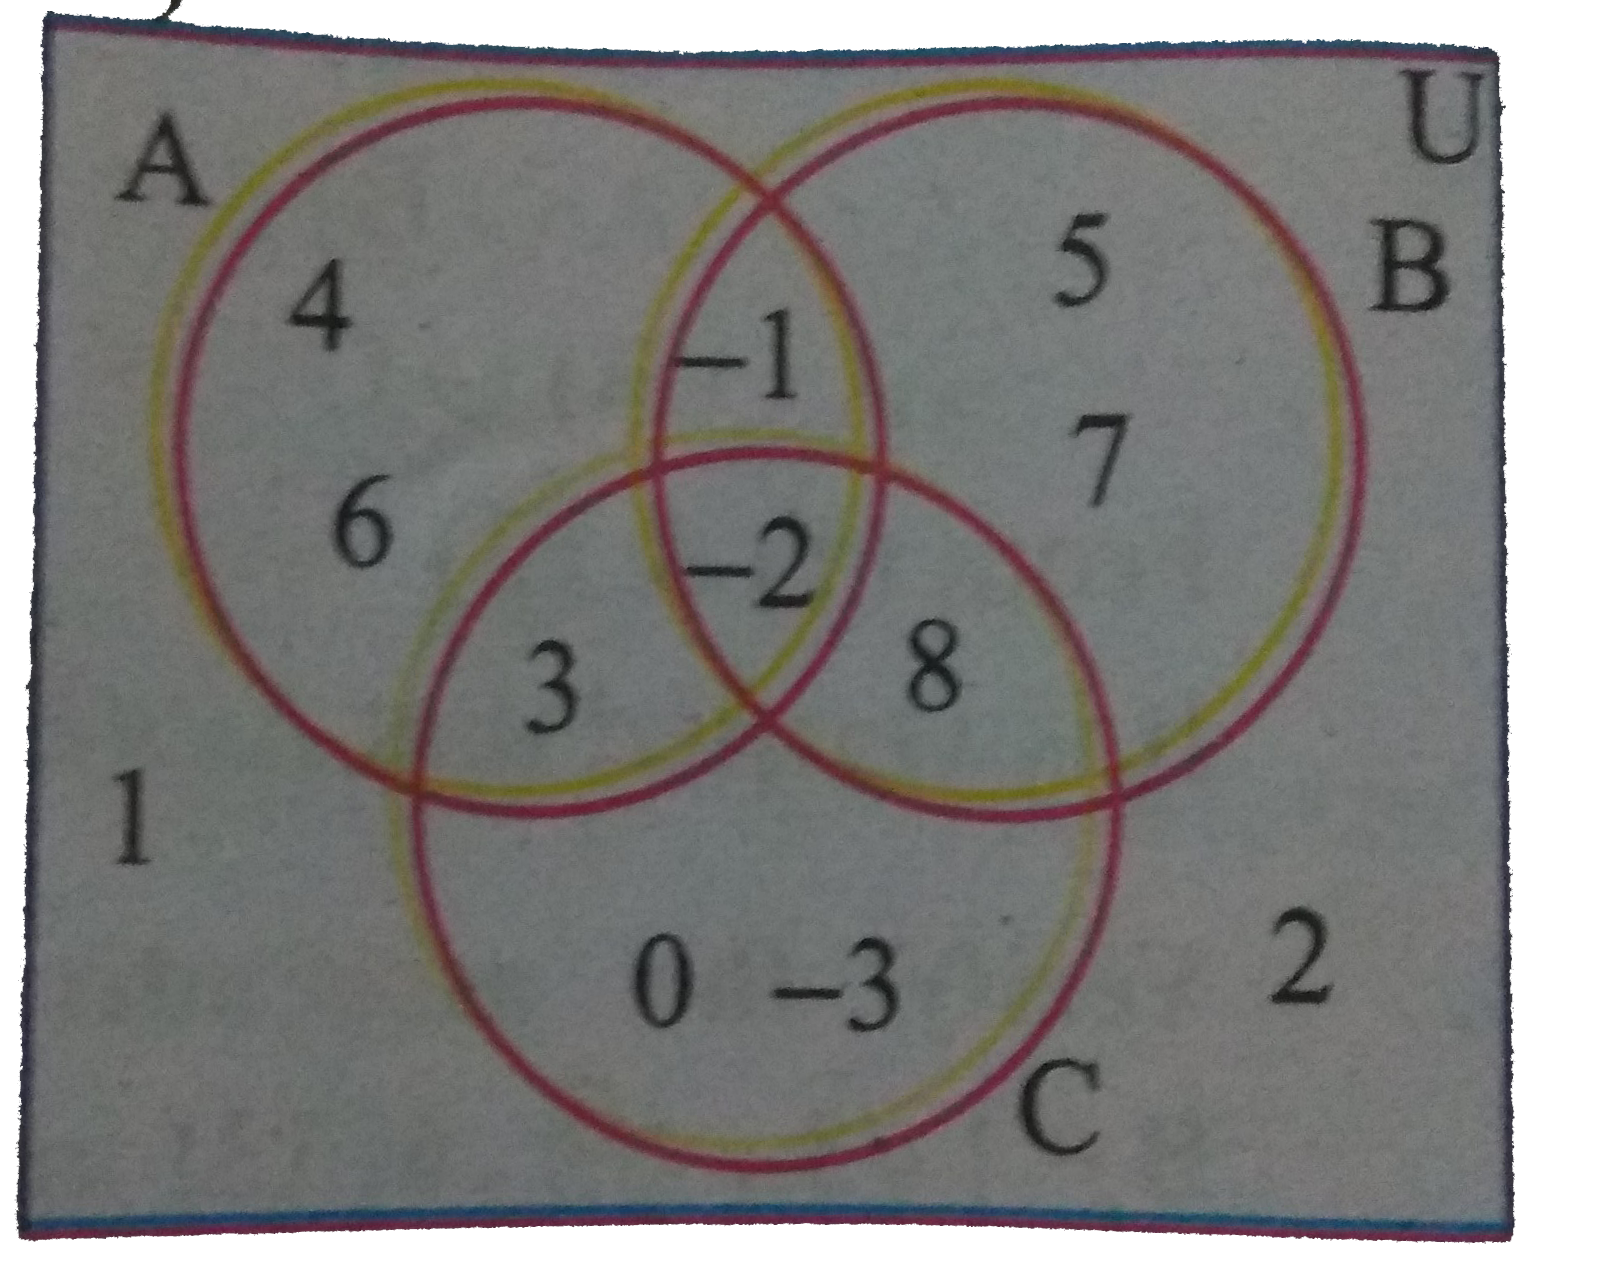
View SolutionUsing the adjacent venn diagram, find the following sets :

(i) A - B
(ii) B - C
(iii) A'∪B'
(iv) A'∩B'
(v) (B∪C)'
(vi) A−(B∪C)
(vii) A−(B∩C)
View SolutionFind the cardinal number of the following sets.
M = {p, q, r, s, t, u}
View SolutionWhich one of the following , regarding sum of two irrational number , is true ?
View SolutionCalculate the mean of the following distribution using Assumed Mean Method.

View SolutionHow many lines of symmetry does the above figure have ?
View SolutionWhich of the following are correct chain isomers of butane ? (i)
View SolutionDetermine the point of symmetry of a regular hexagon.
View SolutionDtermine the images of the following figure about the given line :
View SolutionFind the area of the shaded region, given that the radius of each circle is equal to 5 cm.
View SolutionMatch the following Column A to Column B

View SolutionMatch the following Column A to Column B

View SolutionMatch the following Column A to Column B

View SolutionThe area of the shaded part in the figure given below is ______.

View SolutionThe inequation represented by the graph given below is :
View SolutionThe inequation that best describes the graph given below is _________
View Solution
