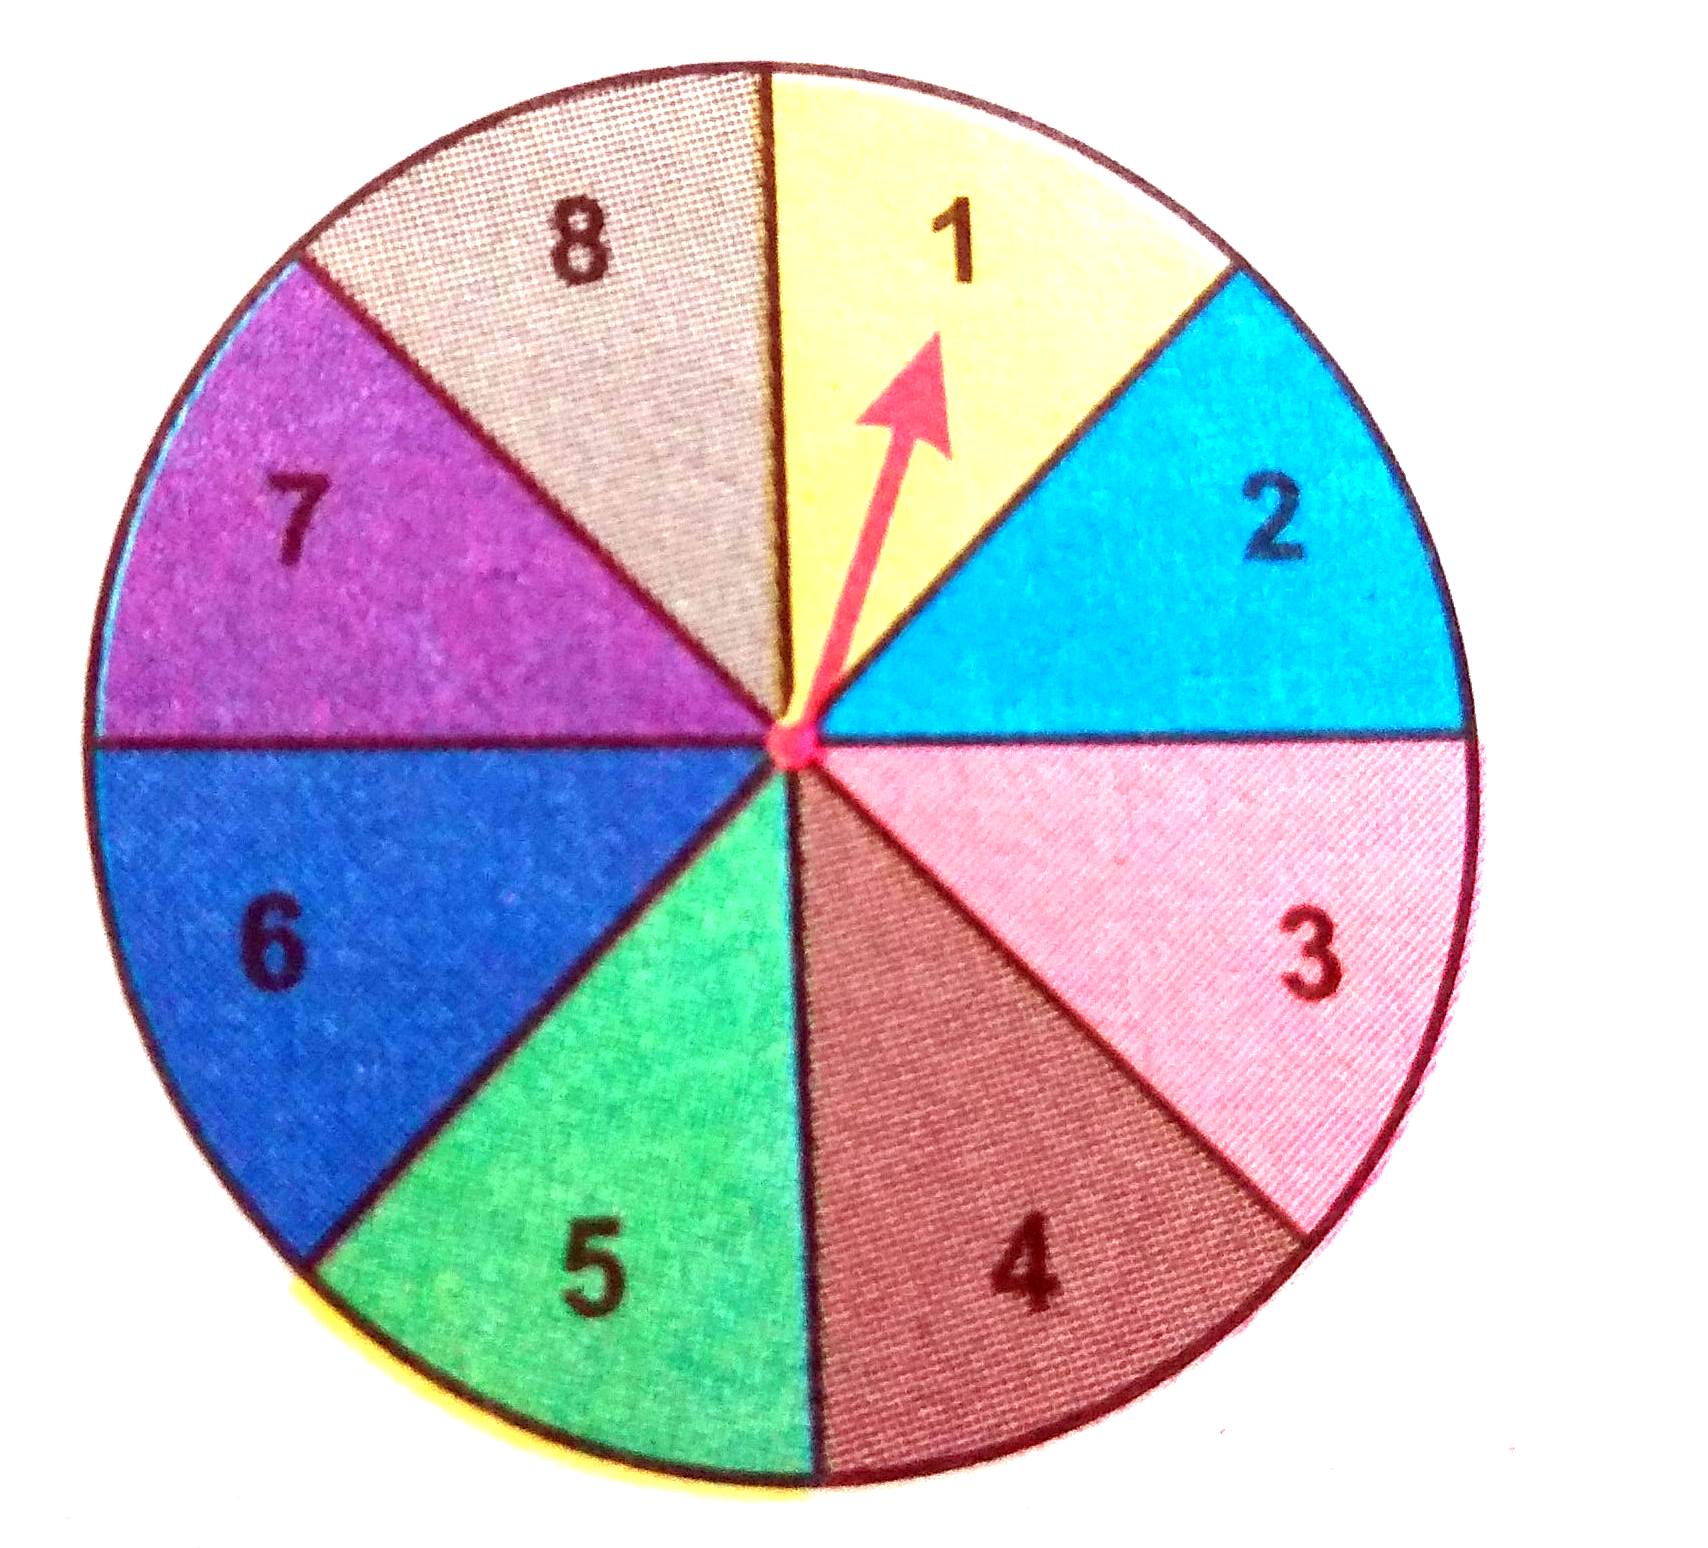
What is the probability that the spinner will not land on a multiple of 3 ?
 Solution in Tamil
The correct Answer is:34
Step by step video, text & image solution for What is the probability that the spinner will not land on a multiple of 3 ? by Maths experts to help you in doubts & scoring excellent marks in Class 9 exams.
Updated on:21/07/2023Topper's Solved these Questions
- PROBABILITYBook:SURA PUBLICATIONChapter:PROBABILITYExercise:Unit test (part - B)
Explore 4 Videos
- PROBABILITYBook:SURA PUBLICATIONChapter:PROBABILITYExercise:Additional Questions and Answers (Exercise 9 . 2)
Explore 5 Videos
- MENSURATIONBook:SURA PUBLICATIONChapter:MENSURATIONExercise:UNIT TEST
Explore 10 Videos
- REAL NUMBERS Book:SURA PUBLICATIONChapter:REAL NUMBERS Exercise:UNIT TEST
Explore 19 Videos
Similar Questions
In a survey of 400 youngsters aged 16-20 years, it was found that 191 have their voter ID card. If a youngster is seceted at random, find the probability that the youngster does not have their voter ID card
View SolutionTickets numbered from 1 to 20 are mixed up together and then a ticket is drawn at random. What is the probability that the ticket has a number which is a multiple of 3 or 7 ?
View SolutionUsing Heron's formula, find the area of a triangle whose sides are
10 cm, 24 cm, 26 cm
View SolutionWhich one of the following , regarding sum of two irrational number , is true ?
View SolutionIdentify the cell organelle 'A' :-
ltimg src="https://d10lpgp6xz60nq.cloudfront.net/physics_images/ALN_BIO_C10_E08_018_Q01.png" width="80%"gt
View SolutionHow many lines of symmetry does the above figure have ?
View SolutionWhich of the following are correct chain isomers of butane ? (i)
View SolutionDetermine the point of symmetry of a regular hexagon.
View SolutionDtermine the images of the following figure about the given line :
View SolutionMatch the following Column A to Column B

View SolutionMatch the following Column A to Column B

View SolutionMatch the following Column A to Column B

View SolutionThe inequation represented by the graph given below is :
View SolutionThe inequation that best describes the graph given below is _________
View SolutionThe inequation that best describes the following graph is _________
View SolutionWhich inequations represent the shaded region in the given figure
View Solution