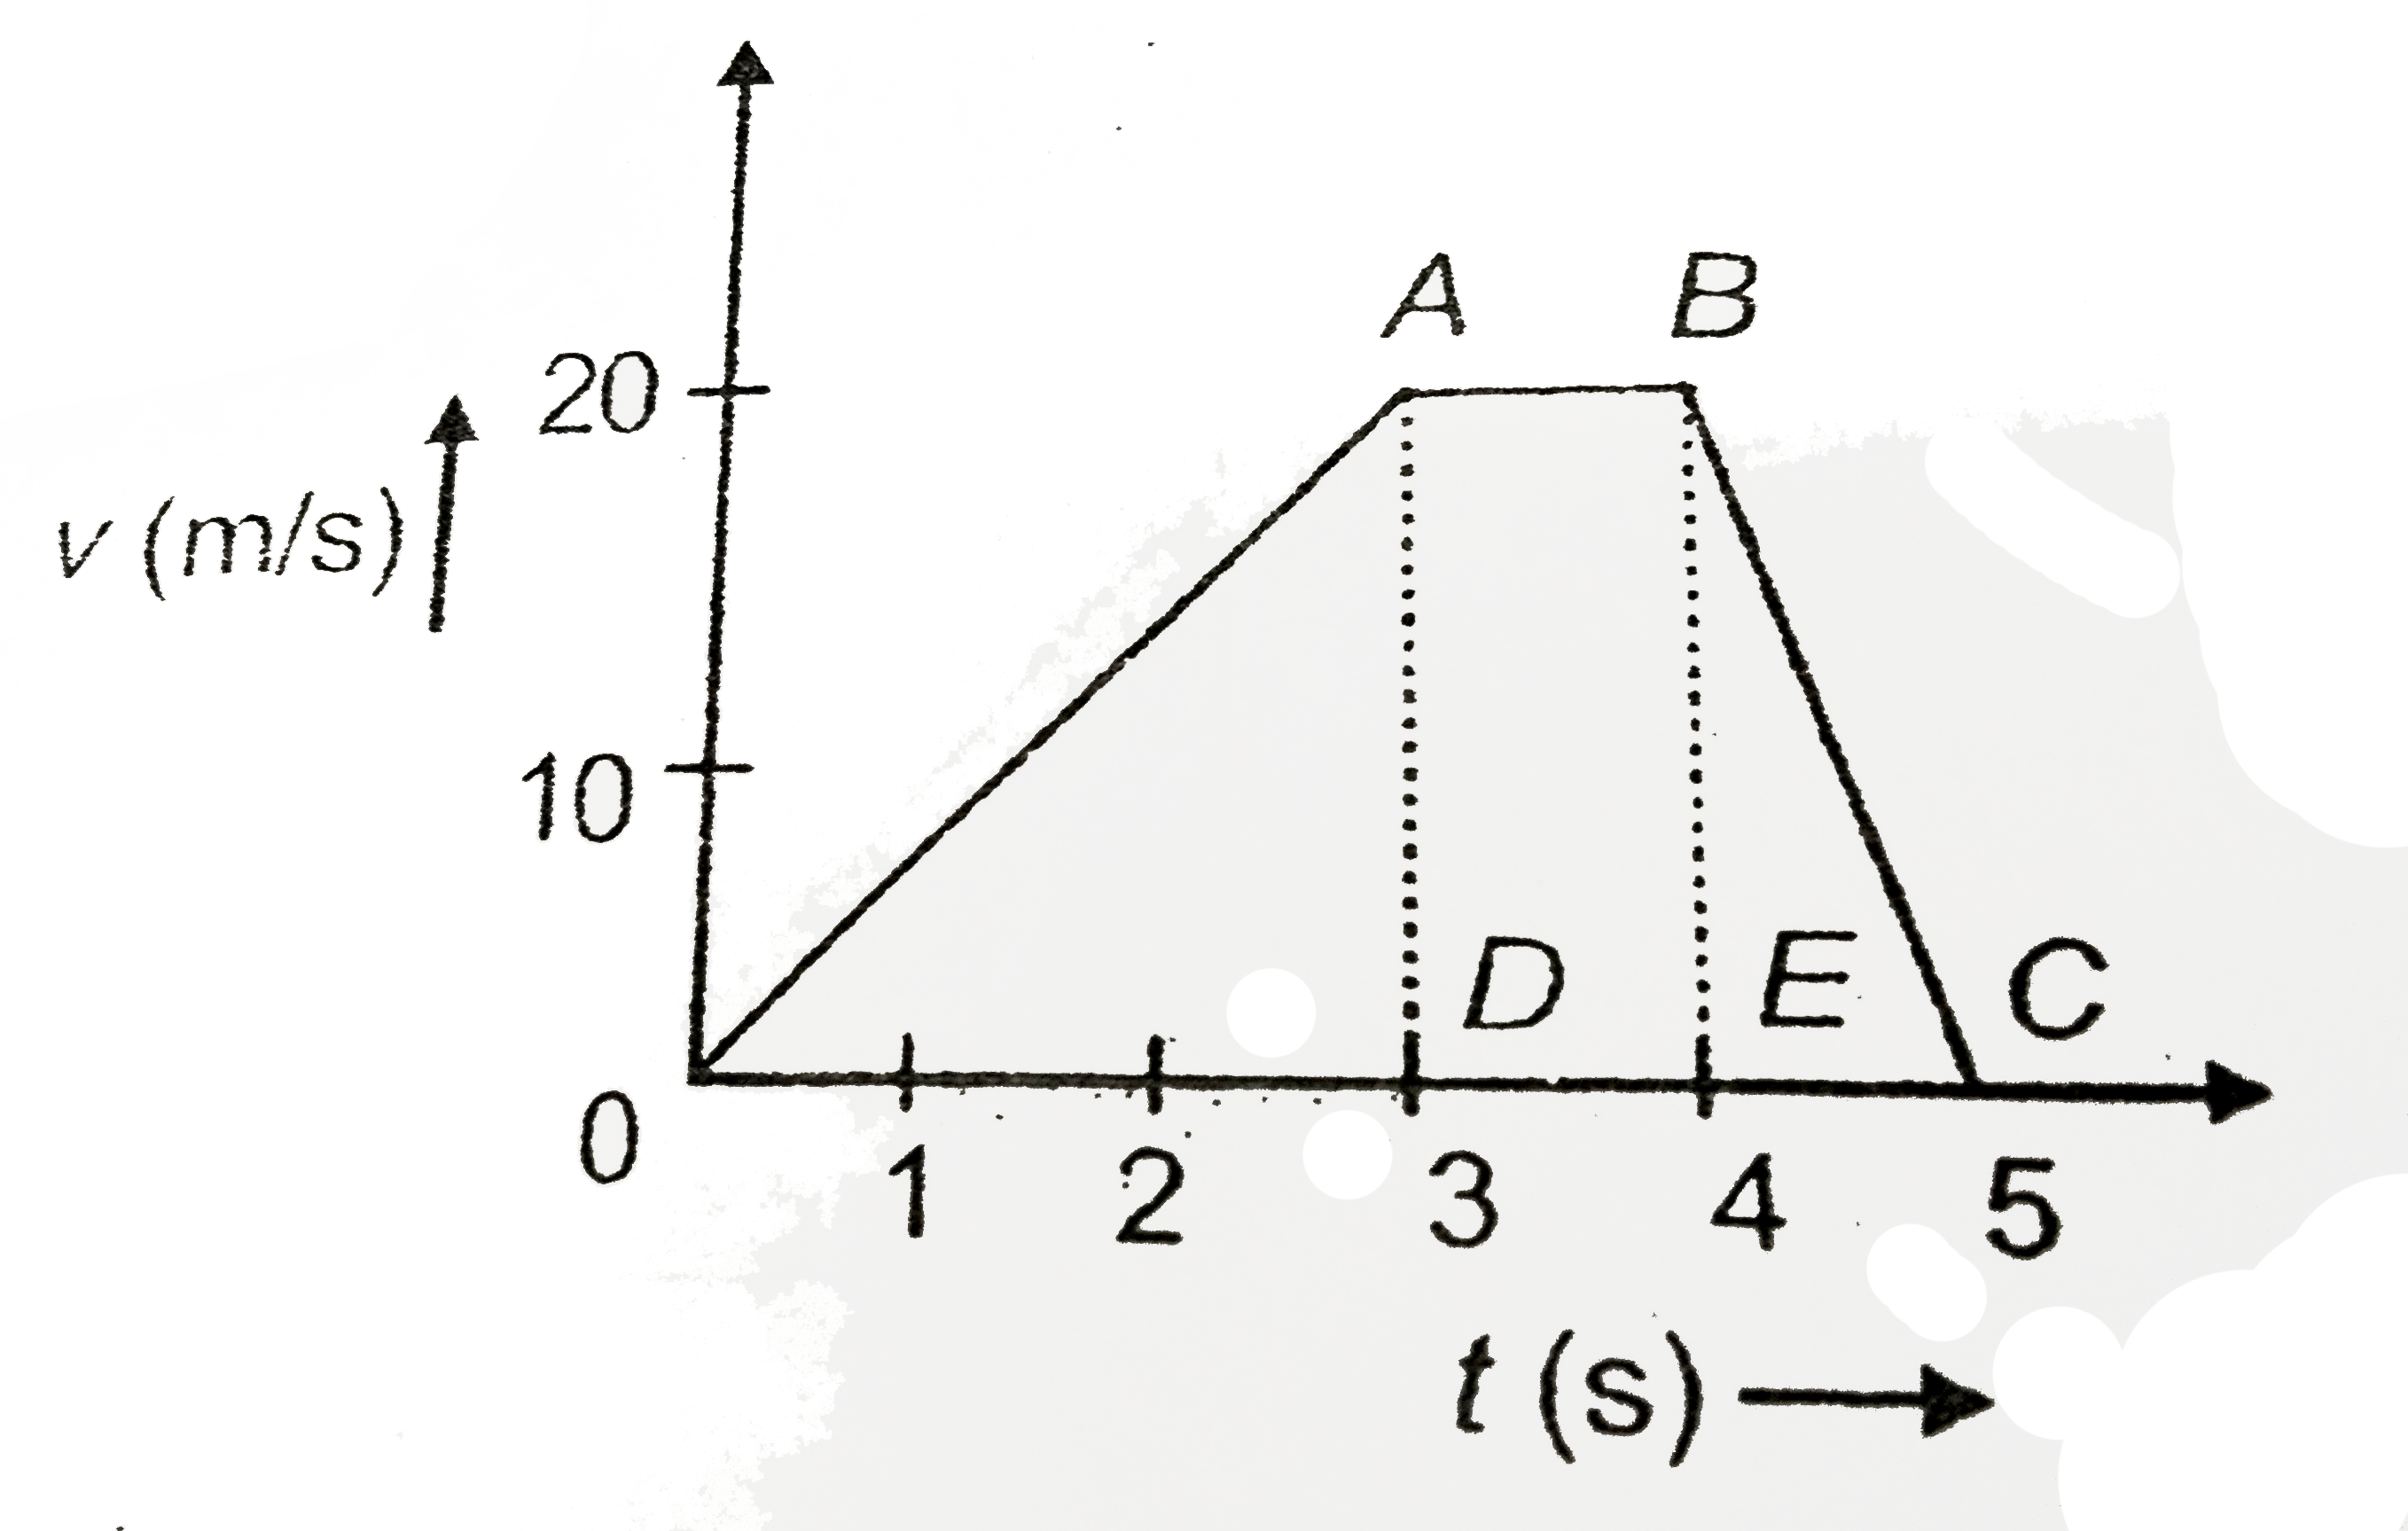
The velocity - time graph of a particle moving along a straight line is shown in the figure given below
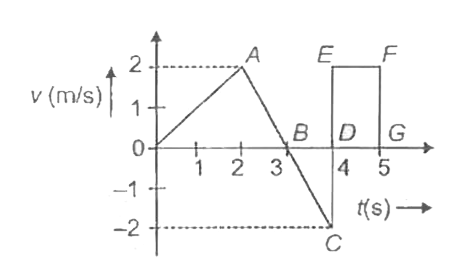
The displacement of the particle in 5 second is
0.5 m
1 m
2 m
4 m
The correct Answer is:D
Step by step video, text & image solution for The velocity - time graph of a particle moving along a straight line is shown in the figure given below The displacement of the particle in 5 second is by Physics experts to help you in doubts & scoring excellent marks in Class 12 exams.
Updated on:21/07/2023Topper's Solved these Questions
- MOTION IN A STRAIGHT LINEBook:AAKASH INSTITUTEChapter:MOTION IN A STRAIGHT LINEExercise:ASSIGNMENT (SECTION - A)
Explore 60 Videos
- MOTION IN A STRAIGHT LINEBook:AAKASH INSTITUTEChapter:MOTION IN A STRAIGHT LINEExercise:ASSIGNMENT (SECTION - B)
Explore 33 Videos
- MOTION IN A STRAIGHT LINEBook:AAKASH INSTITUTEChapter:MOTION IN A STRAIGHT LINEExercise:TRY YOURSELF
Explore 40 Videos
- MOTION IN A PLANEBook:AAKASH INSTITUTEChapter:MOTION IN A PLANEExercise:Assignement section -J (Aakash Challengers Questions)
Explore 4 Videos
- MOTION IN STRAIGHT LINEBook:AAKASH INSTITUTEChapter:MOTION IN STRAIGHT LINEExercise:Assignment (SECTION - J)
Explore 2 Videos
Similar Questions
Knowledge Check
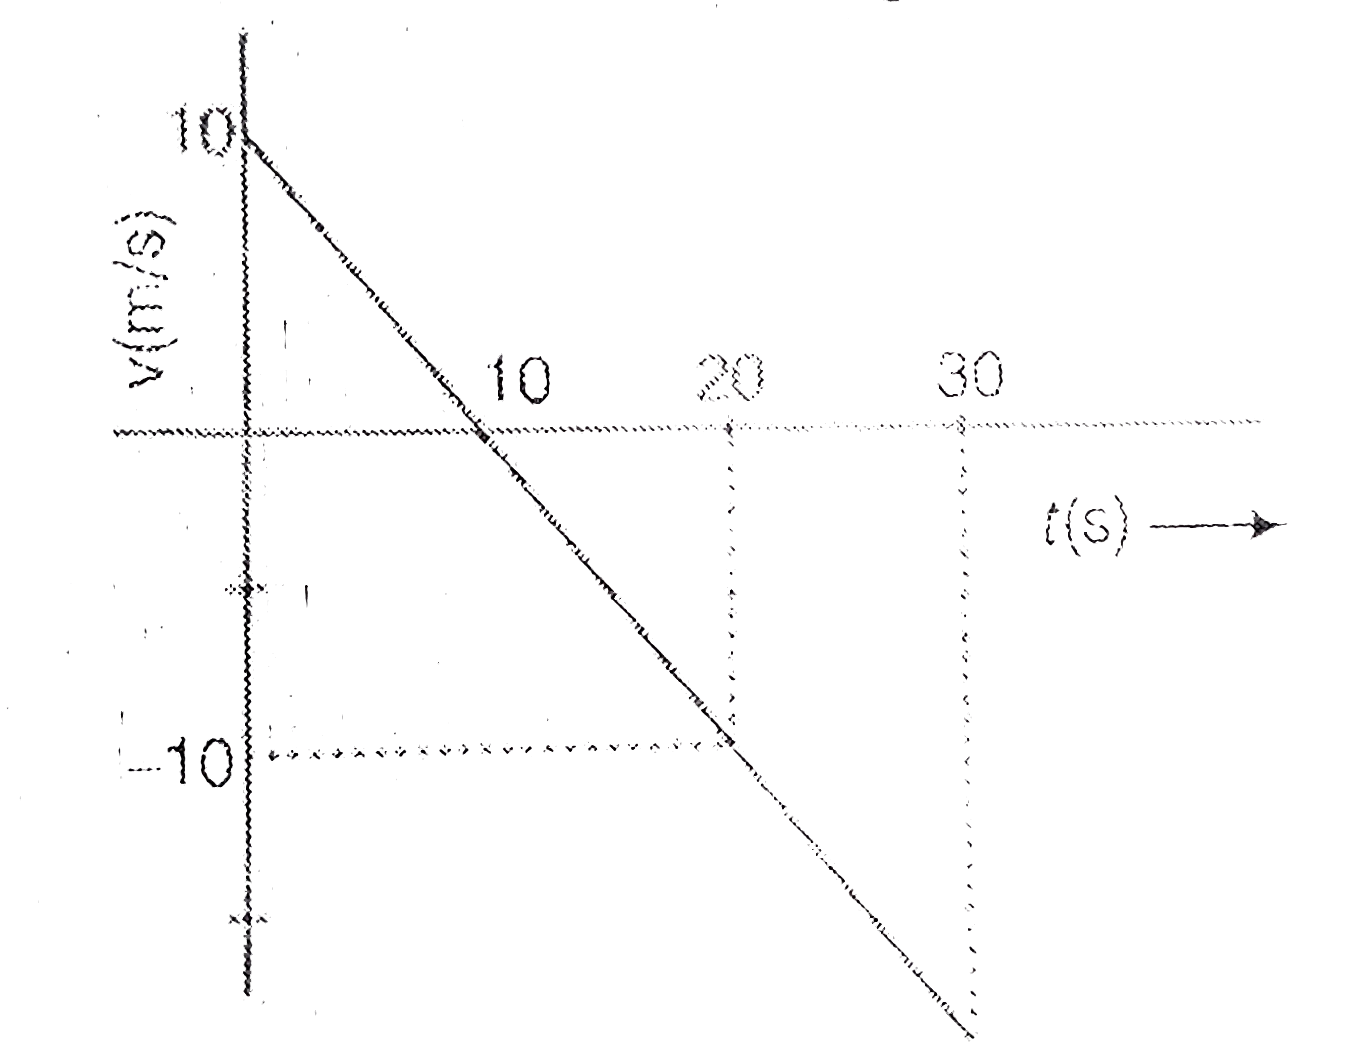
The velocity- time plot for a particle moving on a straight line is shown in the figure
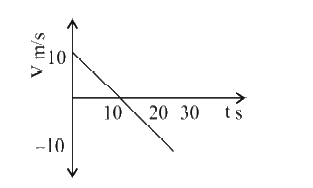 Athe particle has a non uniform accelerationBthe particle has never turned aroundCthe particle has zero displacementDthe average speed in the interval 0 to 10 s is the same as the average speed in the interval 10 s to 20 s
The velocity-time plot for a particle moving on a straight line is shown in figure.
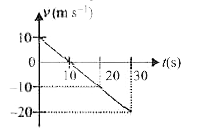 AThe particle has a constant acceleration.BThe particle has never tumed around.CThe particle has zero displacement.DThe average speed in the interval 0 to 10 s is the same as the average speed in the interval 10s to 20 s.
The velocity time plot for a particle moving on straight line is shown in the figure.
 AThe particle has a constant accelerationBThe particle has nevedr turned aroundCThe paeticle has zero displacement.DThe average speed in the interval 0 to 10 s is the same as the average speed in the interval 10 s to 20s.
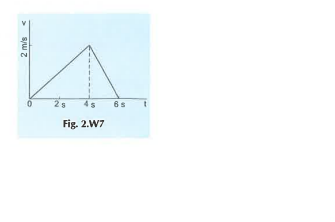
The velocity-time graph of a particle moving along a straight line is shown in Figure 2.W7.Is the motion uniform?
View SolutionDisplacement time graph of a particle moving in a straight line is a shown in figure.

View SolutionVelocity displacement graph of a particle moving in a straight line is as shown in figure.

View SolutionThe velocity-time graph of a particle moving along a straight line is given as below. The displacement time curve for the particle is given by :

View Solution
The velocity displacement graph of a particle moving along a straight line is shown in figure.
Then the acceleration displacement graph is.
View Solution
