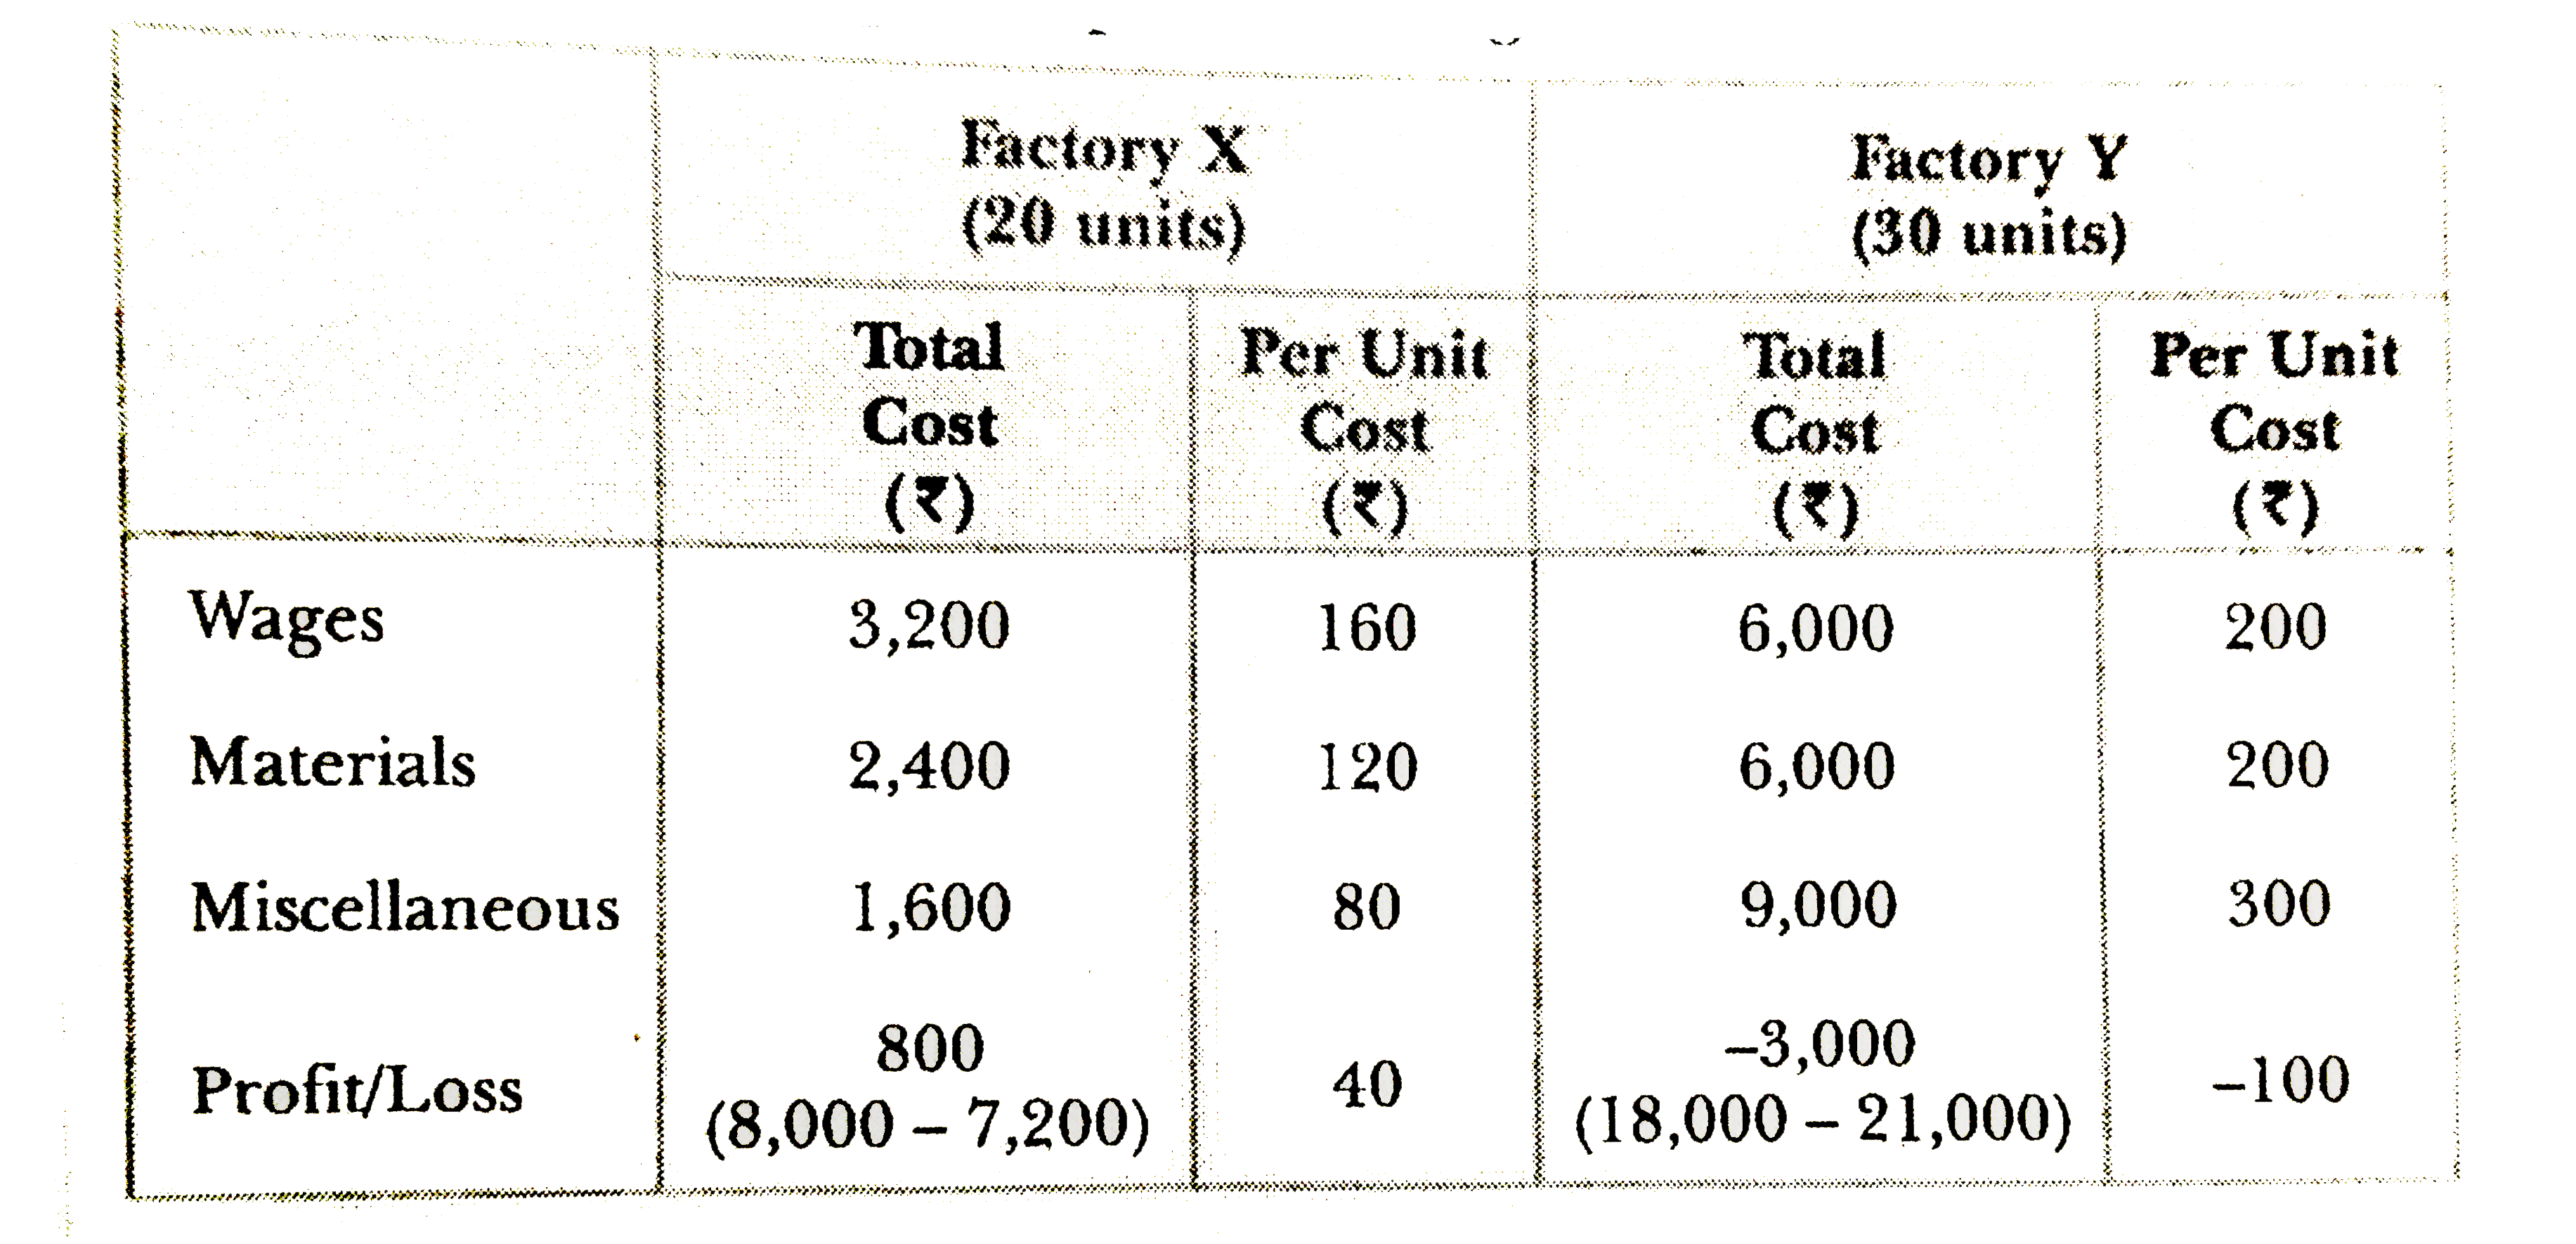
Draw a suitable diagram to represetn the following information :

Also whow the profit of loss as the case may be.
First of all shall calculate the cost (wages, materials, miscellaneous) and profit per unit as the following table :

[Note: Negative profit is regarded as loss.]
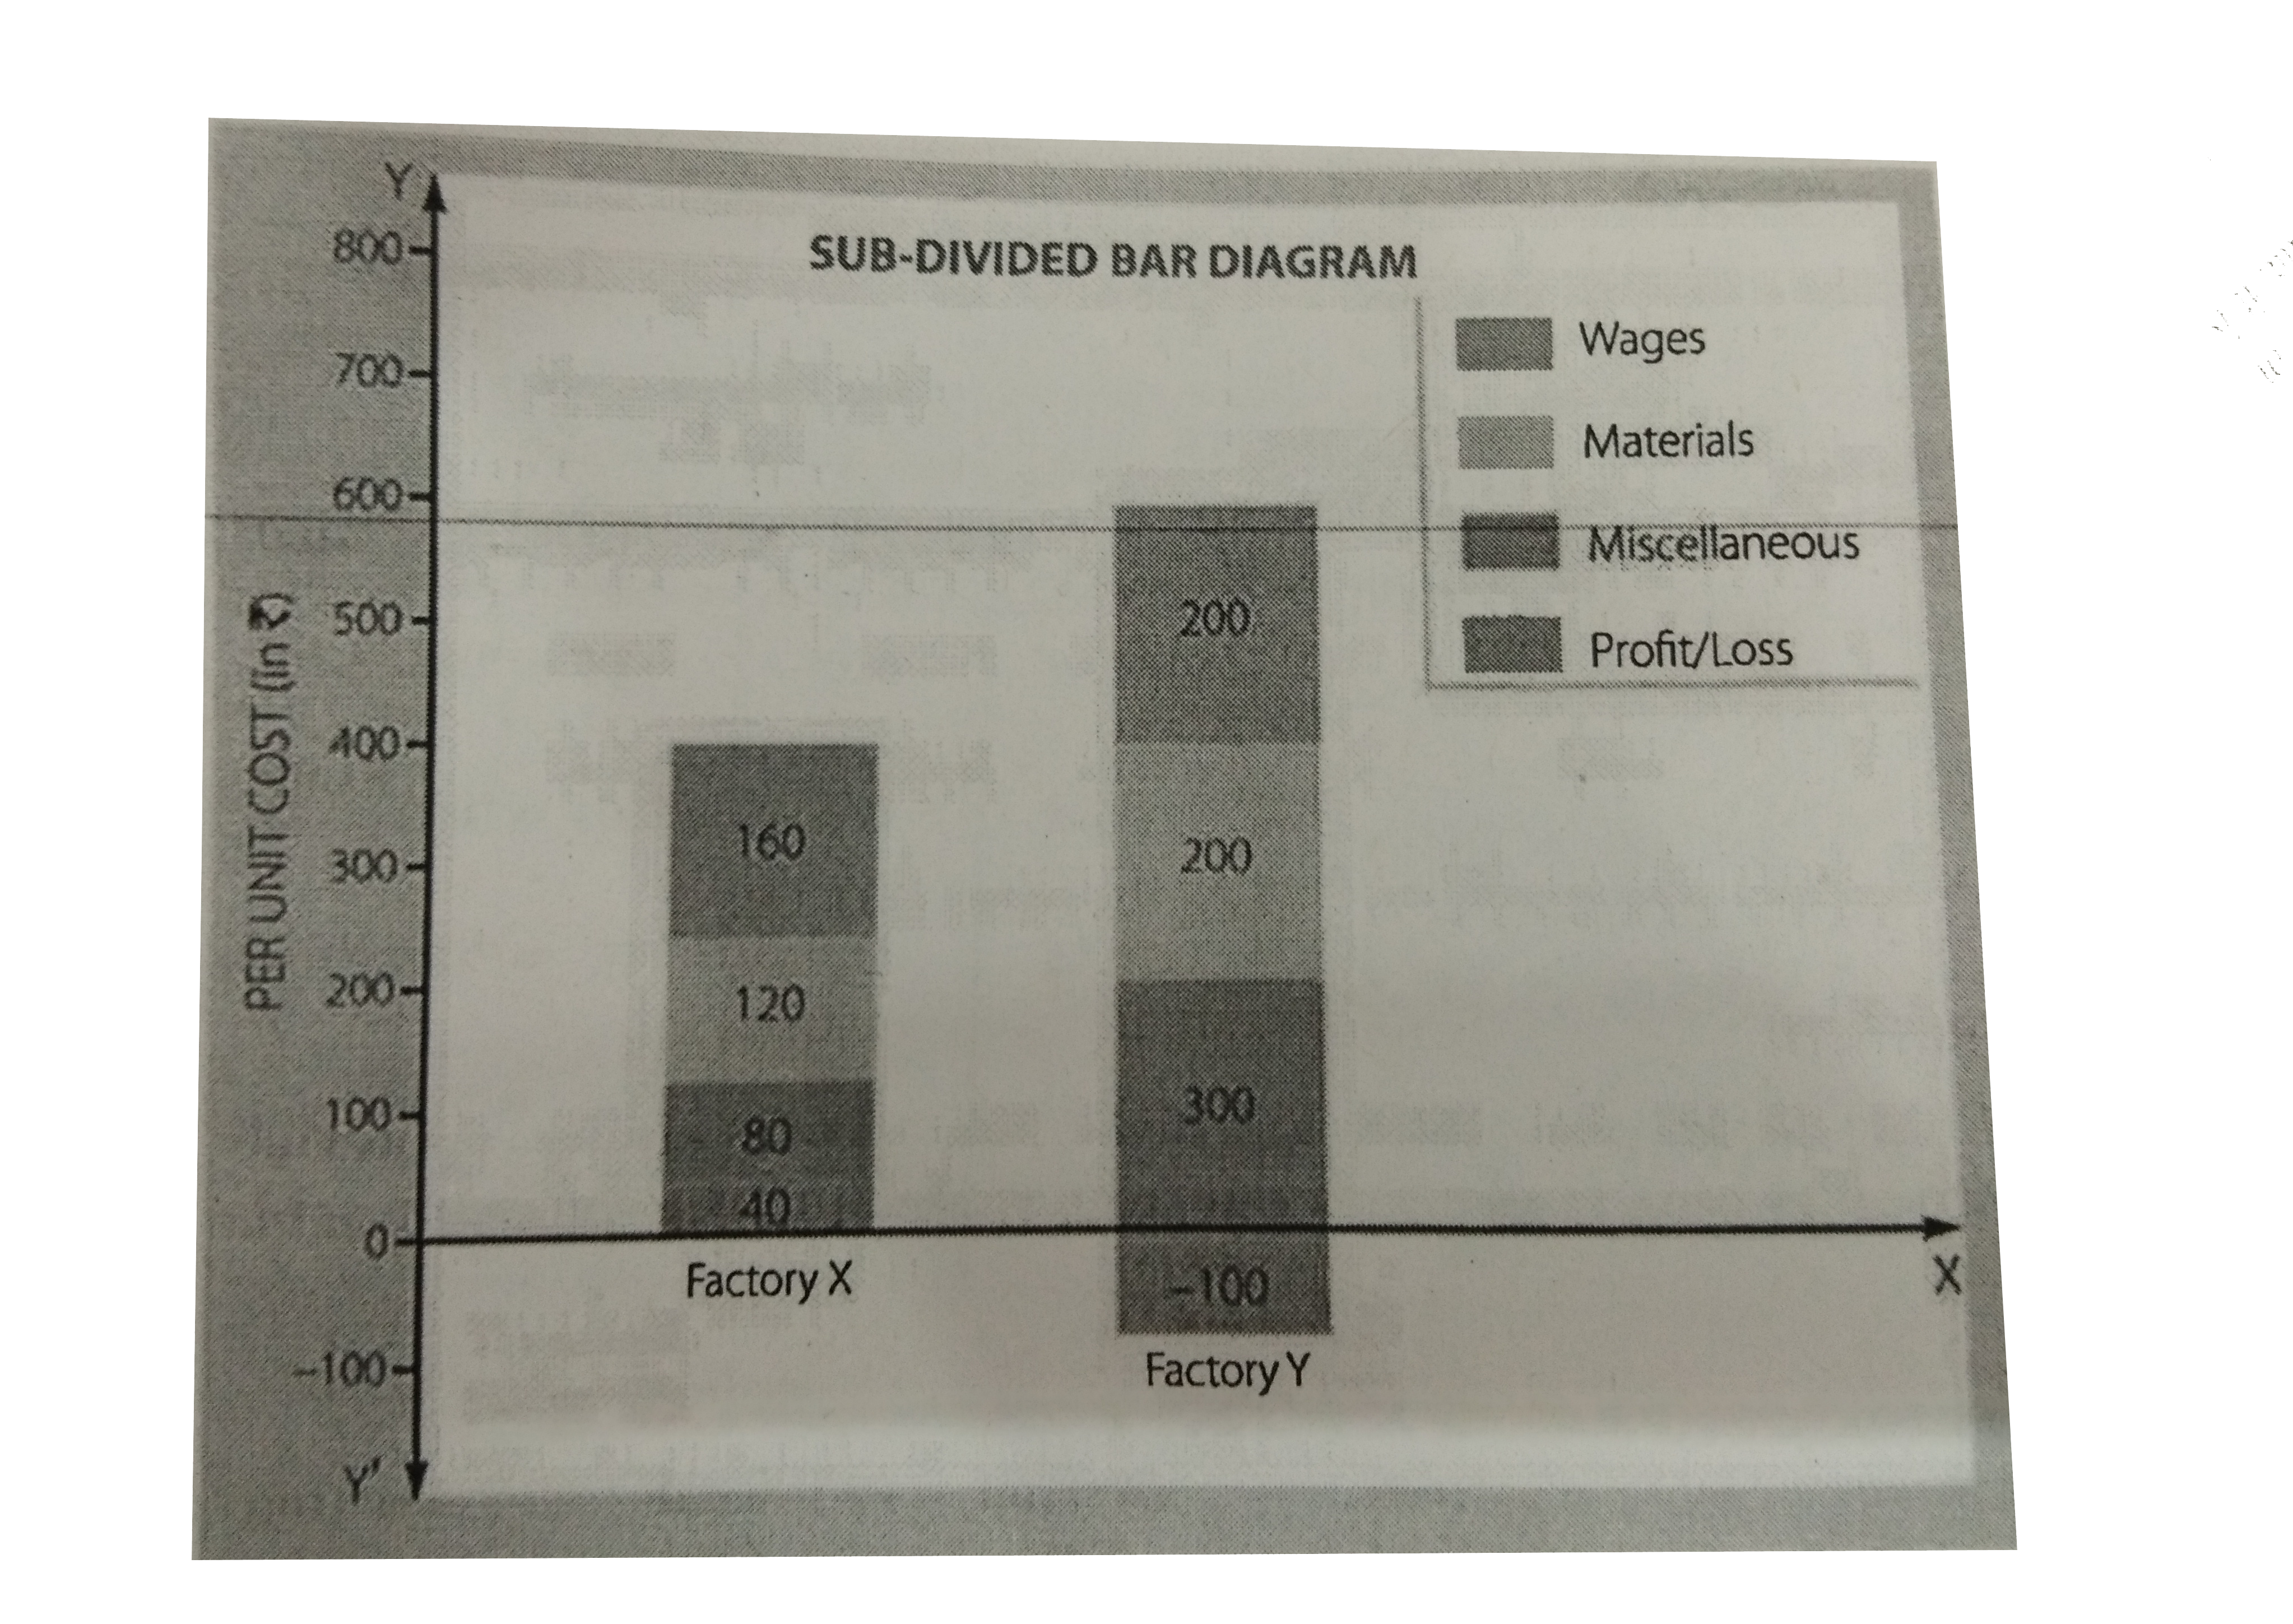
An appropriate diagram for representing this data would be the reactangles whose widths are in the ratio of the quantities sold, i.e, 20 : 30, i.e., 2 : 3. Selling prices would be represented by the corresponding heights of the rectangles with various costs (wages, materials, miscellaneous) and profit or loss represented by the various divious of the rectangles as shown in the diagram given on next page :

[Note: In case of profit , i.e., when SP > CP, the entire rectangle will lie above the X-axis, But in case of loss, i.e., when the X-axis which will reflect the loss incurred, i.e., it cannot be recoverd throught sales. ]
Similar Questions
From the following information calcualte Net profit ratio:
 View Solution
Make a suitable diagram of the following data on polulation in india:
 View Solution
From the following information calculate gross profit ratio:
 View Solution
Calculate operating profit ratio from the following information
 View Solution
Calculate operating profit ratio from the following information:
 View Solution
Calculate operatiing profit ratio form the following information
 View Solution
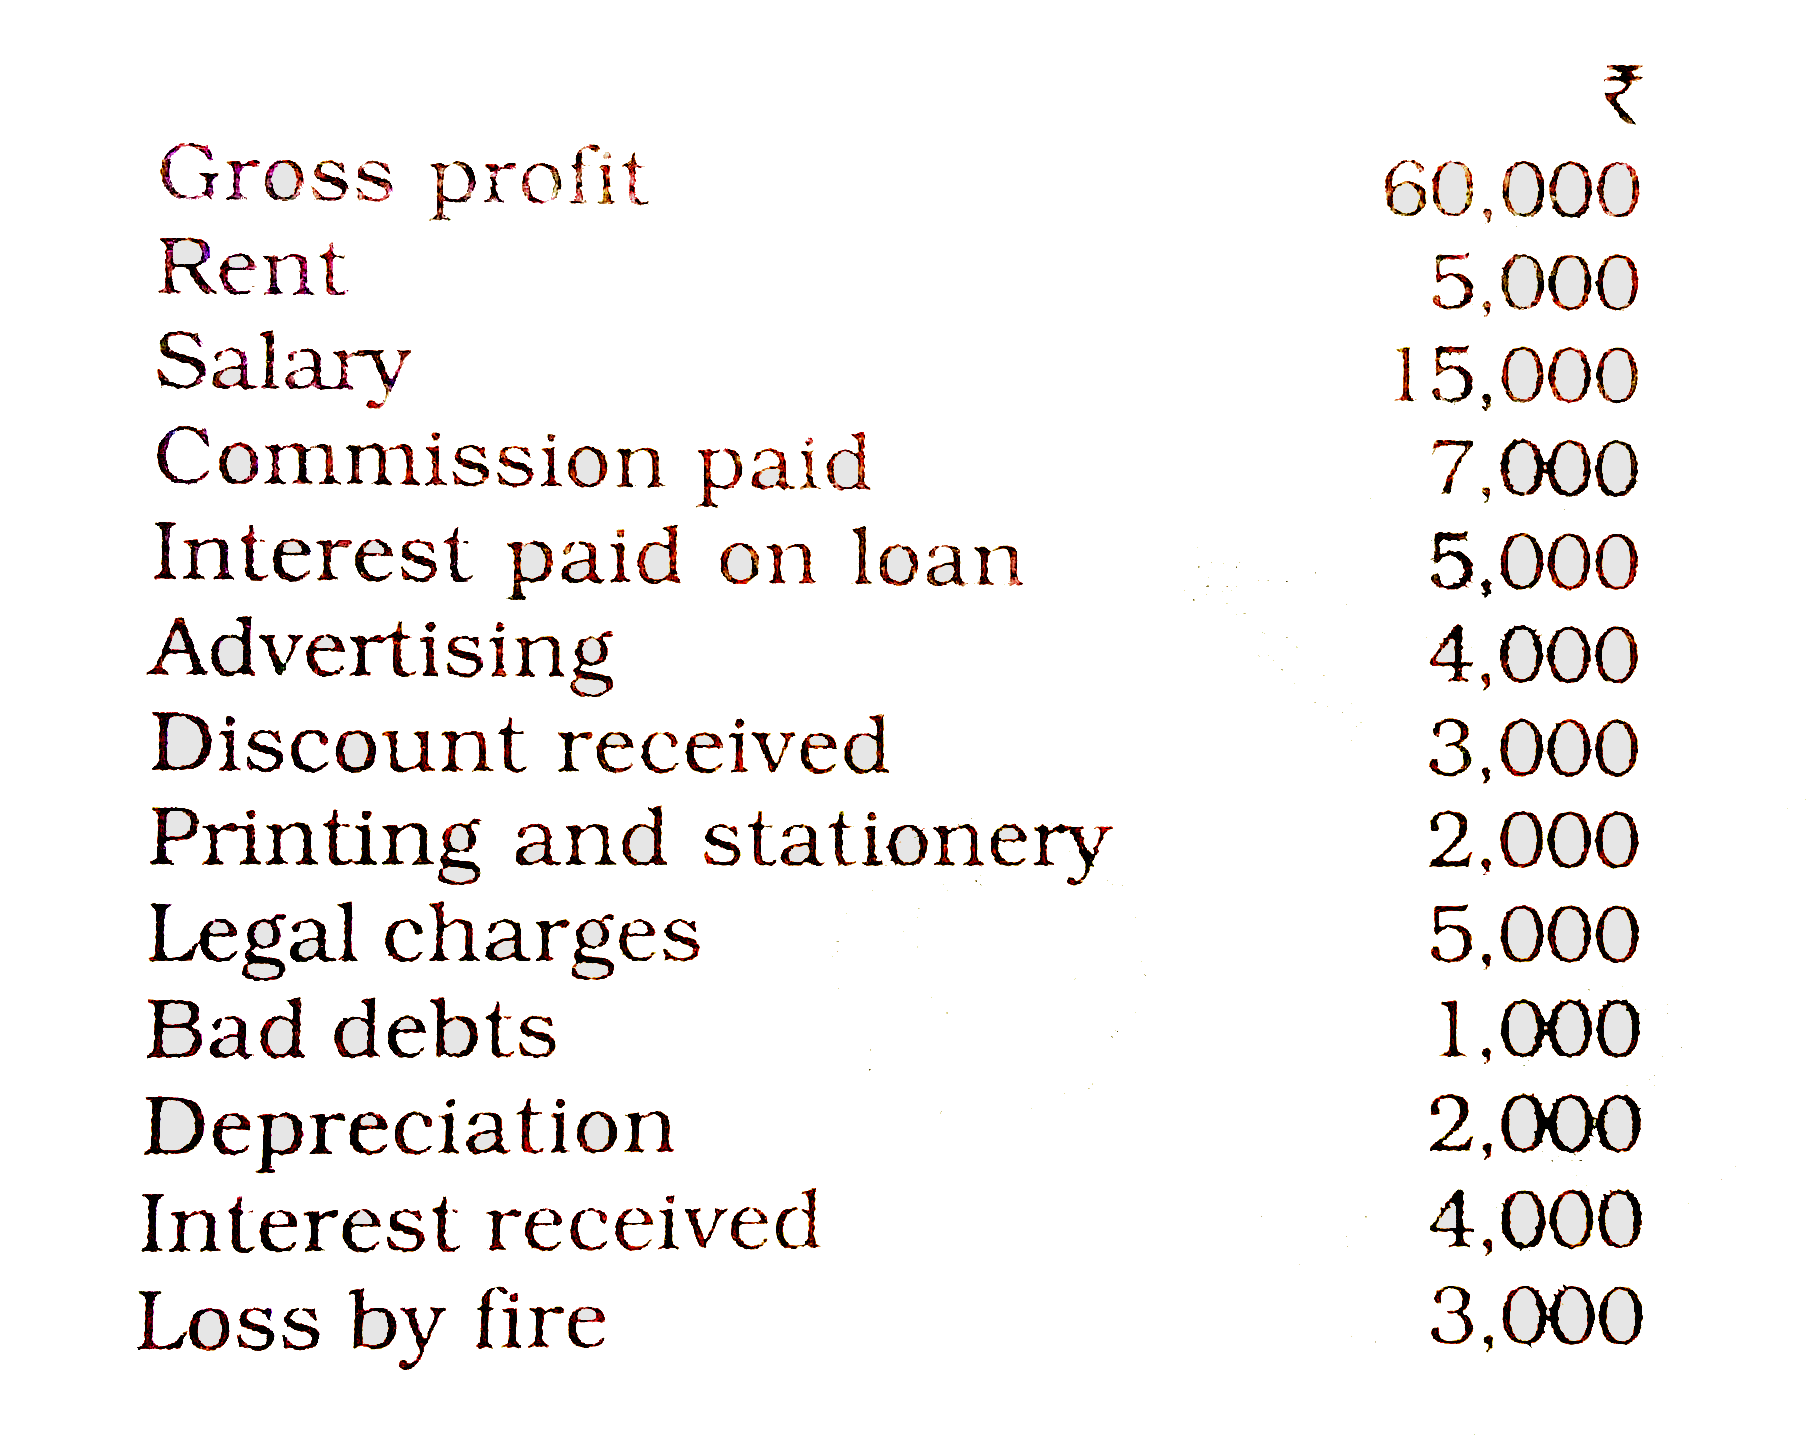
From the following information, prepare a profit and loss account for the year ending March 31, 2017.
 View Solution
Draw a suitable diagram to express the relationship for ideal solutions of A and B between vapour pressure and mole fractions of components at constant temperature
View SolutionWhich type of accounting information shows profit earned or loss incurred?
View SolutionDraw a ray diagram in each of the following cases to show the formation of image, when the object is placed :
anywhere in front of a concave lens.View Solution

