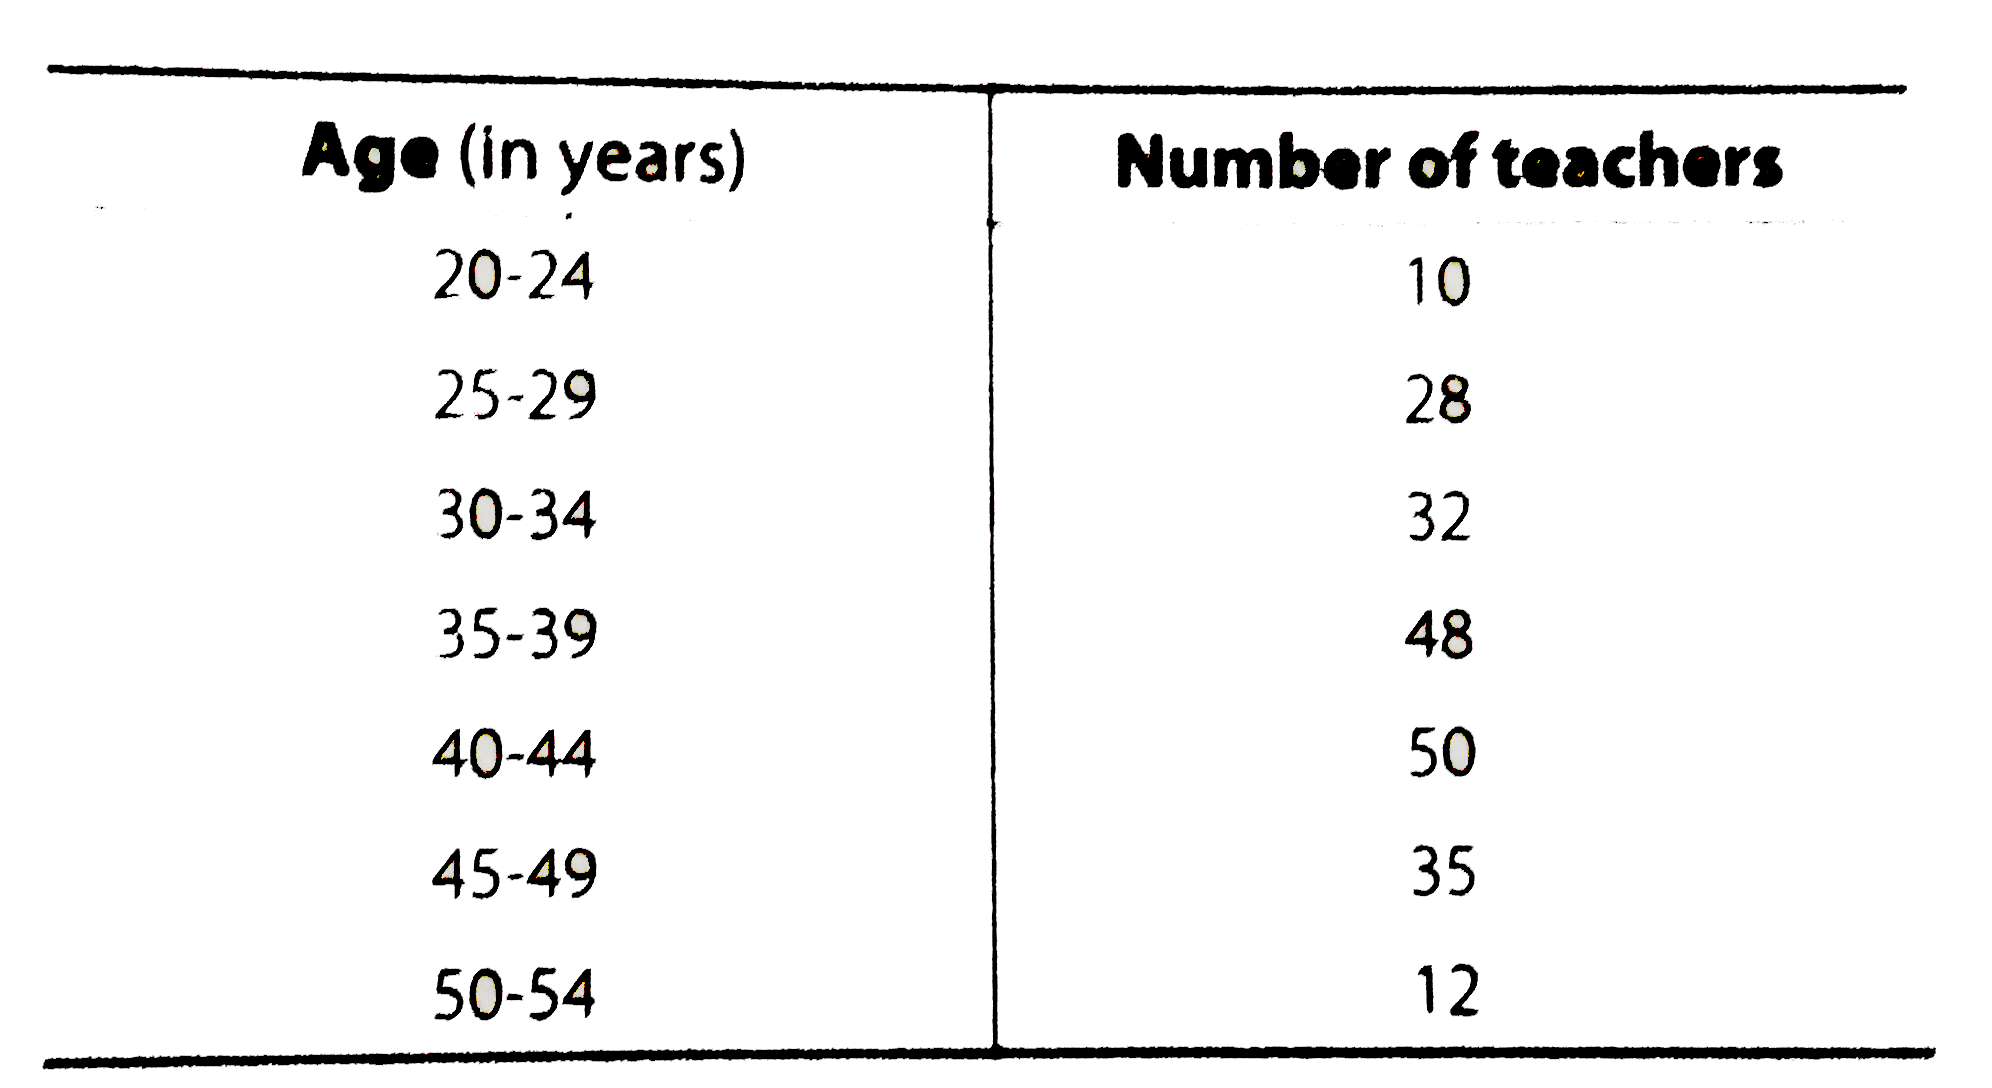
A Histogram is a graphical presentation of a frequency distribution of a:
individual series
discrete series
continuous series
none of these
The correct Answer is:C
C
Topper's Solved these Questions
- FREQUENCY DIAGRAMS - HISTOGRAM, POLYGON AND OGIVEBook:TARUN JAIN & VK OHRIChapter:FREQUENCY DIAGRAMS - HISTOGRAM, POLYGON AND OGIVEExercise:EXERCISE FILL IN THE BLANK
Explore 5 Videos
- FREQUENCY DIAGRAMS - HISTOGRAM, POLYGON AND OGIVEBook:TARUN JAIN & VK OHRIChapter:FREQUENCY DIAGRAMS - HISTOGRAM, POLYGON AND OGIVEExercise:EXERCISE TRUE AND FALSE
Explore 3 Videos
- FREQUENCY DIAGRAMS - HISTOGRAM, POLYGON AND OGIVEBook:TARUN JAIN & VK OHRIChapter:FREQUENCY DIAGRAMS - HISTOGRAM, POLYGON AND OGIVEExercise:Miscellaneous Illustration
Explore 8 Videos
- DIAGRAMMATIC PRESENTATION OF DATA BAR DIAGRAMS AND PIE DIAGRAMSBook:TARUN JAIN & VK OHRIChapter:DIAGRAMMATIC PRESENTATION OF DATA BAR DIAGRAMS AND PIE DIAGRAMSExercise:NCERT Question (With Hints to Answers)
Explore 3 Videos
- INDEX NUMBERSBook:TARUN JAIN & VK OHRIChapter:INDEX NUMBERSExercise:NCERT Questions (With Hints to Answers)
Explore 12 Videos
Similar Questions
Histogram a histogram or frequency histogram is a graphical representation of a frequency distribution in the form of rectangles with class intervals as bases and heights proportional to corresponding frequencies such there is no gap between any two successive rectangles.
View Solution____ is a graphical presentation of a frequency distribution of a continuous series . (Histogram / Polygon)
View Solution
Knowledge Check
Consider the following statements in respect of histogram :
1. The histogram is a suitable representation of a frequency distribution of a continuous variable.
2. The area included under the whole histogram is the total frequency.
Which of the above statements is/are correct?A1 onlyB2 onlyCBoth 1 and 2DNeither 1 nor 2Consider the following statements in respect of histogram :
1. Histogram is an equivalent graphical representation of the frequency distribution.
2. Histogram is suitable for continuous random variables, where the total frequency of an interval is evenly distributed over the interval.
What of the statements given above is/are correct?AOnly IBOnly IICBoth 1 and IDNeither I nor 2......... is one of the methods of the graphic presentation of the frequency distribution.
ADiagramBHistogramCMonogramDHolographic design
Consider the following statements in respect of histogram :
1. Histogram is an equivalent graphical representation of the frequency distribution.
2. Histogram is suitable for continuous random variables, where the total frequency of an interval is evenly distributed over the interval.
What of the statements given above is/are correct?
View SolutionIn a frequency distribution, ogives are graphical representation of (a) Frequency (b) Relative frequency (c) Cumulative frequency (d) Raw data
View SolutionDraw a histogram to represent the following grouped frequency distribution.

View SolutionTo draw a histogram to represent the following frequency distribution.
The adjusted frequency for the class 25-45 is
View SolutionTo draw a histogram to represent the following frequency distribution.
Class Interval 5−1010−1515−2525−4545−75
Frequency 6 12 10 8 15
The adjusted frequency for the class 25−45 is
View Solution

