Data represented through arithmetic line graph help in understanding:
(i) long term trend (ii) cyclicity in data
(iii) seasonality in data (iv) all of the above
The correct Answer is:(i)
i) Long term trend
Topper's Solved these Questions
- BOOK - TARUN JAIN & VK OHRICHAPTER - ARITHMETIC LINE-GRAPHS OR TIME SERIES GRAPHSEXERCISE - Essential Practicals4videos
ARITHMETIC LINE-GRAPHS OR TIME SERIES GRAPHS
- BOOK - TARUN JAIN & VK OHRICHAPTER - CENSUS AND SAMPLE METHODS OF COLLECTION OF DATAEXERCISE - NCERT Question9videos
CENSUS AND SAMPLE METHODS OF COLLECTION OF DATA
Similar Questions
Knowledge Check
- Question 1 - Select One
Which one of the given responses would be a meaningful order of the following words in ascending order ?
(i) Take action (ii) Collect data (iii) Select problem (iv) Analyse and Interpret dataA(i), (ii), (iii), (iv)B(ii). (iii), (iv), (i)C(i), (iii), (iv), (ii)D(iii), (ii), (iv), (i) - Question 2 - Select One
Match List-I with List-II and select the correct answer from the codes given below the lists:

 AOnly IBOnly IICBoth I and IIDNeither I nor II
Define and understand the following terms:
(i) Phylum (ii) Class (iii) Family (iv) Order (v) GenusView Solution3 Data represented through a histogram can help in finding graphically the .... a) Mean b) Mode c) Median d) All the above 1
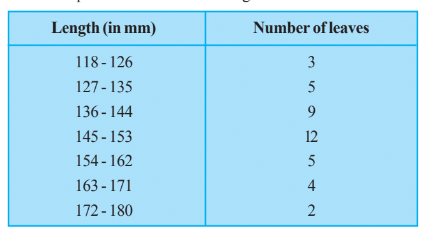
View SolutionThe length of 40 leaves of a plant are measured correct to one millimetre, and the obtained data is represented in the following table: (i) Draw a histogram to represent the given data.(ii) Is there any other suitable graphical representation for the same data?(iii) Is it correct to conclude that the maximum number of leaves are 153 mm long?Why?
View SolutionThe length of 40 leaves of a plant are measured correct to one millimeter, and the obtained data is represented in the following table:

(i) Draw a histogram to represent the given data.
(ii) Is there any other suitable graphical representation for the same data?
(iii) Is it correct to conclude that the maximum number of leaves are 153 mm long?Why?View SolutionThe length of 40 leaves of a plant measured correct to one millimetre and the obtained data is represented in the following table:

(i) Draw a histogram to represent the given data.
(ii) Is there any other suitable graphical representation for the same data?
(iii) Is it correct to conclude that the maximum number of leaves 153 mm long and why?View SolutionDefine the following terms: (i) Observations (ii) data
View Solution

