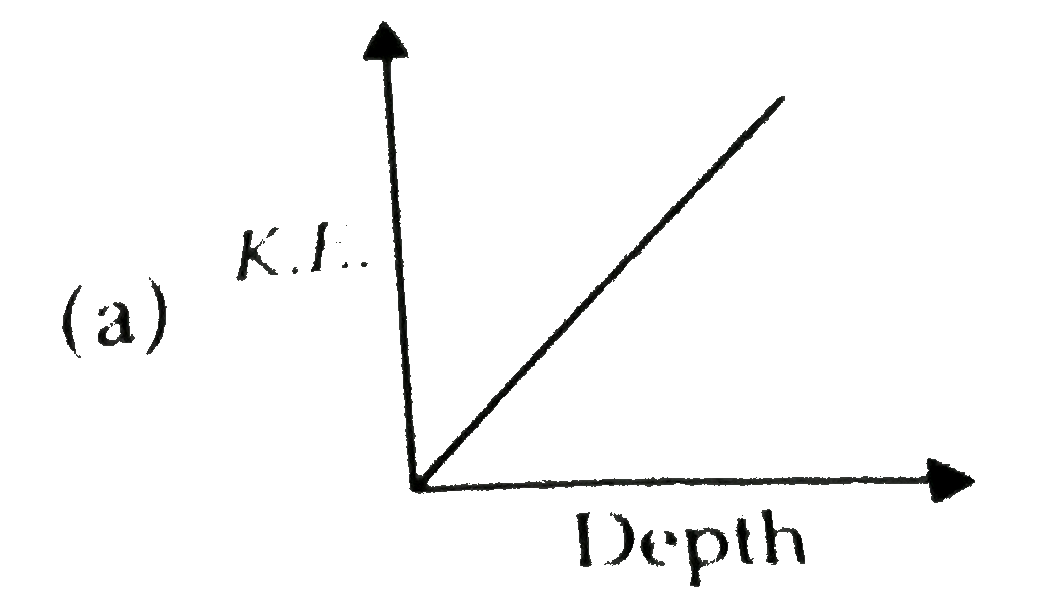
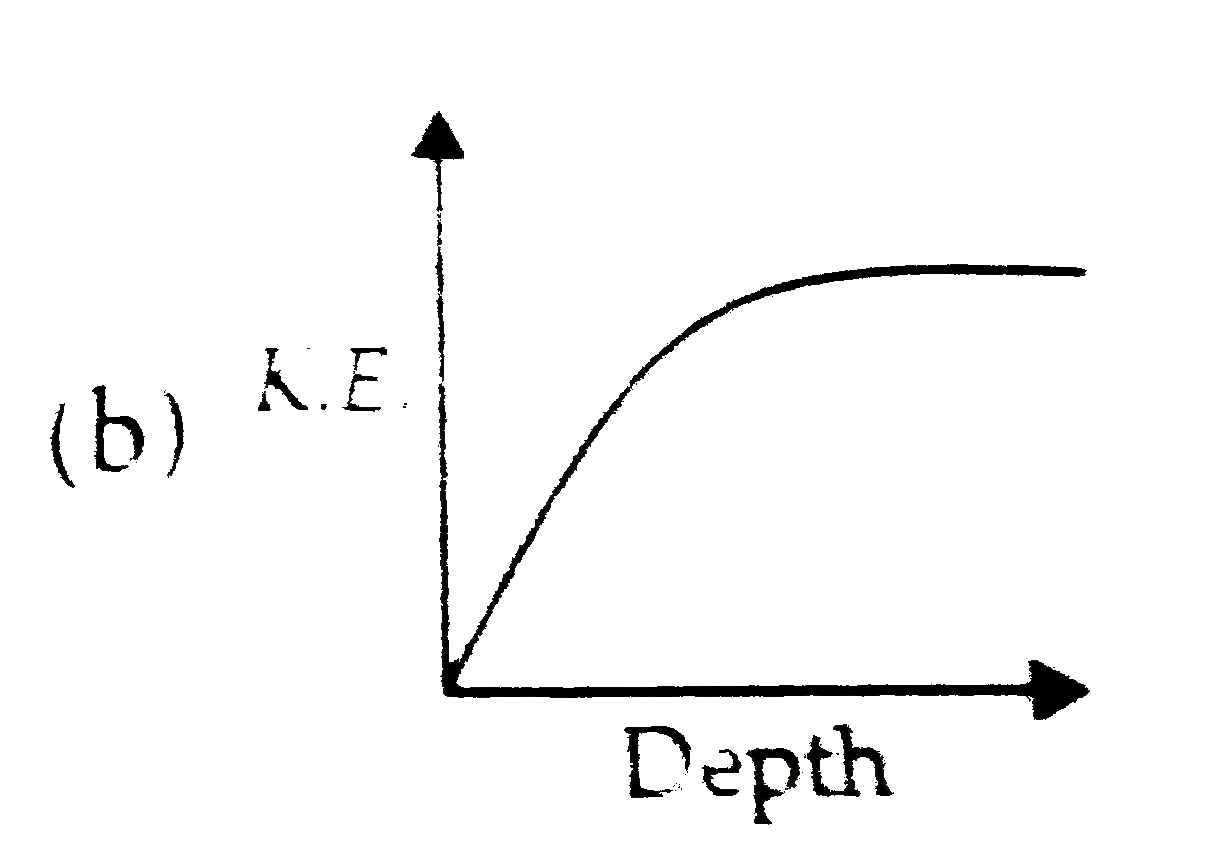
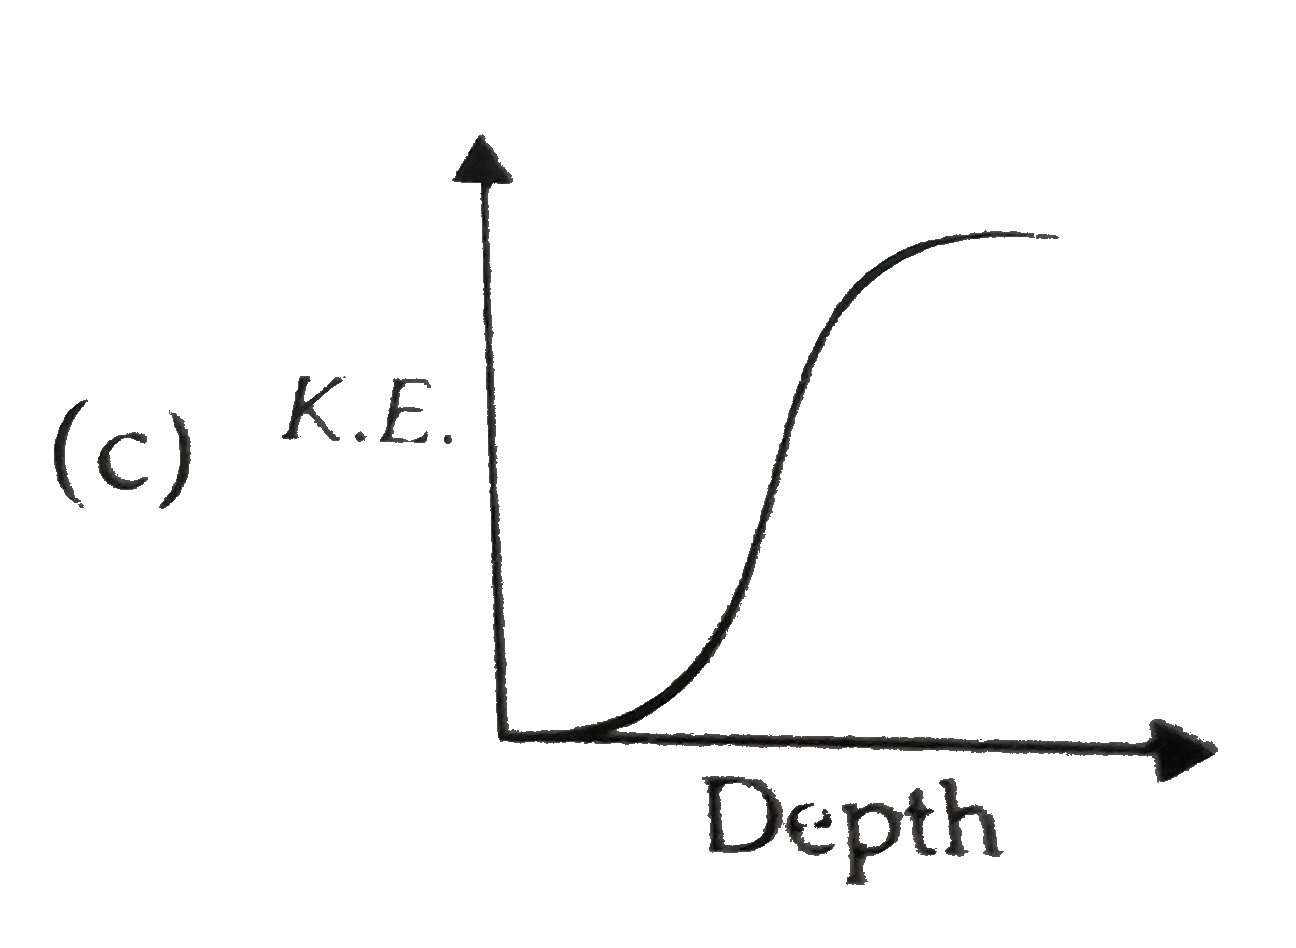
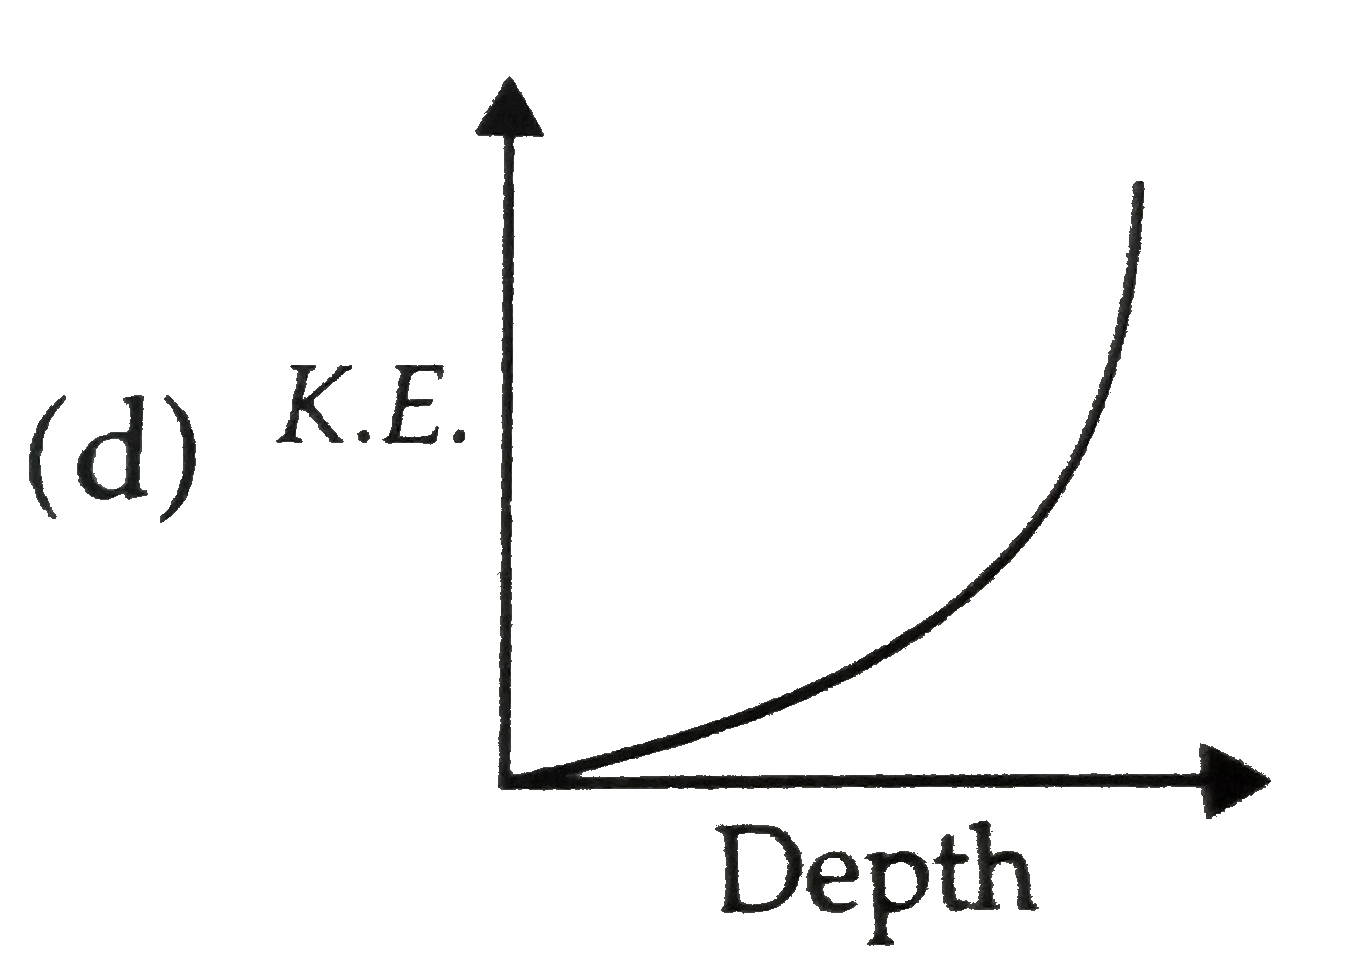
Which of the diagrams in figure, correctly shows the change in kinetic energy of an iron sphere falling freely in a lake having sufficient depth to impart if a terminal velocity ?
The correct Answer is:B
When an iron sphere falls freely in a lake, its motion is accelerated due to gravity and retarded due to viscous force. The overall effect is increase in velocity and hence increase in kinetic energy till the sphere acquire terminal velocity which is constant. Hence, kinetic energy of the sphere beyond this depth of lake becomes constant. Hence, option (b) represents the correct diagram.
Topper's Solved these Questions
- WORK , ENERGY AND POWERBOOK - NCERT FINGERTIPSCHAPTER - WORK , ENERGY AND POWEREXERCISE - Assertion And Reason
15 Videos
- WORK , ENERGY AND POWERBOOK - NCERT FINGERTIPSCHAPTER - WORK , ENERGY AND POWEREXERCISE - Higher Order Thinking Skills
8 Videos
- WAVESBOOK - NCERT FINGERTIPSCHAPTER - WAVESEXERCISE - Assertion And Reason
15 Videos
Similar Questions
Which would have a greater effect on the kinetic energy of an object : doubling the mass or doubling the velocity ?
View SolutionA sphere moving with a velocity v0 on a smooth surface suddenly enters on a rough horizontal surface as shown in Fig. State which of the following statements are true or false
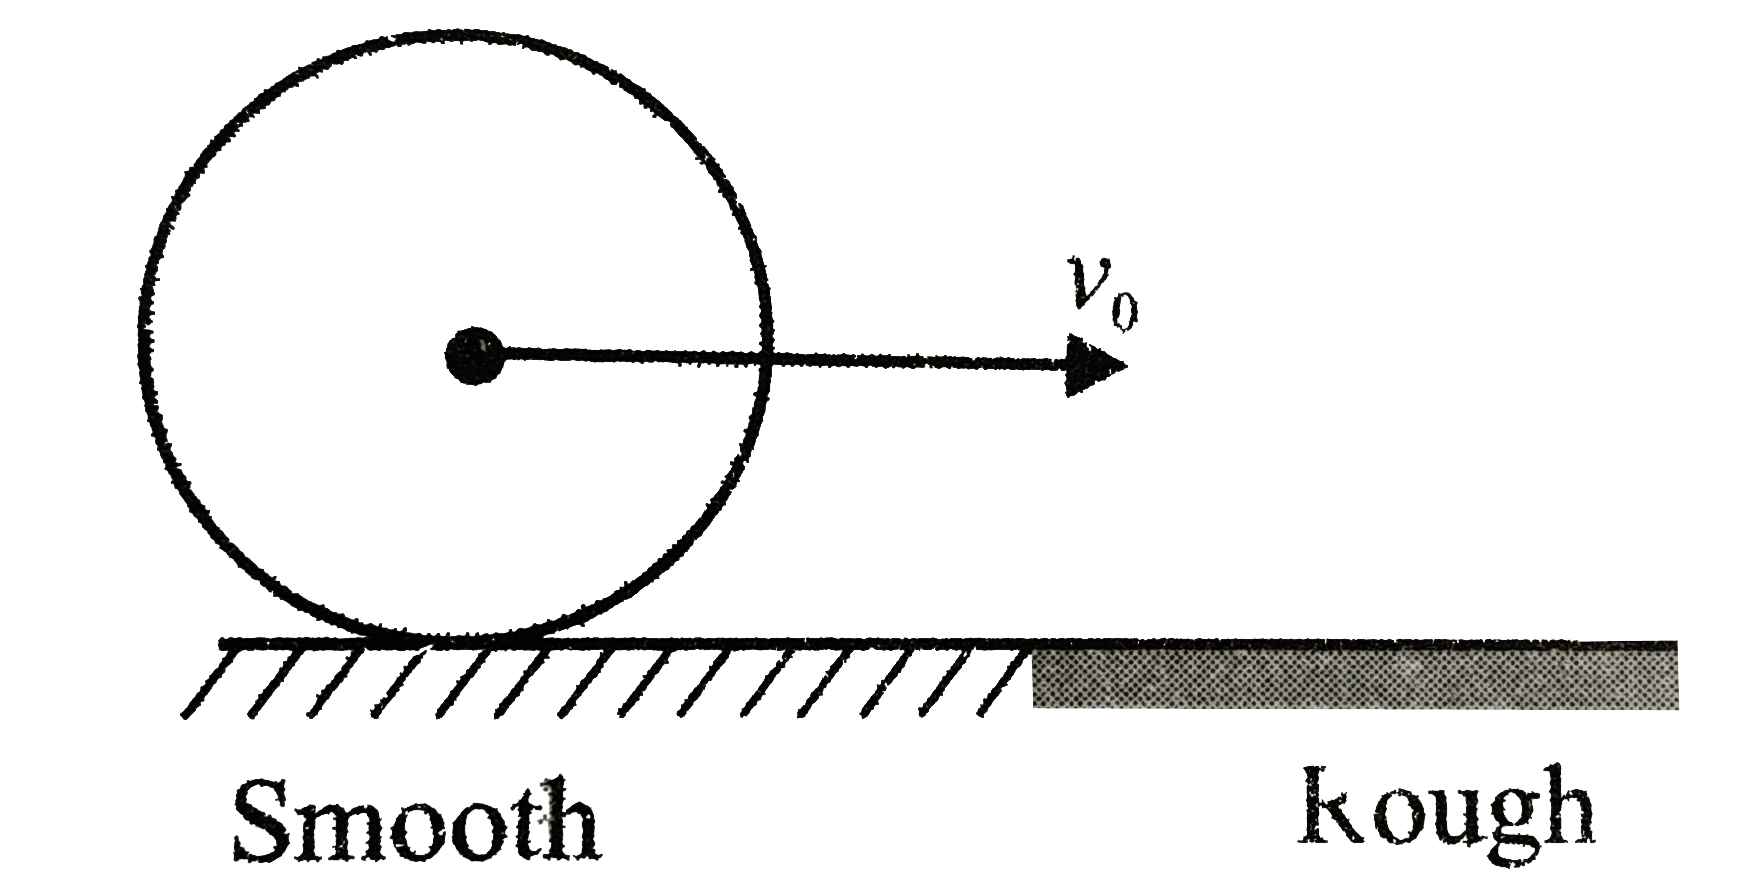
a. The sphere loses translational kinetic energy and gains rotational kinetic energy.
b. The total energy of the sphere is conserved.
c. The angular momentum of the sphere about any point OD the surface is conserved.
d. The final velocity attained by the centre of mass is 2v0/3.
View Solution
Knowledge Check
Which of the diagrams corectly shows the change in kinetic energy of an iron sphere falling freely in a lake having sufficient depth to impart it a terminal velocity ?
A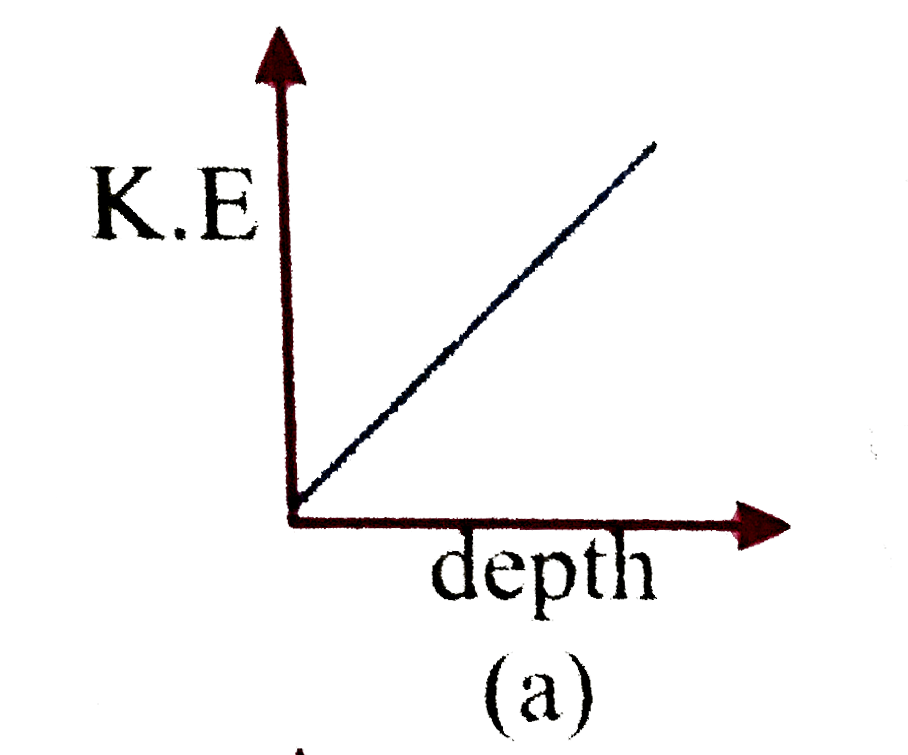 .B
.B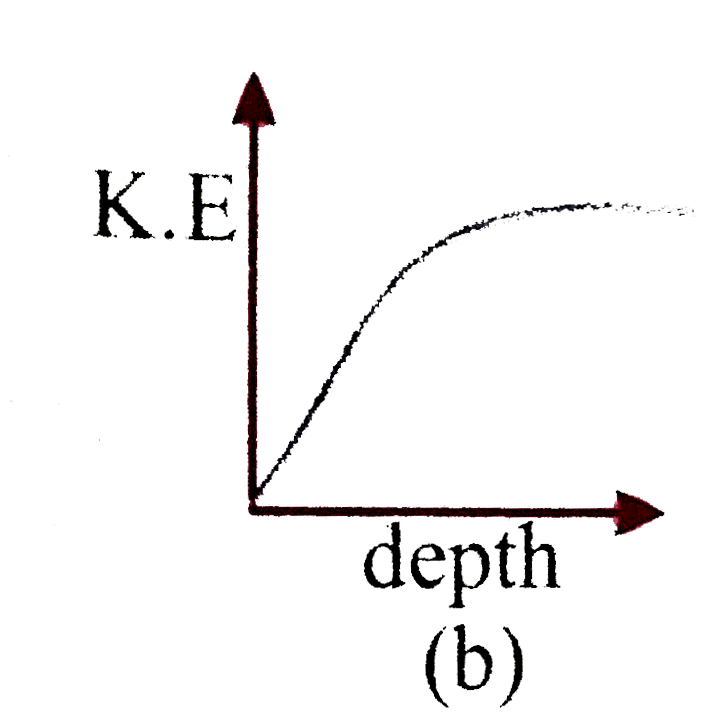 .C
.C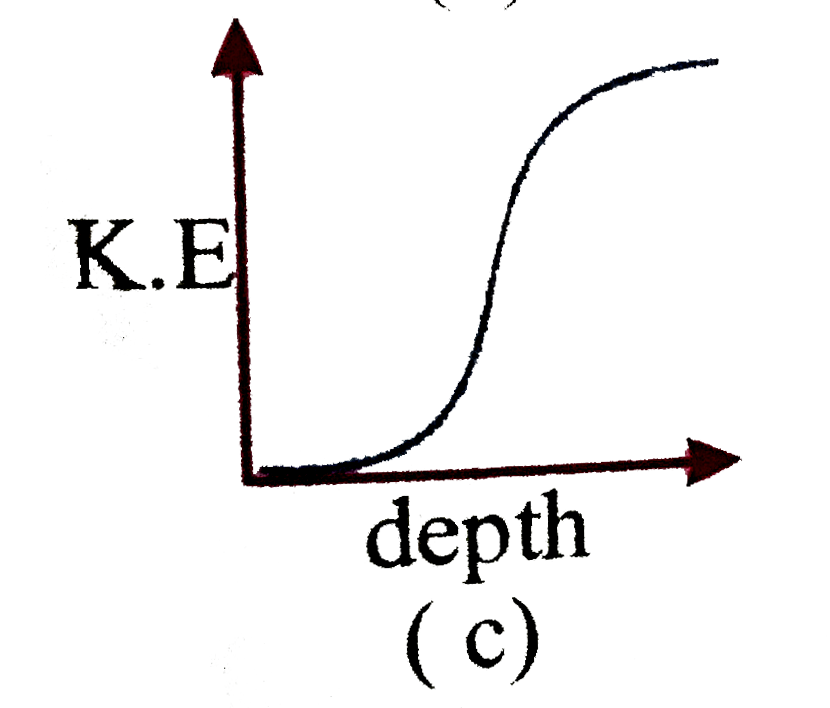 .D
.D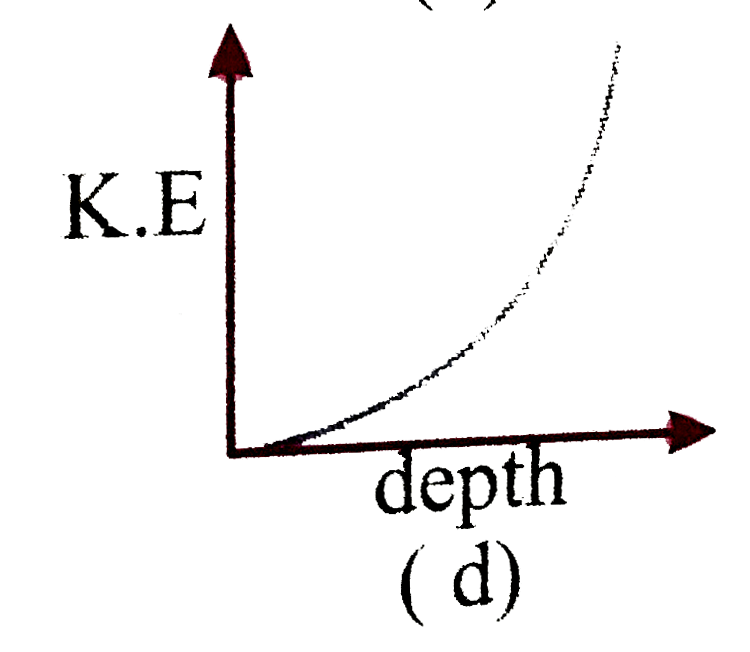 .
.Which of the diagrams shown in figure. Most closely shows the variation in kinetic energy of the earth as it moves once around the sun in its elliptical orbit ?
A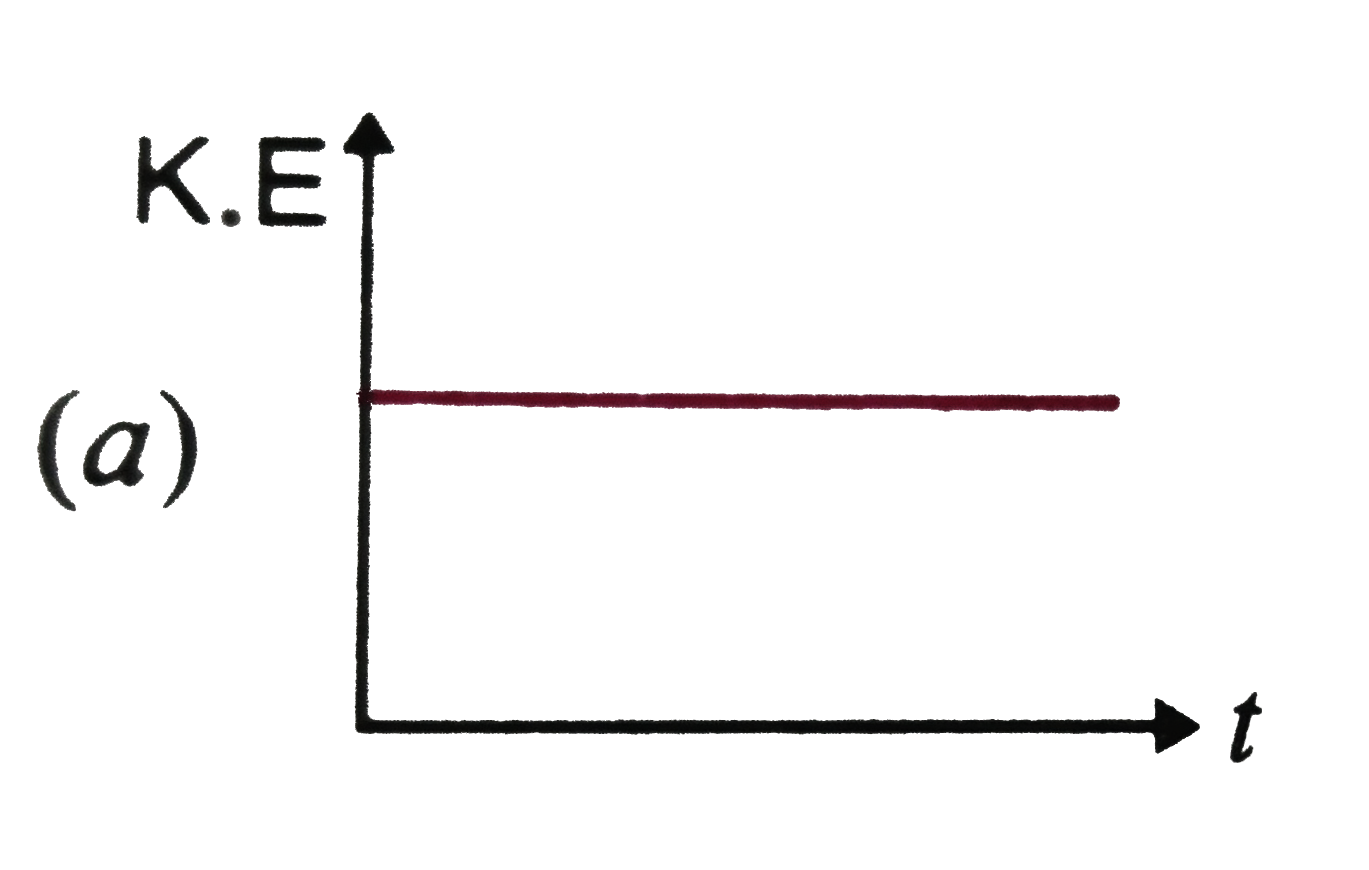 B
B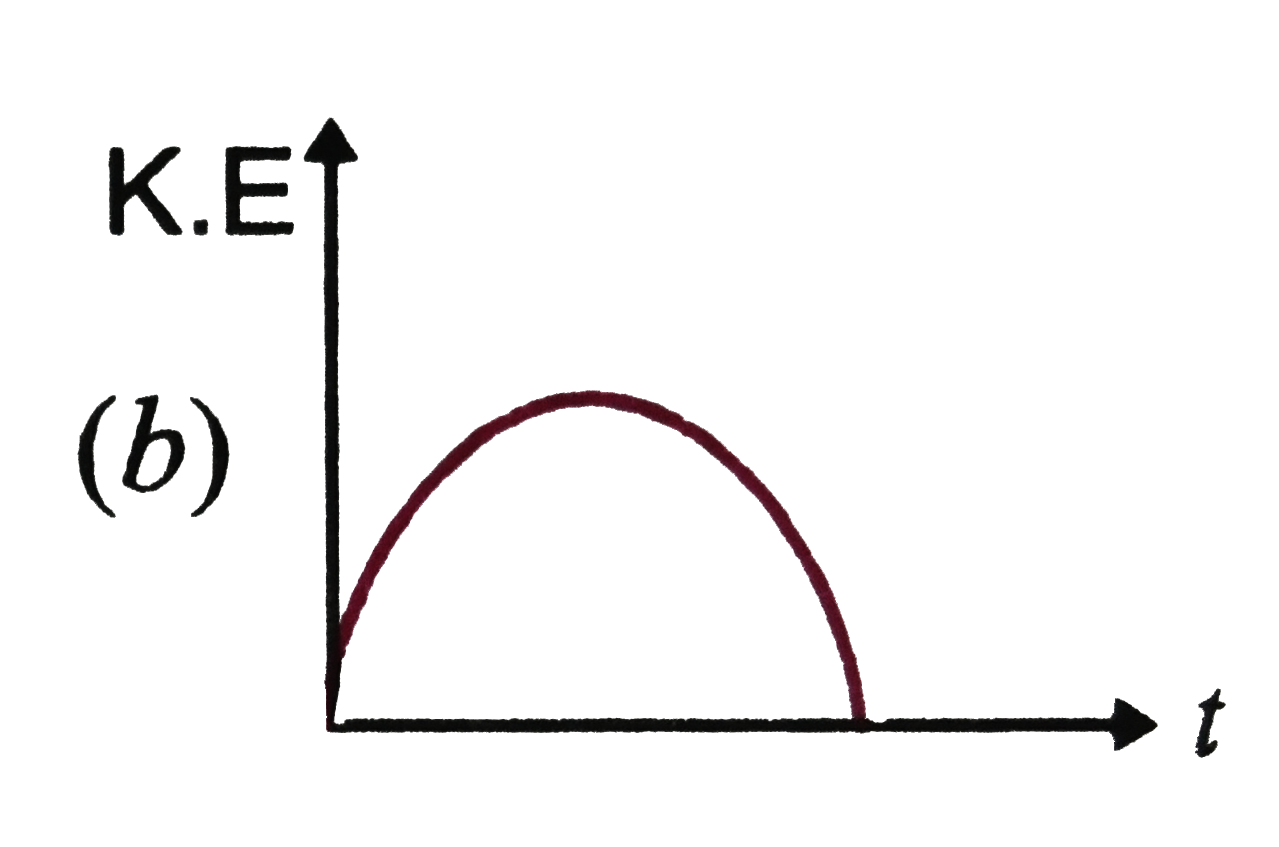 C
C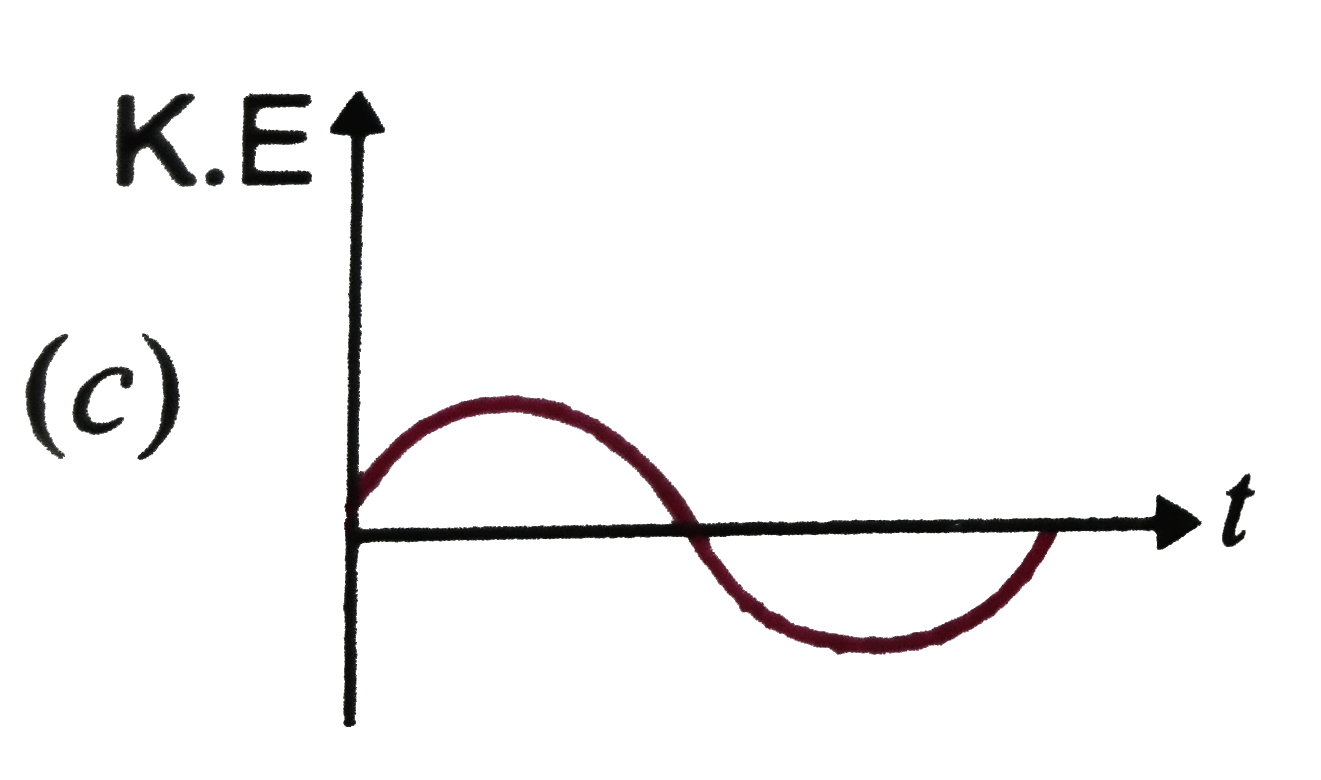 D
D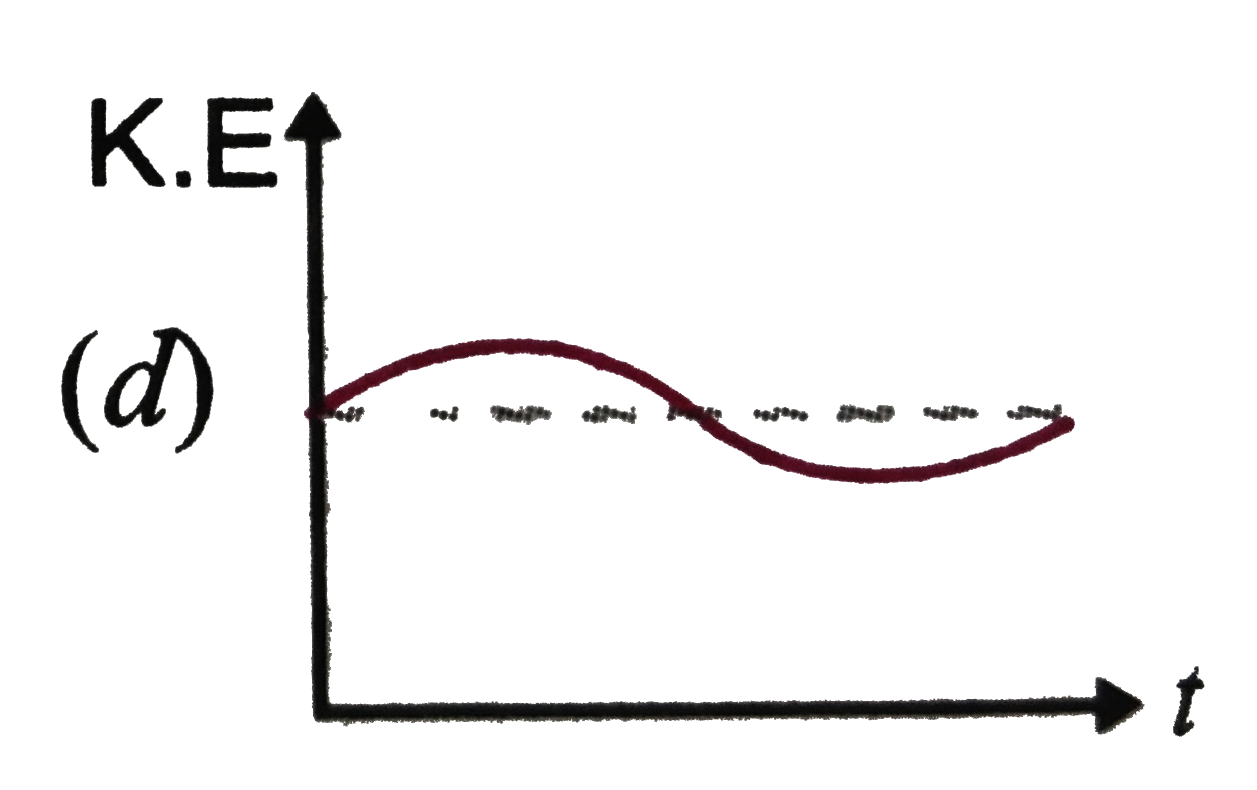
Which figure correctly shows two iron nails hanging from a bar magnet?
A B
B C
C D
D
A raindrop falling from a height h above ground, attains a near terminal velocity when it has fallen through a height (3/4)h. Which of the diagrams shown in figure correctly shows the change in kinetic and potential energy of the drop during its fall up to the ground ?
View SolutionWhich of the following graph correctly represents velocity-time relationship for a particle released from rest to fall freely under gravity ?
View SolutionTwo discs A and B are mounted coaxially ona vertical axle. The discs have moments of inertia l and 2l respectively about the common axis. Disc A is imparted an initial angular velocity 2ω using the centre potential energy of a spring compressed by a distance x1. Disc B is imparted angular velocity ω by a spring having the same spring constant and compressed by a distance x2. Both the disc rotate in the clockwise direction.
The loss of kinetic energy the above process is -
View SolutionTwo discs A and B are mounted coaxiallay on a vertical axle. The discs have moments of inertia I and 2 I respectively about the common axis. Disc A is imparted an initial angular velocity 2ω using the entire potential energy of a spring compressed by a distance x1 Disc B is imparted an angular velocity ω by a spring having the same spring constant and compressed by a distance x2 Both the discs rotate in the clockwise direction.
The loss of kinetic energy in the above process is
View Solution
In a photoelectric effect experiment , the maximum kinetic energy of the ejected photoelectrons is measured for various wavelength of the incident light. Figure shows a graph of this maximum kinetic energy Kmax as a function of the wavelength λ of the light falling on the surface of the metal. Which of the following statement/i is/ are correct?
View Solution
