The figure show a cross-section of a double glass unit of a window on a vertical wall. A graph wall. A graph of the temperature at different points within the unit is show next to it. The temperature difference across the unit is . It has a crossp-sectional area of and the rate of heat flow through it is . Then the correct statement is (Glass has a thermal conductivity of )

The unit is in steady state and in thermal equilibrium
The unit is in steady state but not in thermal equalibrium.
The unit is not in steady state but is in thermal
The unit neither in steady state nor in thermal equilibrium
The correct Answer is:B
Temperature is not same every where so unit is not in thermal equilibrium but heat is flowing at constant rate.
Topper's Solved these Questions
- THERMAL PROPERTIES OF MATTERBOOK - NCERT FINGERTIPSCHAPTER - THERMAL PROPERTIES OF MATTEREXERCISE - NCERT Exemplar
8 Videos
- THERMAL PROPERTIES OF MATTERBOOK - NCERT FINGERTIPSCHAPTER - THERMAL PROPERTIES OF MATTEREXERCISE - Assertion And Reason
10 Videos
- THERMAL PROPERTIES OF MATTERBOOK - NCERT FINGERTIPSCHAPTER - THERMAL PROPERTIES OF MATTEREXERCISE - Newton'S Law Of Cooling
3 Videos
- SYSTEM OF PARTICLES AND ROTATIONAL MOTIONSBOOK - NCERT FINGERTIPSCHAPTER - SYSTEM OF PARTICLES AND ROTATIONAL MOTIONSEXERCISE - Assertion And Reason
15 Videos
- THERMODYNAMICSBOOK - NCERT FINGERTIPSCHAPTER - THERMODYNAMICSEXERCISE - Assertion And Reason
15 Videos
Similar Questions
Knowledge Check
Two different rods A and B are kept as shown in figure . The variation of temperature of different cross sections with distance is plotted in a graph shown in figure . The ration of thermal conductivities of A andB is -
_E01_027_Q01.png) A2B0.5C1D2/3
A2B0.5C1D2/3
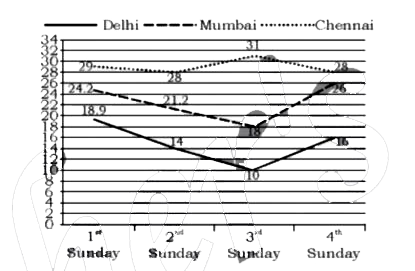
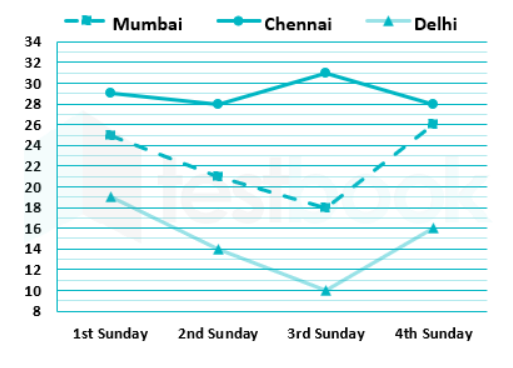
The line graph shows the temperature on four Sundays of three cities
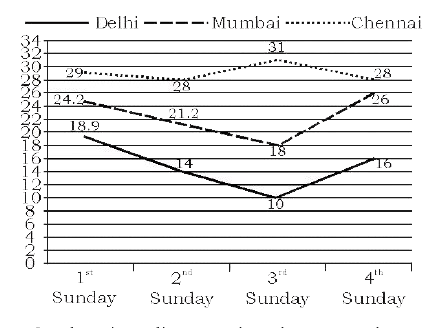 In the given line graph , when was the maximum temperature recorded in Chennai
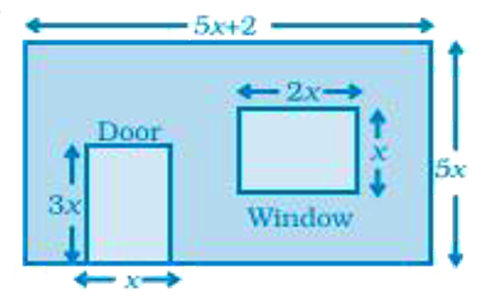
View SolutionThe figure shows the dimensions of a wall having a window and a door of a room. Write an algebraic expression for the area of the wall to be painted.
View SolutionThe line graph shows the temperature on four Sundays of three cities.
In the given line graph, when was the maximum temperature recorded in Delhi?
View SolutionThe line graph shows the temperature on four Sundays of three cities.
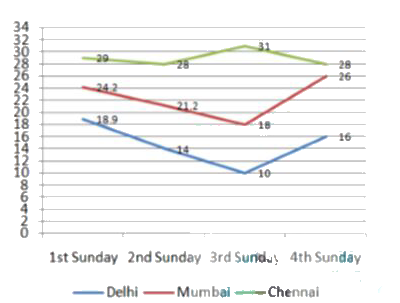
In the given line graph, when was the maximum temperature recorded in Delhi?
View SolutionTwo different rods A and B are kept as shown in figure . The variation of temperature of different cross sections with distance is plotted in a graph shown in figure . The ration of thermal conductivities of A andB is -
_E01_027_Q01.png)
View SolutionThe line graph shows the temperature on four Sunday of three cities
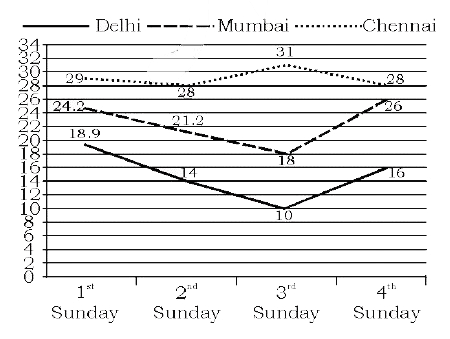
In the given graph, what was the difference in temperature between Delhi and Chennai on the 3rd Sunday?
View SolutionThe line graph shows the temperature on four sundays of three cities
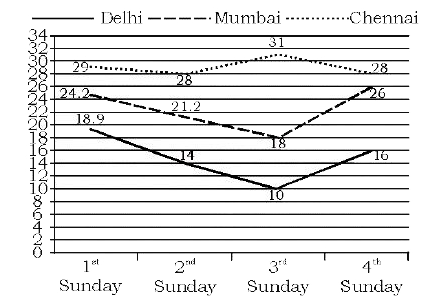
In the given line graph what was the difference in temperature between Delhi and Mumbai on the 2nd Sunday?
View Solution

