Only one Product Y is produced in the country. Its output during the years 2012 and 2013 was 100 units and 100 units respectively. The market price of the product during the year was Rs 50 and Rs 55 per units respectively. Calculate the percetage change in real GDP and nominal GDP in year 2013 using 2012 as the base year.

% chage in real GDP=Δ in Real GDPBase year Real GDP×100=5005000×100=10%
% change in nominal GDP=Δin nominal GDPBase year nominal GDP×100=10505000×100=21%
Topper's Solved these Questions
- BOOK - RADHA BHUGANACHAPTER - MEASUREMENT OF NATIONAL INCOME : METHODS OF CALCULATING NATIONAL INCOMEEXERCISE - Value based Questions4videos
MEASUREMENT OF NATIONAL INCOME : METHODS OF CALCULATING NATIONAL INCOME
- BOOK - RADHA BHUGANACHAPTER - MEASUREMENT OF NATIONAL INCOME : METHODS OF CALCULATING NATIONAL INCOMEEXERCISE - Guideline To NCERT Question2videos
MEASUREMENT OF NATIONAL INCOME : METHODS OF CALCULATING NATIONAL INCOME
- BOOK - RADHA BHUGANACHAPTER - MEASUREMENT OF NATIONAL INCOME : METHODS OF CALCULATING NATIONAL INCOMEEXERCISE - CONCEPTUAL QUESTION30videos
MEASUREMENT OF NATIONAL INCOME : METHODS OF CALCULATING NATIONAL INCOME
- BOOK - RADHA BHUGANACHAPTER - INTRODUCTION- MACROECONOMICSEXERCISE - guidelines to NCERT questions2videos
INTRODUCTION- MACROECONOMICS
- BOOK - RADHA BHUGANACHAPTER - MONEY EXERCISE - Guidelines To NCRT Questions2videos
MONEY
Similar Questions
Only one Product X is produced in the country. Its output during the yaar 2012 and 2013 was 100 units and 110 units respectively. The market price of the product during the year was Rs. 50 and Rs. 55 per unit respectively. Calculate the percentage change in real GDP and nominal GDP in year 2013 using 2012 as the base year.
View SolutionAnswer the questions based on the information given below:
Three business partners invested for 5 years in a business in the years 2013, 2014, 2015, 2016 and 2017 respectively. The amounts invested by A, B and C in the year 2014 are Rs. 25000, 5000 and 15000 respectively. The profits earned by C in the year 2015 and 2016 are 16000 Rs. and 21000 Rs. respectively. The investment made by A, B and C in the year 2017 are 10000, 20000 and 30000 respectively. The total profit earned in the year 2014 is 75000 Rs. The total investment made in the year 2016 is Rs. 65000 and the ratio of amount invested by A, B and C is 5: 6: 2, respectively. The profits earned by C in the 2013 and A in 2017 are 105000 Rs. and 135000 Rs. respectively. The amount invested by B for the year 2013 is Rs. 20000 and the ratio of amount invested by A, B and C is 3: 4: 5, respectively. The profit earned by B in the year 2014 is 12500 Rs. The amount invested by B and C in the year 2015 is same and is equal to the amount invested by A in 2017. The amount invested by A in 2015 is equal to the amount invested by C in 2014. Also given that, the period of investment made by the business partners is not fixed.
In the year 2018, B and C increased their investment amount by 20% and 10% respectively while A has increased it by 50% with respect to the previous year and it has been decided that A will get an extra of 12.5% of the total profit for being a working partner. If at the end of the year A receives Rs. 88500, then find the total profit. (All three partners invested for the whole year)View Solution
Knowledge Check
- Question 1 - Select One
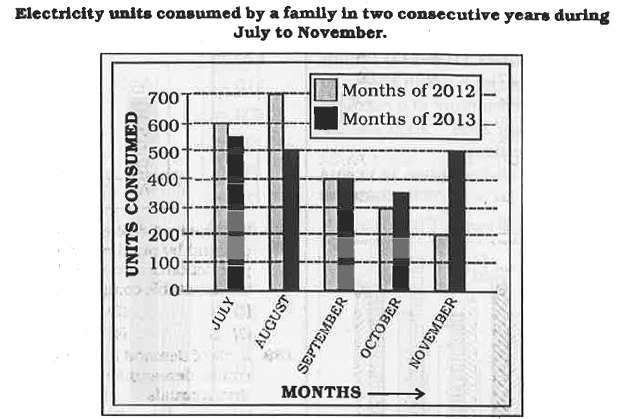
Study the following bar-diagram and answer the questions.

The total units consumption in the year 2013 during these 5 months, in respect of the same in the previous year has beenAincreased by 2.27%Bdecreased by 2.27%Cfound unalteredDincreased by 2.22% - Question 2 - Select One
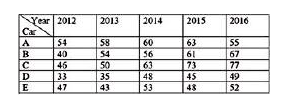
The table shows the production of different types of cars (in thousands).
यह तालिका एक कंपनी द्वारा 5 वर्षों में अलग-अलग कारों के उत्पादन (हज़ार में ) को दर्शाती है | The total production of type E cars in 2012 and 2013 is approximately what percent more than the average production of type A cars during the years 2012 to 2016?
2012 और 2013 में E प्रकार की कारों का कुल उत्पादन 2012 से 2016 के दौरान A प्रकार की कारों के औसत उत्पादन से लगभग कितना प्रतिशत अधिक है ?A53.8B55.2C52.2D56.4 - Question 3 - Select One
Capital at the end of year 2012 was Rs. 100 crore and at the end of the year 2013 was Rs. 110 crore. Depreciation during the year 2013 was Rs. 5 crore. Gross investment during 2013 is :
ARs. 5 croreBRs. 10 croreCRs. 15 croreDRs. 110 crore
The nominal GDP of a country for the year 2007-08 is Rs. 150 billion and price index 120. Final real GDP.
View SolutionThe price of item X rises by Rs 40 per year and that of item Y by Rs 15 per year. If the price of item X and Y in the year 2002 was Rs 420 and Rs 630 respectively, in which year the price of item X will be Rs 40 more than the price of item Y ? (a) 2010 (b) 2011 (c) 2012 (d) 2013
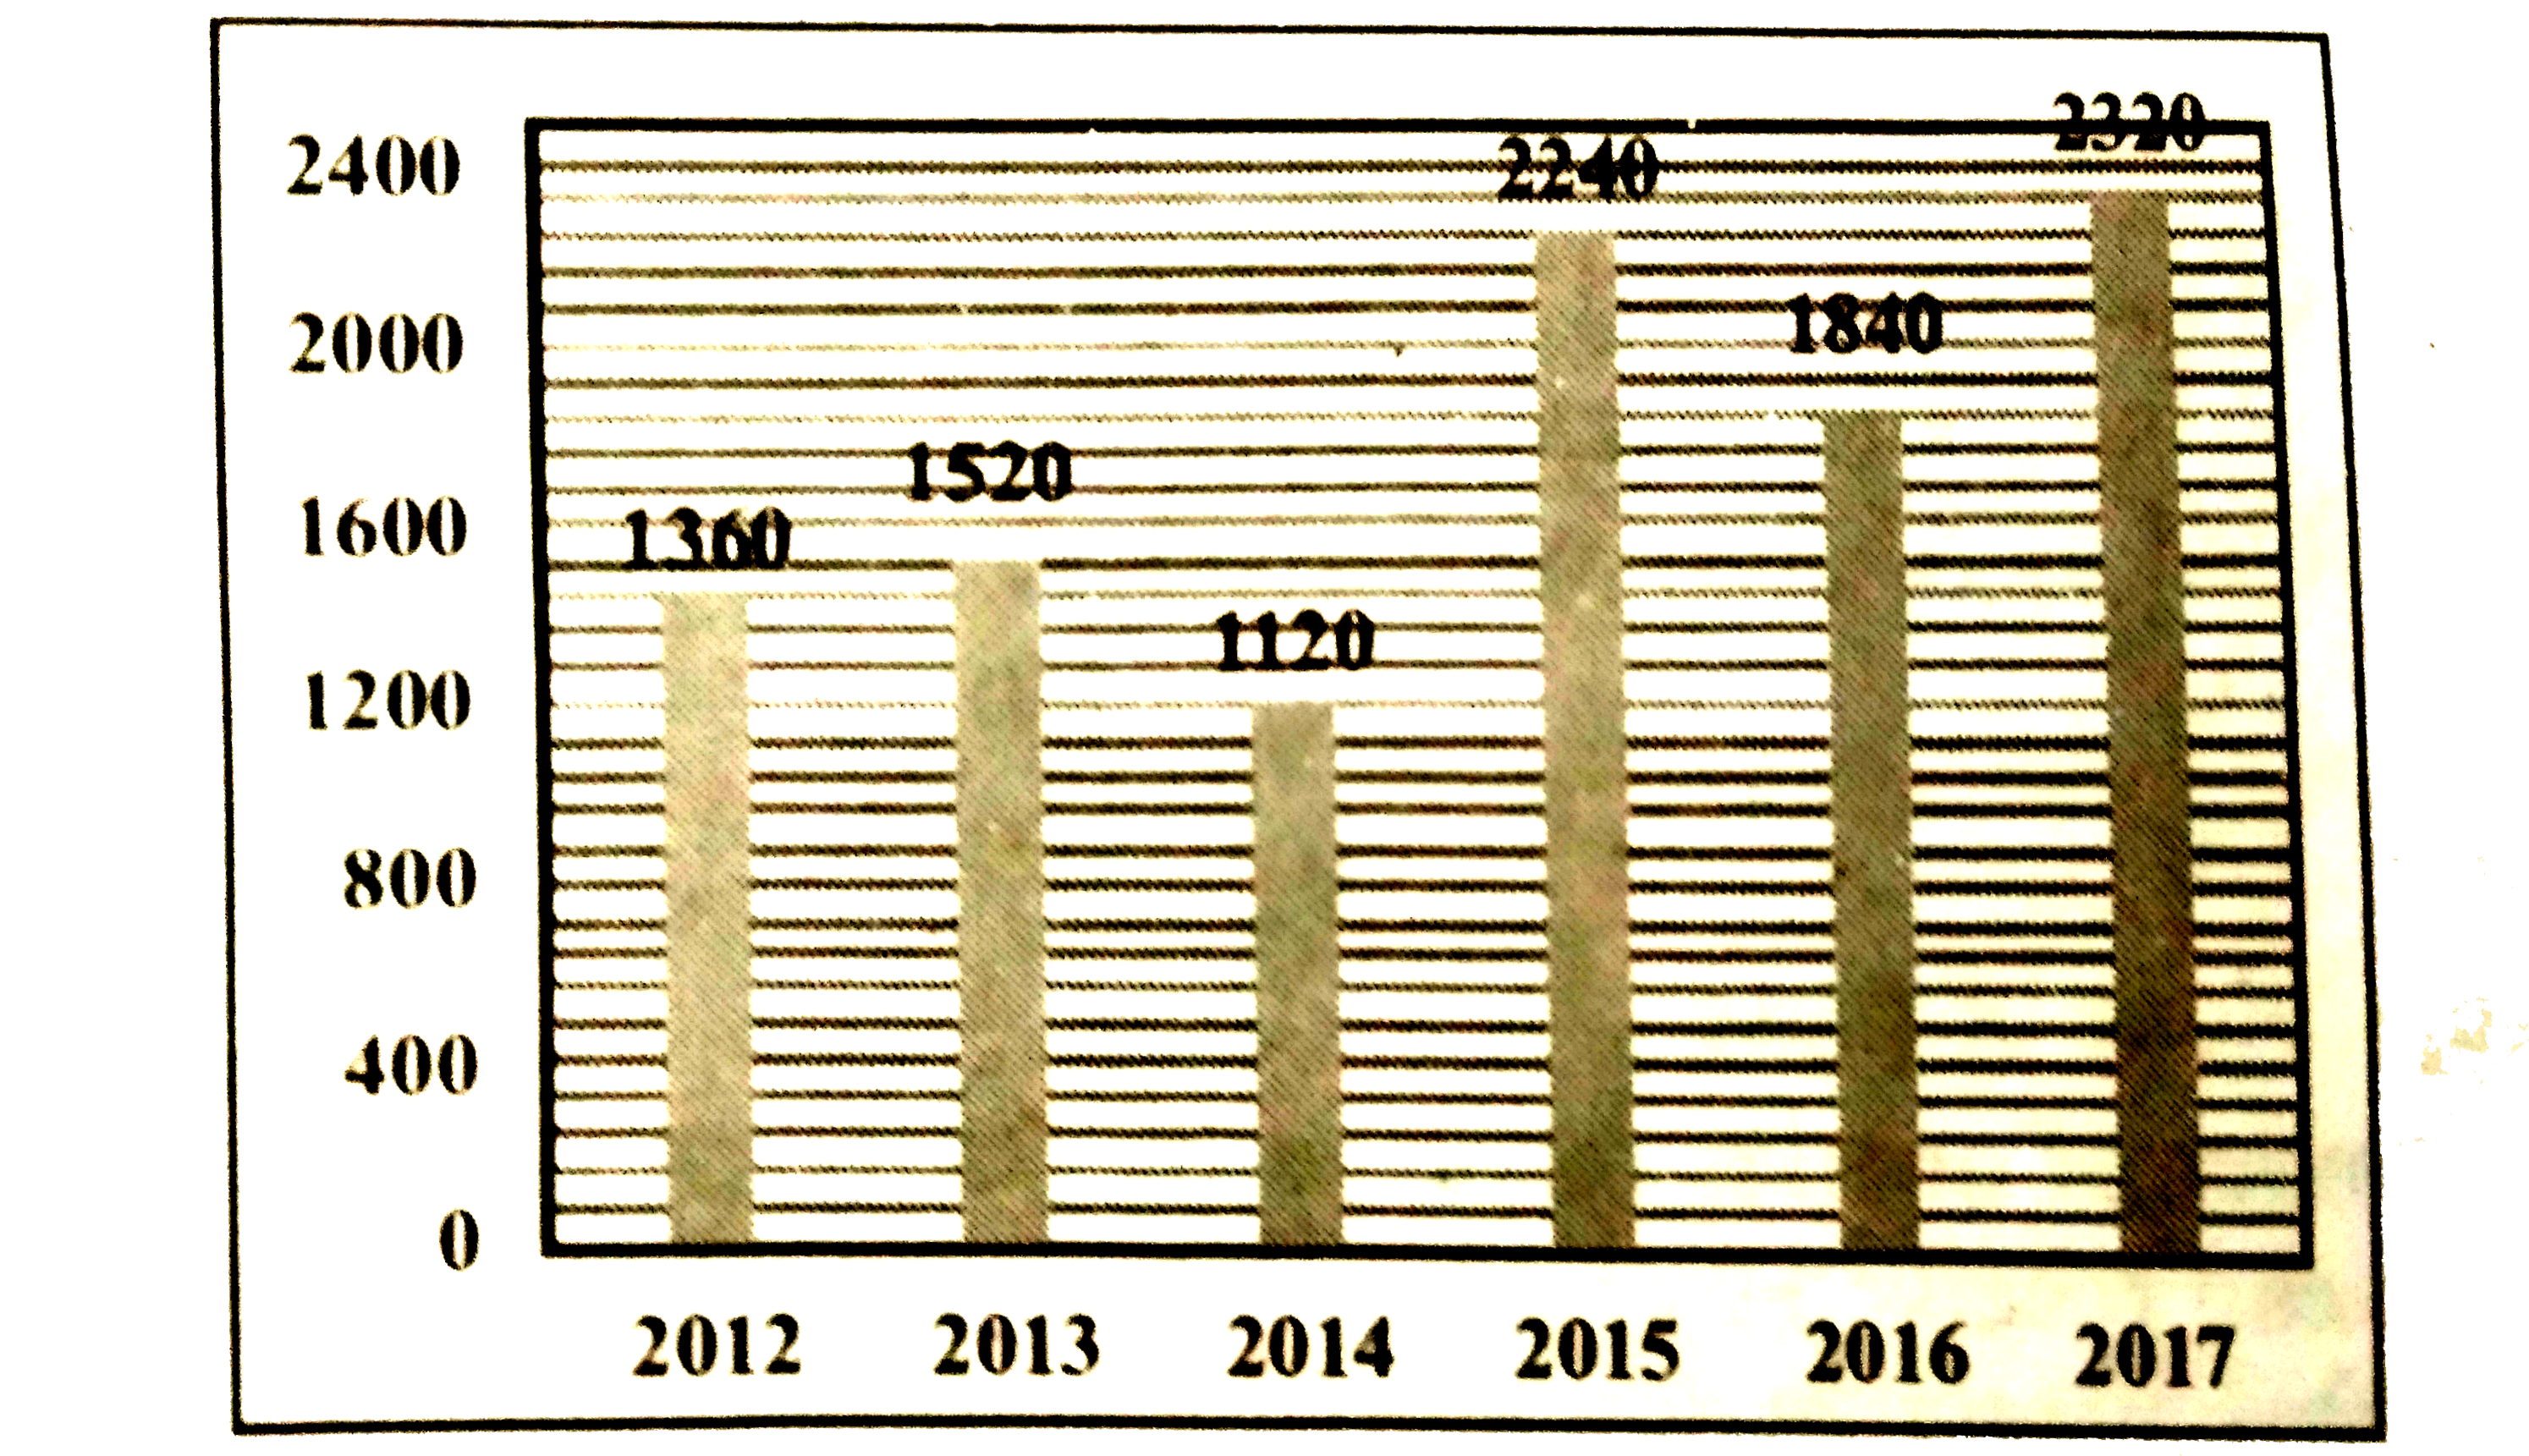
View SolutionThe following bar graph shows the price per square feet ( in Rs. ) of lands in different years.

The price per square feet in the year 2012 and 2015 together is approximately what perentage of the price per square feet in the year 2013 and 2016 together?View SolutionA manufacture produces three stationery products Pencil, Eraser and Sharpener which he sells in two markets. Annual sales are indicated below


If the unit Sale price of Pencil, Eraser and Sharpener are Rs. 2.50, Rs. 1.50 and Rs. 1.00 respectively, and unit cost of the above three commodities are Rs. 2.00, Rs. 1.00 and Rs. 0.50 respectively, then,
Based on the above information answer the following:
Profit in market A and B respectively areView SolutionThe table shows the production of different types of cars (in thousands).

The total production of types E cars in 2012 and 2013 is approximately what percent more than the average production of type A cars during the years 2012 to 2016?View Solution

