Total Sales=___________+___________
The correct Answer is:cash sales, Credit sales.
cash sales, Credit sales.
Topper's Solved these Questions
- PROJECT WORKBOOK - TS GREWALCHAPTER - PROJECT WORKEXERCISE - Multiple choice Questions
197 Videos
- PROJECT WORKBOOK - TS GREWALCHAPTER - PROJECT WORKEXERCISE - 2. Basic Accounting Terms (Objective Type Questions )
12 Videos
- PROJECT WORKBOOK - TS GREWALCHAPTER - PROJECT WORKEXERCISE - Objective Type Questions
10 Videos
- ORIGIN OF TRANSACTIONS-SOURCE DOCUMENTS AND PREPARATION OF VOUCHERS BOOK - TS GREWALCHAPTER - ORIGIN OF TRANSACTIONS-SOURCE DOCUMENTS AND PREPARATION OF VOUCHERS EXERCISE - SHORT ANSWER TYPE QUESTIONS
5 Videos
- PROVISIONS AND RESERVESBOOK - TS GREWALCHAPTER - PROVISIONS AND RESERVESEXERCISE - VERY SHORT ANSWER TPYE QUESTIONS
13 Videos
Similar Questions
Knowledge Check
Total of the Sales Book is posted to
Acredit of the Sales Account.Bcredit of the Purchases Account.Ccredit of the Capital AccountDcredit of Customer's Accounts.Total of Sales Return Column in the Sales Return Book is posted to :
Option1 Sales A/c - Debit
Option2 Sales A/c - Credit
Option3 Sales Return A/c - Debit
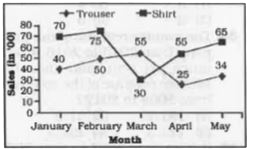
Option4 Sales Return A/c - CreditASales A/c - DebitBSales A/c - CreditCSales Return A/c - DebitDSales Return A/c - CreditThe line chart given blow represents the sales (in 00) of trousers ans shirts for five months.

Total sale of shirts for five months is how much per cent more than the total sale of trousers for five months?A30.84B38.46C44.61D49.94
The total sales of 100 outlets of a shopping complex is Rs. 45,000. The average sales of 30 of them is Rs.350. The average sale of another 20 of them is Rs. 860. Find the average sale of the remaining outlets (In rupees)
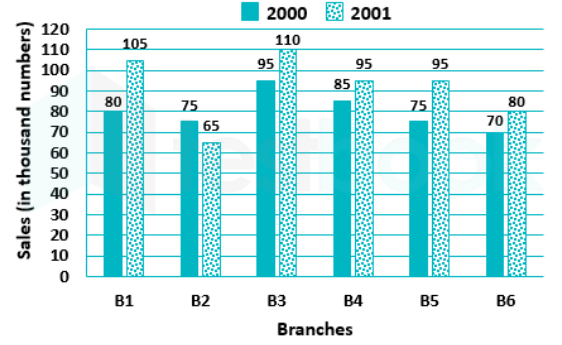
View SolutionStudy the following bar graph and answer the question that follows.

The ratio of the total sales of books for branches B2, B4 and B5 taken together for the year 2000 to the total sales of books for branches B1, B3 and B6 taken together for the year 2001 is:
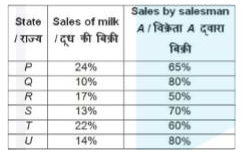
View SolutionThe table below shows the sales of milk in six different states as a percentage of total sales. In each state only two milkmen A and B sell the milk. The table below shows the sales of salesman A as percentage of total sale of milk in each state. The total sales of milk is 200000 litres.

What will be difference (in litres) in the sale of milk in state T by salesmen B and the total sale of milk in state R and S together?
View SolutionPeriodic total of Sales Return Journal is posted to the
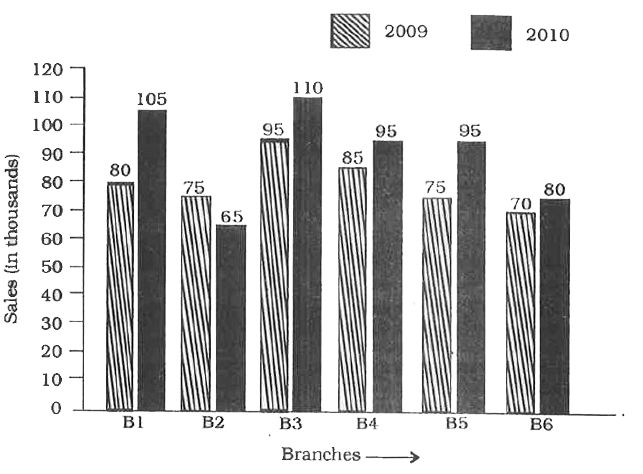
View SolutionIn the following bar diagram sales of books (in thousand numbers) from six branches - B1, B2, B3, B4, B5 and B6 of a publishing company in 2009 and 2010 have been shown. Study the graph and answer the questions.

Total sales of branch B6 for both the years is x per cent of the total sales of branch B3 for both the years. The value of x is
View Solution
