Revenue Expenditure is transferred to
Profit and Loss Account
Trading and Profit and Loss Account
Balance Sheet
None of these
The correct Answer is:B
Trading and Profit and Loss Account
Topper's Solved these Questions
- FINANCIAL STATEMENTS OF SOLE PROPRIETORSHIPBOOK - TS GREWALCHAPTER - FINANCIAL STATEMENTS OF SOLE PROPRIETORSHIPEXERCISE - Questions
2 Videos
- FINANCIAL STATEMENTS OF SOLE PROPRIETORSHIPBOOK - TS GREWALCHAPTER - FINANCIAL STATEMENTS OF SOLE PROPRIETORSHIPEXERCISE - very short answer type questions
106 Videos
- FINANCIAL STATEMENTS OF SOLE PROPRIETORSHIPBOOK - TS GREWALCHAPTER - FINANCIAL STATEMENTS OF SOLE PROPRIETORSHIPEXERCISE - Higher Order Thinking skills
26 Videos
- DEPRECIATIONBOOK - TS GREWALCHAPTER - DEPRECIATIONEXERCISE - EVALUATION QUESTIONS: QUESTIONS WITH MISSING VALUES
3 Videos
- INTRODUCTION TO ACCOUNTINGBOOK - TS GREWALCHAPTER - INTRODUCTION TO ACCOUNTINGEXERCISE - Short Answer Type Questions
19 Videos
Similar Questions
Knowledge Check
At the time of dissolution of partnership firm, Deferred Revenue Expenditure (Advertisement Expenditure) is transferred to
ACapital Account of PartnersBRealisation AccountCCash AccountDPartner's Loan Account
Classify the following as capital expenditure, revenue expenditure and deferred revenue expenditure for a cloth merchant:
(i) Preliminary Expenses, (ii) Purchase of Furniture,
(iii) Payment of Salary, (iv) Expenses paid for Construction of Building
View SolutionClassify the following as capital expenditure, revenue expenditure and deferred revenue expenditure for a cloth merchant:
(i) Preliminary Expenses, (ii) Purchase of Furniture,
(iii) Payment of Salary, (iv) Expenses paid for Construction of Building
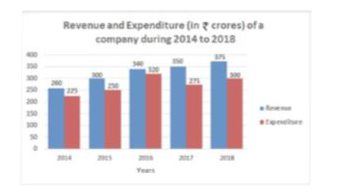
View SolutionThe given Bar Graph presents the Revenue and Expenditure (in crores of Rupees ) of a company during the five year period, 2014-2018.

What is the ratio of the total revenue of the company in 2015 and 2018 to that of its expenditure in 2014 and 2018 ?
View SolutionThe given Bar Graph presents the Revenue and Expenditure (in crores of Rupees ) of a company during the five year period, 2014-2018.

The expenditure of the company in 2017 is what percentage less than the average revenue (per year) in 2014, 2015 and 2016 ?
View SolutionThe given Bar Graph presents the Revenue and Expenditure (in crores of Rupees ) of a company during the five year period, 2014-2018.

The total expenditure of the company from 2016 to 2018 is what percentage (neatest to an integer) of the total revenue for the five year period?
View SolutionGiven an example of an item which may have been treated wrontly as Revenue Expenditure and charged in the Trading Account when it should have been treated as Capital Expenditure?
View SolutionGiven an example of an item which may have been treated wrontly as Revenue Expenditure and charged in the Trading Account when it should have been treated as Capital Expenditure?
View Solution
