Which represent correct hexaploid nature of wheat?

The correct Answer is:d
Step by step video, text & image solution for Which represent correct hexaploid nature of wheat? by Biology experts to help you in doubts & scoring excellent marks in Class 12 exams.
Updated on:21/07/2023Topper's Solved these Questions
- CHROMOSOMAL BASIS OF INHERITANCEBOOK - DINESH PUBLICATIONCHAPTER - CHROMOSOMAL BASIS OF INHERITANCEEXERCISE - Check Your Grasp
45 Videos
- CHORDATA- PROTOCHORDATABOOK - DINESH PUBLICATIONCHAPTER - CHORDATA- PROTOCHORDATAEXERCISE - CYG
7 Videos
- COELENTERATA AND CTENOPHORA (OR CNIDARIA AND ACNIDARIA)BOOK - DINESH PUBLICATIONCHAPTER - COELENTERATA AND CTENOPHORA (OR CNIDARIA AND ACNIDARIA)EXERCISE - CYG
9 Videos
Similar Questions
Knowledge Check
Which does not represent correct method
ATiCl2 + Mg → Ti + MgCl : KrollBNi(CO)4 → Ni + 4CO : MondCAg2CO3 → 2Ag + CO2 + 12O2 : Van ArkelDZrI4 → Zr + 2I2 : Van ArkelWhich does not represent correct method ?
ATiCl2+2Mg→Ti+2MgCl2 : KrollBNi(CO)4→Ni+4CO :MondCAg2CO3→2Ag+CO2+12O2 : Van ArkelDZrI4→Zr+2I2 :Van ArkelWhich does not represent correct method?
ATiC12+2Mg→Ti+2MgC12:KrollBNi(CO)4→Ni+4CO:MondCAg2CO3→2Ag+CO2+O2:vanArketDZrI4→Zr+2I2:vanArket

The rate of Hofmann degradation is influenced by the nature of substituent, G. which of the following represents the correct decreasing rate of degradation with various substituents?
View SolutionWhich is the correct order of basic nature?
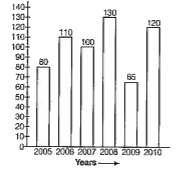
View SolutionStudy the given bar chart carefully and answer the questions based on it.
Bar chart represents the production (in lakh tonne) of wheat from 2005 to 2010.

For which of the following year, wheat production is maximum?
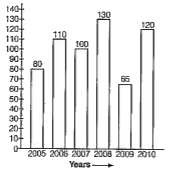
View SolutionStudy the given bar chart carefully and answer the questions based on it.
Bar chart represents the production (in lakh tonne) of wheat from 2005 to 2010.

For which of the following year, wheat production is minimum?
View SolutionWhich of the following represent correct product formation?
View Solution
